Optical Characterization of Aerosols in Gansu Province Based on CE-318 Observations

  • Fangfang HUANG ,
  • Weiqiang MA ,
  • Suichan WANG ,
  • Hong ZHANG ,
  • Xiaoyi KONG ,
  • Pinrui LU ,
  • Xudong WANG ,
  • Hao LIU ,
  • Yidan YAN
Expand
  • 1. Gansu Meteorological Information and Technology Support Center,Gansu Meteorological Bureau,Lanzhou 730020,Gansu,China
    2. Land-Atmosphere Interaction and its Climatic Effects Group,State Key Laboratory of Tibetan Plateau Earth System,Environment and Resources (TPESER),Institute of Tibetan Plateau Research,Chinese Academy of Sciences,Beijing 100101,China
    3. College of Atmospheric Science,Lanzhou University,Lanzhou 730000,Gansu,China
    4. National Observation and Research Station for Qomolongma Special Atmospheric Processes and Environmental Changes,Dingri 858200,Xizang,China
    5. China -Pakistan Joint Research Center on Earth Sciences,Chinese Academy of Sciences,Islamabad 45320,Pakistan
    6. Lanzhou Meteorological Administration,Lanzhou 730030,Gansu,China

Received date: 2022-07-19

  Revised date: 2023-03-28

  Online published: 2024-01-11

Abstract

The quantitative analysis of ground-based observations of atmospheric aerosols is a basic way to understand the optical properties of aerosols and the characteristics of atmospheric pollution, which can provide a certain basis for exploring the direction of pollution control.In recent years, there are few studies on the analysis of aerosol optical properties in different regions of Gansu Province using ground-based observations.In order to understand the atmospheric aerosol optical characteristics of different land surfaces in Gansu Province, we obtained the aerosol optical depth (AOD) of four stations in Gansu Province through ASTPwin software based on CE-318 solar photometer observations from April 2018 to September 2020 and calculated the Angstrom wavelength index α.The distribution and variation characteristics of AOD and α in different regions of Gansu Province in different seasons and the relationship between aerosol optical depth and wavelength index were analyzed.The results show that: (1) the changes of AOD in each wavelength band tend to be consistent in all stations during the observation period, and the AOD value decreases with increasing wavelength.The AOD values of Lanzhou and Gaolan Mountain were the highest in winter, followed by spring and autumn, and the lowest in summer.The winter and spring AOD values of Lanzhou exceeded the annual average by 14.98% and 4.68%, respectively, and the winter AOD value of Gaolan Mountain exceeded the annual average by 3.88%.Dunhuang and Minqin both had the highest AOD values in spring, which were 24.49% and 26.30% higher than their respective annual averages.The seasonal distribution of AOD in Dunhuang was: spring > summer > winter > autumn, while Minqin showed a trend of gradually smaller values from spring to winter.(2) The dominant particles in Lanzhou and Gaolan Mountain are coarse modal in spring and summer, while fine particles dominate in autumn and winter.Dunhuang and Minqin atmospheric aerosols are dominated by coarse modal particles all year round.In the winter of 2019, the AOD value of Lanzhou was 68.0% higher than that of Gaolan Mountain; Dunhuang and Minqin had more serious sand and dust aerosol pollution in spring 2019, and the AOD value of Dunhuang exceeded that of Minqin by 42.42%.(3) The frequency distribution of AOD and α at all sites showed a single-peaked curve, with variability in the range of high-frequency distribution of AOD in different seasons, but they were all below 1.0.The distribution of high-frequency range of α was more complex, with the range of α distribution less than 1.0 in spring in Lanzhou, spring and summer in Gaolan Mountain, four seasons in Dunhuang, and spring, summer and autumn in Minqin, while α in summer, autumn and winter in Lanzhou, autumn and winter in Gaolan Mountain, and winter in Minqin was mainly distributed at 1.1 or above.(4) The relationship between AOD and α differs in different seasons, which shows that the size of the dominant particles of aerosol differs in different seasons when the atmosphere is seriously or locally polluted.In spring when the atmosphere is in local or serious pollution and in summer when the atmosphere is in local pollution, the aerosols at the four stations are mainly large particle size, with the contribution of sand and dust aerosols being larger.In summer when the atmosphere is in serious pollution, Gaolan Mountain aerosol is mainly fine mode particles, Lanzhou, Dunhuang and Minqin aerosol is still controlled by coarse mode, but the proportion of pollution caused by small particle size in Lanzhou is higher than the remaining two stations, of which more than 85% belongs to urban industrial - aerosol pollution.In autumn, when the atmosphere is in serious pollution, Lanzhou and Gaolan Mountain are both dominated by fine modal particles, of which urban industrial-aerosols account for a significant increase, while Dunhuang and Minqin are still dominated by coarse modal particles, of which dust aerosols account for a large proportion.In winter, Lanzhou is still dominated by fine modal particles, while the other three stations are dominated by coarse modal particles.In winter, Dunhuang and Minqin are dominated by coarse and fine modal particles, while Gaolan Mountain is dominated by fine modal particles when the atmosphere is locally polluted.The analysis shows that, in general, aerosol pollution in the northern part of Gansu is dominated by sand and dust aerosols, while aerosol pollution in the southern part of Gansu shows alternating coarse-mode and fine-mode particles, which provides some references for the next study of aerosol properties and atmospheric pollution characteristics in different regions of Gansu by combining satellite remote sensing data.

Cite this article

Fangfang HUANG , Weiqiang MA , Suichan WANG , Hong ZHANG , Xiaoyi KONG , Pinrui LU , Xudong WANG , Hao LIU , Yidan YAN . Optical Characterization of Aerosols in Gansu Province Based on CE-318 Observations[J]. Plateau Meteorology, 2024 , 43(1) : 241 -253 . DOI: 10.7522/j.issn.1000-0534.2023.00030

1 引言

大气气溶胶是分散在空气中所有固态或液态颗粒状物质组成的一个较为稳定的悬浮体系, 大部分颗粒物直径处于10-2~10-3μm(卢永正, 2000; 毛节泰等, 2002)。气溶胶粒子通过直接或间接辐射效应在地球辐射平衡和气候变化中发挥着重要作用(Ramanathan et al, 2007; Li et al, 2011)。此外, 气溶胶在大气物理和化学过程的研究中不可或缺, 可影响到大气颗粒物的浓度、分布及水循环等方面, 可能引发环境和公共卫生问题(Gui et al, 2017; 罗宇翔等, 2012; Tie et al, 2009; Schäfer et al, 2011)。相关研究中常用气溶胶光学厚度(AOD)和Angstrom波长指数(α)来进行大气气溶胶光学特性分析, 其中, AOD的定义是介质的消光系数在垂直方向上的积分, 描述气溶胶对光的削减程度, 通过α可以了解到气溶胶粒子的尺度, 两者能反映出空气污染的程度和气溶胶粒子类型(杨志峰等, 2008; 刘浩等, 2015)。AOD和α是研究大气气溶胶辐射气候效应的重要参考指标(Twomey, 1977), 因此, 探讨这两个参数的变化规律及其关系在大气气溶胶和气候变化研究方面是比较重要的。
地基遥感观测是最早的气溶胶特性观测技术, 同时其观测精度比较高, 常被用于检验卫星产品, 它可以提供不间断观测的精准的气溶胶光学特性资料(王贺等, 2017; 刘莹等, 2019)。CE-318型太阳光度计是当前监测光学厚度参数运用最广泛的仪器(李霞等, 2005; 麻金继等, 2005; Perrone et al, 2005; Delphine et al, 2005), 国内外学者已经利用该仪器产生的数据开展了大量研究, 包括对太阳光度计在探测气溶胶方面的优势及其资料在我国的应用前景的解读(任宜勇等, 2006)、各个城市气溶胶监测和光学特性的研究(刘玉杰等, 2004; 徐丹等, 2015; 吴立新等, 2016; 李海龙等, 2018; 牟福生等, 2018; 王智敏等, 2019; 刘慧等, 2020)、复杂天气过程中气溶胶特性的研究(于杰等, 2016)以及太阳光度计资料在卫星数据验证方面的研究(马玉娟等, 2020; 于志翔等, 2022), 这为深入探讨区域大气环境提供了有力支撑。
已有的研究结果显示, 近5年利用地基观测数据对甘肃省多个站点的大气气溶胶光学特性方面的研究较为匮乏。甘肃省位于中国西部地区, 地处黄河中上游, 地域辽阔, 境内地形复杂, 沙漠、戈壁广泛分布的河西走廊地区, 植被稀少, 沙尘物质极其丰富, 沙尘气溶胶特性还有待研究。基于以上论述, 本研究利用CE-318太阳光度计观测数据计算分析了兰州、皋兰山、敦煌和民勤四个站点的气溶胶光学特性, 在对比研究四个站点AOD、α值的频率分布特征的同时对各站点AOD和α的关系进行了讨论。

2 研究区域与观测数据

2.1 站点介绍

本研究观测场地为甘肃省四个布设CE-318型自动跟踪扫描太阳光度计的站点, 均属于温带大陆性气候。兰州市区黄河穿城而过, 呈峡谷与盆地相间的珠串型河谷; 皋兰山位于兰州城南, 相比于兰州市区其地势较高; 敦煌境内地貌以沙漠、戈壁为主, 绿洲仅占总面积的4.5%; 民勤境内低山丘陵、平原、沙漠、戈壁等交错分布, 属气候变化敏感区和生态环境脆弱区(菅煜婷等, 2022)。站点的经纬度、海拔信息见表1。
表1 台站基本信息

Table 1 Basic information of the sites

台站 纬度 经度 海拔/m
兰州 36.04°N 103.88°E 1517.2
皋兰山 36.00°N 103.85°E 2161.5
敦煌 40.14°N 94.68°E 1137.5
民勤 38.63°N 103.08°E 1367.5

2.2 数据来源和仪器介绍

CE-318型太阳光度计是法国CIMEL公司制造的一种自动跟踪扫描的太阳光度计, 通过测量不同波段的太阳辐射和天空辐射来获取大气气溶胶光学特性。该仪器具有等天顶角扫描、主平面扫描和极化平面扫描三种天空辐射扫描方式, 在可见光、近红外波段有8个光谱通道: 1020 nm、870 nm、670 nm、440 nm、936 nm和870 nm的3个极化通道。本研究中太阳光度计资料来自甘肃省气象信息与技术装备保障中心, 观测时段为2018年4月至2020年9月, 平均观测时间间隔为15 min, 四个站点的太阳光度计由中国气象局气象探测中心每年定标一次。利用CE-318型太阳光度计获取的各通道太阳直射辐射测量值可用来反演得到大气光学厚度、气溶胶参数等。本文主要分析AOD和α两个基本气溶胶光学特性参数, AOD值越大, 表示大气的污染程度越严重; α值越大, 表示大气污染粒子的粒径尺度越小。
本文AOD数据是经由ASTPwin软件处理计算后的Level1.5(云筛选后的)气溶胶反演产品, Angstrom波长指数 α为利用没有水汽影响的440 nm和870 nm波段数据进行计算所得, 计算公式如下:
α = - l n   τ α λ 1 / τ α λ 2 l n   λ 1 / λ 2
式中: λ 1=440 nm, λ 2=870 nm, τ α λ 1和 τ α ( λ 2 )分别为440 nm和870 nm两个通道的气溶胶光学厚度; α表示Angstrom波长指数, 反映气溶胶粒子的粒径大小, α<1表示气溶胶主要以粗模态形式存在, α>1则代表气溶胶以细模态形式存在; 城市-工业气溶胶一般为1.1≤α≤2.4, 沙尘气溶胶一般表现为-1≤α≤0.5(Dubovik et al, 2002; 李明明等, 2018)。
为增加观测数据的可靠性, 按照AERONET的统一标准, 将日观测数据不少于3个(云层没完全遮蔽太阳)的观测日作为有效观测日(吴立新等, 2016; 郑玉蓉等, 2022), 据此整理得到有效观测日分别为兰州603 d, 皋兰山400 d, 敦煌757 d, 民勤716 d(表2)。考虑到分析光学参数的季节变化, 将 3 -5月、6 -8月、9 -11月和12月至次年2月划分为春、夏、秋、冬四季, 其中, 2018年春季是4、5月数据, 2020年仅有春夏两季数据, 2019年四个站点数据相对完整, 文中将其作为完整年度进行AOD和 α的季节变化分析。
表2 AOD有效观测日数

Table 2 Number of valid AOD observation days

季节 站点 季节有效日数/d
2018年 2019年 2020年
春季 兰州 54 77 62
皋兰山 50 36 61
敦煌 57 79 91
民勤 57 75 85
夏季 兰州 67 62 34
皋兰山 18 36 0
敦煌 82 78 88
民勤 75 72 79
秋季 兰州 47 47 0
皋兰山 14 47 0
敦煌 83 60 0
民勤 52 48 0
冬季 兰州 71 82 0
皋兰山 65 73 0
敦煌 48 91 0
民勤 85 88 0

3 结果与分析

3.1 气溶胶光学参数的时间变化特征分析

从图1可以看出, 观测时段内, 每个站点各波段AOD的变化趋于一致, 且AOD值大小与波长长度有关, 即AOD值随波长增加而减小。四个站点AOD峰值多出现于春、秋、冬季, 夏季大气状况较好。同时, 440 nm波段AOD 在数值上最接近所有波段AOD的平均值, 也跟其余波段 AOD 的时间变化趋势相一致。因此本文将 440 nm 波段的气溶胶光学厚度作为全波段的大气气溶胶光学厚度, 以下均选择四个站点该波段的AOD值进行分析。同样地, 由图1可知, 四个站点Angstrom波长指数α变化波动明显, 与AOD几乎呈相反的变化趋势。兰州和皋兰山的α值主要介于0.5~1.0, 个别月份存在高于1.0和低于0.5的情况。敦煌和民勤α值均小于1.0, 且敦煌大部分小于0.5。
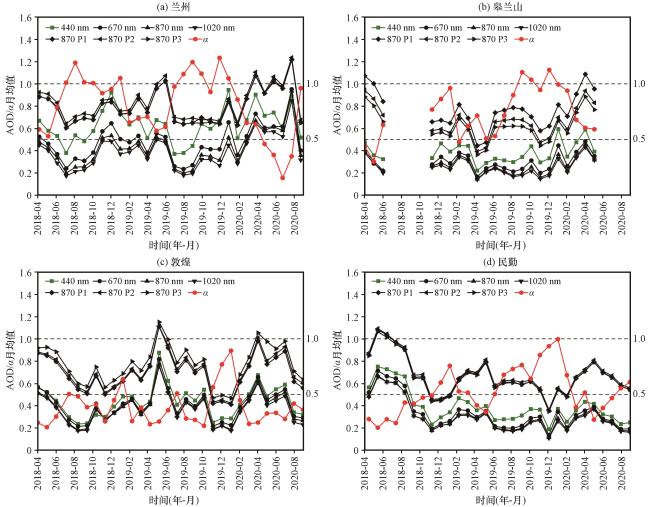
图1 观测时段内各波段AOD和α的月变化

Fig.1 Monthly variation of AOD and α in each band during the observation period

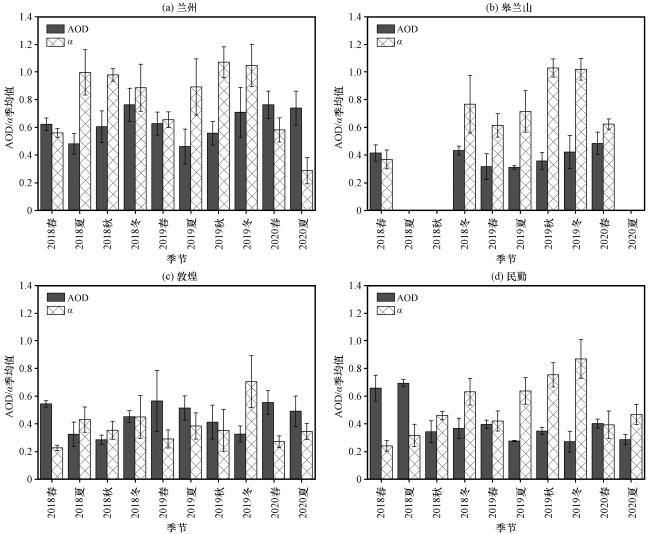
图2是四个站点AOD和α的季均值变化特征, 可以看出, 观测时段内兰州AOD季均值最大值出现在2018年冬季(0.765), 最小值在2019年夏季(0.462), 从这三年平均来看, AOD值季节分布由大到小分别为: 冬季(0.737)、春季(0.671)、秋季(0.580)、夏季(0.560)。皋兰山于2020年春季达到最大值(0.485), 2019年夏季则出现最小值(0.311), 这三年平均季节分布情况与兰州一致, 只是数值相应较小。敦煌AOD季均值最大出现于2019年春季(0.564), 在2018年秋季表现出最低值(0.285), 这三年整体平均来看, AOD季节分布从大到小排列为: 春季(0.554)、夏季(0.443)、冬季(0.389)、秋季(0.349)。民勤AOD季均值最大值出现在2018年夏季(0.693), 最小值在2019年冬季(0.271), 这三年平均季节分布从春到冬依次减小: 春季(0.485)、夏季(0.418)、秋季(0.345)、冬季(0.319)。从以上分析可知, 兰州AOD值均大于0.4, 可大致判断出其污染程度要高于其他三站。同样由图2可知四个站点α的季节差异。平均来看, 兰州α值的季节分布为: 秋季(1.026)>冬季(0.967)>夏季(0.726)>春季(0.599); 皋兰山分布情况与兰州一致。敦煌和民勤α值季节分布分别为: 冬季(0.577)>夏季(0.386)>秋季(0.352)>春季(0.262); 冬季(0.749)>秋季(0.606)>夏季(0.473)>春季(0.351)。α值的四季变化表现出, 大气气溶胶的主控粒子随季节变化而变化。兰州和皋兰山春夏季主控模态为粒径较大的粗粒子, 到秋冬季转变为细模态粒子主控。敦煌和民勤α值从春季到冬季逐渐增大, 但都处于1.0以下, 说明气溶胶均以粗模态形式存在。敦煌和民勤的AOD和α的变化呈相反特征, 即AOD高值时α表现为低值, 从侧面说明这两站出现污染时皆由粗粒子导致。兰州市和皋兰山冬季AOD最高, 大气气溶胶以小粒径粒子为主。因为特殊的气象条件和地理条件, 冬季人类活动使得气溶胶细颗粒增多, 兰州的河谷地形容易导致污染物堆积, 同时大气稳定、不利于污染物扩散的气象条件使得兰州市冬季污染较为严重(宋广宁等, 2013; 张小曳, 2014; 李梦倩, 2021)。位于城郊的皋兰山冬季同样以细模态粒子为主, 这可能是由于市区的细粒子扩散至山上造成的, 而且细粒子增多之后更容易向上层扩散的特性也可导致这一现象(赵秀娟等, 2005; 徐小红等, 2021; 盛丹睿等, 2021)。夏季兰州市和皋兰山气溶胶主控模态是粒径较大的粒子, 大风沙尘天气的减少使得AOD值降低。下垫面以沙漠、戈壁为主的敦煌和民勤整年的气溶胶主控粒子是粗模态粒子, 其中沙尘气溶胶占比很大, 春夏季沙尘天气较多, 是导致AOD高的主要原因。
图2 四个站点AOD与α的季节变化

Fig.2 Seasonal variation of AOD and α at the four sites

从表3可以看出, 2019年四个站点AOD和α的季节分布趋势大体与三年平均的变化一致。兰州和位于其城郊的皋兰山2019年冬季污染最严重, 且由细模态粒子主控, AOD和α值的离散度较高, 气溶胶参数均波动较大。杜韬等(2022)的研究结论表明, 虽然兰州近几十年来空气污染治理取得显著成效, 但冬季污染仍然较为严重, 且以细颗粒物占主导, 2019年冬季兰州的PM1、PM2.5、PM10、总悬浮颗粒物(TSP)的浓度均值分别为45.7 μg·m-3、70.4 μg·m-3、114 μg·m-3、136.3 μg·m-3(杜韬, 2022; 关勖, 2022; 陈雪, 2021)。敦煌和民勤2019年春季大气污染较严重, 主控粒子均为粗模态粒子, 主要表现为沙尘气溶胶。地处河西走廊的敦煌和民勤, 春季空气干燥、风速较大且沙尘较多, 沙尘暴是其最严重的灾害天气之一(黄悦等, 2021; 李岩瑛等, 2022)。这也解释了这两站在春季大气污染较为严重的原因。敦煌春季AOD、冬季α的离散度较高, 而民勤AOD和α的离散度均在冬季表现较高, 说明这两个站冬季的气溶胶粒子粒径大小波动较大。对比兰州和皋兰山, 同样是冬季AOD值最高、夏季最低, 但是兰州市区AOD值要比城郊的皋兰山分别高出68.0%和48.55%。敦煌和民勤AOD值都是春季最高、冬季最低, 敦煌比民勤分别高出42.42%和20.30%。
表3 2019年AOD和 α 的季均值及其标准差

Table 3 Seasonal mean and standard deviation of AOD and α in 2019

站点 气溶胶光学参数 春季 夏季 秋季 冬季
兰州 AOD 0.628±0.08 0.462±0.13 0.559±0.08 0.709±0.18
α 0.656±0.06 0.892±0.20 1.072±0.11 1.047±0.15
皋兰山 AOD 0.317±0.09 0.311±0.01 0.358±0.06 0.422±0.12
α 0.614±0.08 0.715±0.15 1.029±0.07 1.020±0.18
敦煌 AOD 0.564±0.22 0.513±0.09 0.412±0.12 0.326±0.06
α 0.290±0.07 0.384±0.09 0.352±0.15 0.704±0.19
民勤 AOD 0.396±0.03 0.275±0.01 0.347±0.03 0.271±0.08
α 0.420±0.07 0.637±0.10 0.753±0.09 0.868±0.14

3.2 气溶胶光学参数不同季节的频率分布

从图3的统计结果可以看出, 四个站点AOD的频率分布均呈单峰曲线, AOD在各个季节高频次区间有所不同, 但都处于1.0以下。兰州全年AOD主要分布在0.4~0.6和0.8~0.9, 其中春季和秋季处于0.4~0.6范围的分别占总样本数的45.08%和47.66%, 夏季介于0.3~0.5之间的占比为43.56%, 冬季分布比较分散, 处于0.8~0.9占比为15.13%, 0.5~0.6占比为14.47%。皋兰山全年AOD高频次范围分布在0.5以下, 其中春季和秋季处在0.2~0.4范围的分别占比为51.02%和63.94%, 夏季0.2~0.3范围的占比为36.17%, 冬季介于0.1~0.3的占比为40.58%, 0.3~0.4区间的占比为18.12%。敦煌全年AOD主要分布于0.4以下, 其中0.2~0.4范围的主要处于春夏季, 各自占比36.28%和45.97%, 介于0.1~0.2区间的主要在秋冬季, 分别占了31.02%和38.76%。民勤全年AOD主要处于0.3以下, 其中0.2~0.3区间主要集中在春、夏、秋三季, 分别占比为20.74%、28.32%和36.55%, 冬季大都处于0.1~0.2范围, 占比31.21%。
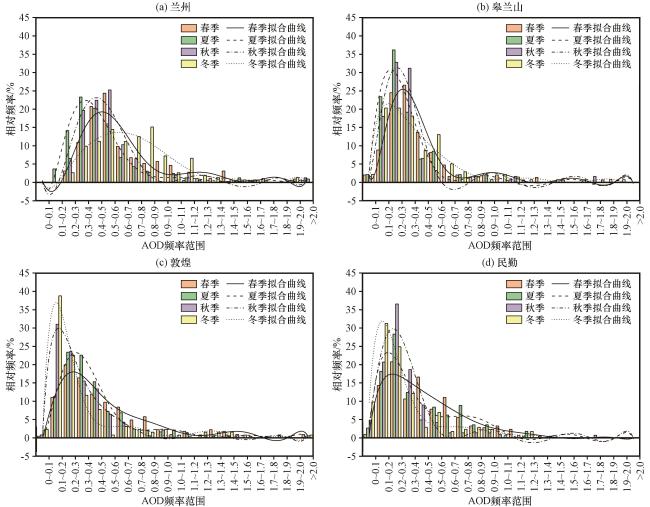
图3 四个站点各季AOD值出现相对频率分布

Fig.3 Relative frequency distribution of AOD values in each season at four sites

对比AOD, α的频率特征同样呈单峰曲线, 但曲线更为平缓(图4)。兰州全年α主要分布在0.4~0.5、0.6~0.7和0.9~1.3, 其中春季α主要出现在0.4~0.5和0.6~0.7, 占比为26.43%, 夏季主要介于1.1~1.3, 占比为23.23%, 秋季大多处于0.9~1.1(26.66%)和1.2~1.3(22.86%), 冬季大部分分布在区间1.2~1.3(23.68%)和1.0~1.1(13.82%)。由此可知兰州春季气溶胶粒子以粗模态粒子为主控, 部分由沙尘气溶胶占主导; 而秋季更加均匀的分布范围表明气溶胶粒子更为复杂, 存在细模态粒子和粗模态粒子同时存在的情况。皋兰山全年α大都分布在0.2~0.4、0.6~0.8、0.9~1.0和1.1~1.3范围, 其中, 春夏季主要处于0.8以下, 0.2~0.4区间的占比为39.71%, 0.6~0.8范围的占比为45.07%; 秋季主要介于1.2~1.3之间, 占比为18.33%, 冬季主要分布于1.1~1.2(22.46%)和0.9~1.0(15.94%), 可见冬季气溶胶不同时段存在大小粒径粒子共存或交替的现象。敦煌全年α大部分处于0.6以下, 其中, 春、夏、秋季均低于0.5, 春季0.1~0.3占比为49.77%, 夏季0.3~0.5占比为34.68%, 秋季0.2~0.4占比为47.68%, 冬季主要分布在区间0.2~0.3(11.90%)和0.5~0.6(10.32%)。这说明敦煌各季节气溶胶以粗模态粒子为主导, 特别是沙尘气溶胶。民勤分布特征与敦煌相似, 春、夏、秋季α主要分布范围均在0.5以下, 分别占比56.94%、29.64%和31.20%, 冬季频率分布较为广泛和复杂, 主要分布在0.7~1.0(35.05%)和1.0~1.2(23.56%), 说明民勤春、夏、秋季气溶胶以沙尘气溶胶为主, 而冬季主控模态是粗模态粒子和细模态粒子共存。
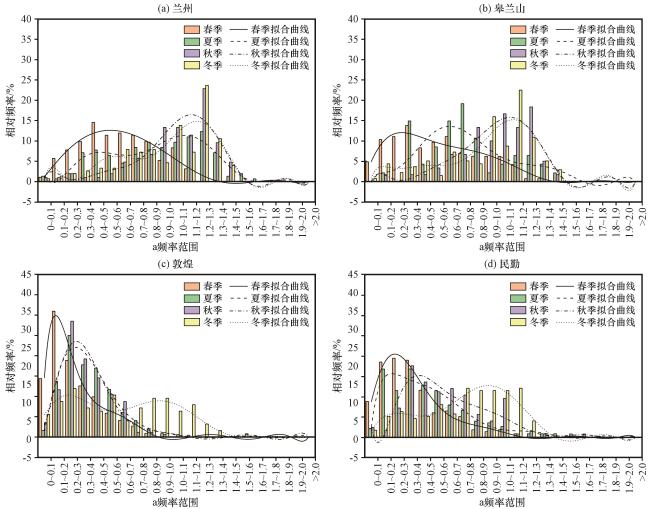
图4 四个站点各季α值出现相对频率分布

Fig.4 Relative frequency distribution of α values in each season at four sites

3.3 气溶胶光学厚度和波长指数的关系

相关研究根据AOD值划分出大气污染程度, 将AOD<0.02的情况划分为大气无污染状态, AOD<0.2表示大气呈现局部污染状况, 而AOD>0.4表示大气呈现显著的污染状况(曾唯等, 2020; Allen et al, 1965)。以下将按照该标准分析AOD与α之间的关系。
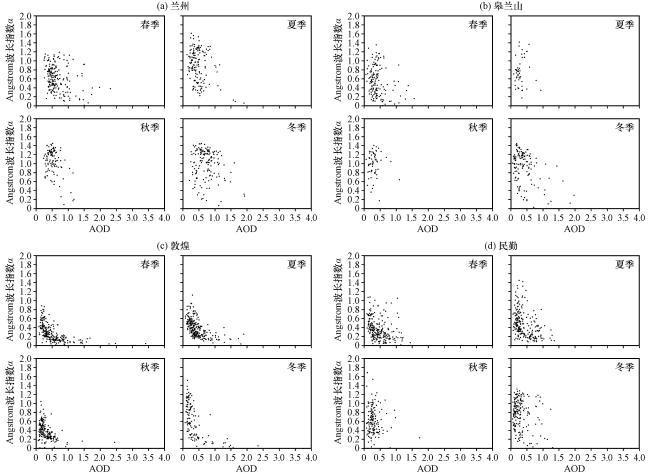
兰州春季明显污染天气占比高达85.5%, 相较于皋兰山, 兰州城区大气污染状况显然更严重, 春季明显污染天气日数是皋兰山(明显污染占比仅为38.1%)的2.2倍。而且, 兰州春、秋、冬季只要出现污染天气即为明显污染, 没有局部污染的状况。由表4、表5和图5可知, 春季大气处于明显或局部污染状态时, 兰州和皋兰山气溶胶粒子主要是粗模态, 其中沙尘气溶胶的贡献较大。夏季大气处于明显污染状况时, 兰州气溶胶依然由粗模态粒子主控, 但其主导性远低于春季, 细模态粒子导致的污染中85%以上属于城市工业-气溶胶污染; 皋兰山气溶胶主要是小粒径粒子(特别是城市工业-气溶胶), 这与夏秋季皋兰山人类活动增加有较大关系。夏季处于局部污染情况时, 兰州和皋兰山气溶胶粒子依然主要是大粒径粒子。秋季大气出现局部或者明显污染时, 兰州和皋兰山气溶胶大小粒径粒子同时存在, 其中城市工业-气溶胶所占比例显著增加。兰州冬季明显污染天气占比高达87.5%, 与春季相同, 是皋兰山(39.1%)的2.2倍。冬季明显污染状况下, 兰州与其秋季的细模态粒子占主导地位是一致的; 皋兰山主要是大粒径粒子。冬季局部污染状况下, 皋兰山以细模态粒子为主导(58.1%), 其中有72.2%由城市工业-气溶胶导致。
表4 大气局部污染状况下气溶胶粒子分布

Table 4 Aerosol particle distribution under the condition of local air pollution

站点 春季 夏季 秋季 冬季
α<1 α>1 α<1 α>1 α<1 α>1 α<1 α>1
兰州 - - 66.7%(无α<0.5) 33.4%(均为1.1 ≤ α ≤2.4) - - - -
皋兰山 87.5%(α<0.5 占28.6%) 12.5% 91.7%(α<0.5 占18.2%) 8.3%(均为1.1 ≤ α ≤2.4) 58.3%(无α<0.5) 41.7%(1.1 ≤ α ≤2.4占80%) 41.9%(无α<0.5) 58.1%(1.1 ≤ α ≤2.4占72.2%)
敦煌 100%(α<0.5 占53.8%) 0 100%(α<0.5 占31%) 0 98.4%(α<0.5 占59%) 1.6% 63.5%(α<0.5 占18.2%) 38.5%(1.1 ≤ α ≤2.4占65%)
民勤 93.9%(α<0.5 占54.8%) 6.1% 89.4%(α<0.5 占 47.6%) 10.6%(1.1 ≤ α ≤2.4占60%) 86.5%(α<0.5 占53.1%) 13.5%(1.1 ≤ α ≤2.4占40%) 71.8%(α<0.5 占19.6%) 28.2%(1.1 ≤ α ≤2.4占60%)

-表示无数据

表5 大气污染严重状况下气溶胶粒子分布

Table 5 Aerosol particle distribution under the condition of severe air pollution

站点 春季 夏季 秋季 冬季
α<1 α>1 α<1 α>1 α<1 α>1 α<1 α>1
兰州 91.5%(α<0.5 占47%) 8.5% 63.2%(α<0.5 占50%) 36.8%(1.1≤α≤ 2.4占85.7%) 39.2% 60.8%(1.1≤α≤2.4占77.1%) 39.8% 60.2%(1.1≤α≤ 2.4占77.5%)
皋兰山 85.7%(α<0.5 占70.8%) 14.3% 44.4% 55.6%(1.1≤α≤ 2.4占80%) 40.0% 60.0%(1.1≤α≤2.4占50%) 63.0%(α<0.5 占38.2%) 37.0%(1.1≤α≤ 2.4占80%)
敦煌 100%(α<0.5 占98.3%) 0 100%(α<0.5 占93.2%) 0 100%(α<0.5 占98.1%) 0 100%(α<0.5 占90.6%) 0
民勤 99.1%(α<0.5 占87.0%) 0.9% 97.7%(α<0.5 占85.9%) 2.3% 88.9%(α<0.5 占62.5%) 11.1% 81.1%(α<0.5 占43.3%) 18.9%
图5 AOD和Angstrom波长指数α的散点图

Fig.5 Scatter plot of AOD and Angstrom wavelength index α

同样结合表4、 表5和图5, 敦煌春夏季气溶胶粒子全部是粗模态, 局部污染时, 沙尘气溶胶贡献率分别为53.8%和31.0%, 明显污染时, 沙尘气溶胶贡献较大, 分别为98.3%和93.2%。秋季局部污染时, 敦煌气溶胶仍主要是大粒径粒子。冬季大气处于局部污染状况时, 敦煌气溶胶由大小粒径粒子共同组成, 但大粒径粒子仍多于小粒径。秋冬季大气污染明显时, 敦煌气溶胶全部是粗模态粒子, 其中沙尘气溶胶占比偏重。民勤春夏季大气污染的分布情况与敦煌类似, 局部污染时, 气溶胶主要由粗模态粒子造成, 其中沙尘气溶胶占到了比重的一半。明显污染时主控粒子与局部污染一致, 但沙尘气溶胶比重明显增加。民勤秋冬季明显污染时依然主要是较大粒径粒子, 其中同样有一半的比重由沙尘气溶胶贡献。局部污染时, 大小粒径粒子同时存在, 但粗模态依然占主导, 其中冬季小粒径粒子占比偏重。

4 结论

利用甘肃省2018年4月至2020年9月的CE-318太阳光度计观测资料, 分析探讨了兰州、皋兰山、敦煌和民勤的气溶胶光学参数AOD和α的时间变化特征、不同季节AOD和α的频率分布特征以及气溶胶光学厚度和波长指数的相关关系, 得到如下结论:
(1) 观测时段内, 兰州和皋兰山AOD值冬季最高, 春、秋季次之, 夏季最低, 兰州冬、春季AOD值分别比年均值超出14.98%和4.68%, 皋兰山冬季AOD值比年均值超出3.88%。敦煌和民勤AOD值均为春季最高, 分别比各自的年均值高出24.49%和26.30%。敦煌AOD季节分布为: 春季>夏季>冬季>秋季, 而民勤则表现为从春到冬季逐渐较小的趋势。
(2) 从α的季节变化趋势可以得出, 兰州和皋兰山春夏季主控模态为粒径较大的粗粒子, 到秋冬季转变为细模态粒子主控。敦煌和民勤大气气溶胶常年由粗模态粒子主控。
(3) 以2019年为例, 冬季兰州污染最为严重, 且以细颗粒物占主导, 兰州市区AOD值比其城郊的皋兰山高出68.0%。敦煌和民勤春季污染较为严重, 主要表现为沙尘气溶胶, 敦煌AOD值比民勤超出42.42%。
(4) 四个站点AOD和α的频率分布均呈单峰曲线, 不同季节AOD高频次分布范围存在差异性, 但都处于1.0以下。α的高频次范围分布较为复杂, 兰州春季、皋兰山春夏季、敦煌四季、民勤春夏秋季, α分布区间均小于1.0, 而兰州夏秋冬季、皋兰山秋冬季、民勤冬季α主要分布于1.1以上。
(5) 不同季节AOD和α的关系存在差异。春季大气出现局部或者明显污染、夏季大气局部污染时, 四个站点气溶胶主要是大粒径粒子, 其中沙尘气溶胶的贡献较大。夏季大气处于明显污染时, 皋兰山气溶胶主要是细模态粒子, 兰州、敦煌、民勤气溶胶依然由粗模态主控, 但是兰州小粒径粒子导致的污染比重高于其余两站, 其中85%以上属于城市工业-气溶胶污染。秋季大气处于明显污染状况时, 兰州和皋兰山均由细模态粒子主导, 其中城市工业-气溶胶占比明显增加, 而敦煌和民勤依然由粗模态粒子主导, 其中沙尘气溶胶占比偏重。冬季大气明显污染时, 兰州依然由细模态粒子主导, 而其他三站由粗模态粒子占据主导地位, 冬季大气局部污染时, 敦煌和民勤粗模态粒子与细模态粒子同时出现, 皋兰山以细模态粒子为主。
综上, 从甘肃省四个站点的AOD和α及其之间的联系出发分析了其气溶胶光学特性, 初步探讨了甘肃省气溶胶光学特性的分布特征, 即甘肃偏北地区气溶胶以沙尘气溶胶为主, 而偏南地区气溶胶粒子表现为粗模态与细模态交替出现, 不同季节由于气候、降水、人类活动等的影响, AOD值差异较大。这对兰州环境问题提供一定参考的同时, 也为进一步探讨甘肃省气溶胶光学特性提供了基础, 卫星遥感与观测资料的结合将是下一步研究的重点。

References

null
Allen W H, 1965.Dictionary of technical terms for aerospace use[R].Washington, DC: NASA.
null
Six D, Fily M, Blarel L, et al, 2005.First aerosol optical thickness measurements at Dome C (East Antarctica).summer season 2003-2004[J].Atmospheric Environment, 39: 5041-5050.
null
Dubovik O, Holben B N, Eck T, et al, 2002.Variability of absorption and optical properties of key aerosol types observed in worldwide locations[J].Journal of the Atmospheric Science, 59(3): 590-608.
null
Gui K, Che H Z, Chen Q, et al, 2017.Water vapor variation and the effect of aerosols in China[J].Atmospheric Environment, 165: 322-335.DOI: 10.1016/j.atmosenv.2017.07.005 .
null
Li Z Q, Niu F, Fan J W, et al, 2011.Long-term impacts of aerosols on the vertical development of clouds and precipitation[J].Nature Geoscience, 4(12): 888-894.DOI: 10.1038/ngeo1313 .
null
Perrone M R, Santese M, Tafuro A M, et al, 2005.Aerosol load characterization over South-East Italy for one year of AERONET sun-photometer measurements[J].Atmospheric Research, 75: 111-133.
null
Ramanathan V, Li F, Ramana M V, et al, 2007.Atmospheric brown clouds: Hemispherical and regional variations in long-range transport, absorption, and radiative forcing[J].Journal of Geophysical Research-Atmospheres, 112: D22S21.DOI: 10.1029/2006JD008124 .
null
Sch?fer K, Thomas W, Peters A, et al, 2011.Influences of the 2010 Eyjafjallaj?kull volcanic plume on air quality in the northern Alpine region[J].Atmospheric Chemistry and Physics, 11: 8555-8575.DOI: 10.5194/acp-11-8555-2011 .
null
Tie X X, Wu D, Brasseur G, 2009.Lung cancer mortality and exposure to atmospheric aerosol particles in Guangzhou, China[J].Atmospheric Environment, 43: 2375-2377.DOI: 10.1016/j.atmosenv.2009.01.036 .
null
Twomey S A, 1977.The influence of pollution on the shortwave albedo of clouds[J].Atmospheric Sciences, 34(1): 1149-1152.DOI: 10.1175/1520-0469(1977)0342.0.CO; 2 .
null
陈雪, 2021.2013—2019年兰州市城市环境空气质量变化趋势研究[D].兰州: 兰州大学.DOI: 10.27204/d.cnki.glzhu.2021. 002555.Chen X, 2021.Study on the variation trend of ambient air quality in Lanzhou from 2013 to 2019[D].Lanzhou: Lanzhou University.DOI: 10.27204/d.cnki.glzhu.2021.002555 .
null
杜韬, 2022.兰州大气细颗粒物和臭氧的污染特征、形成机制及相互作用[D].兰州: 兰州大学.DOI: 10.27204/d.cnki.glzhu.2022.000155.Du T, 2022.Pollution characteristics, formation mechanism and interaction of atmospheric fine particulate matter and ozone in Lanzhou[D].Lanzhou: Lanzhou university.DOI: 10.27204/d.cnki.glzhu.2022.000155 .
null
关勖, 2022.西北半干旱区典型城市吸收性气溶胶的垂直分布和辐射效应[D].兰州: 兰州大学.DOI: 10.27204/d.cnki.glzhu.2022.000152.Guan X, 2022.Guan vertical distribution and radiative effects of absorbing aerosols in a typical city in the semi-arid region of northwest China[D].Lanzhou: Lanzhou university.DOI: 10.27204/d.cnki.glzhu.2022.000152 .
null
黄悦, 陈斌, 董莉, 等, 2021.利用星载和地基激光雷达分析2019年5月东亚沙尘天气过程[J].大气科学, 45(3): 524-538.DOI: 10.3878/j.issn.1006-9895.2008.19249.Huang Y ,
null
Chen B, Dong L, et al, 2021.Analysis of a dust weather process over East Asia in May 2019 based on satellite and ground-based lidar[J].Chinese Journal of Atmospheric Sciences, 45(3): 524-538.DOI: 10.3878/j.issn.1006-9895.2008.19249 .
null
菅煜婷, 张勃, 黄浩, 2022. 近 58年甘肃气候变化区域差异分析及环流影响[J].高原气象, 41(5): 1291-1301.DOI: 10.7522/j.issn.1000-0534.2021.00066.Jian Y T ,
null
Zhang B, Huang H, 2022.Regional difference analysis of climate change in Gansu province in recent 58 years and its impact on circulation[J].Plateau Meteorology, 41(5): 1291-1301.DOI: 10.7522/j.issn. 1000-0534.2021.00066 .
null
李海龙, 张自力, 李正泉, 等, 2018.基于CE318数据的杭州市气溶胶光学特征研究[J].科技通报, 34(6): 46-53.DOI: 10. 13774/j.cnki.kjtb.2018.06.010.Li H L ,
null
Zhang Z L, Li Z Q, et al, 2018.Aerosol optical properties in Hangzhou based on CE318 data[J].Bulletin of Science And Technology, 34(6): 46-53.DOI: 10.13774/j.cnki.kjtb.2018.06.010 .
null
李梦倩, 2021.兰州市二次有机气溶胶生成潜势及污染特征研究[D].兰州: 兰州大学.DOI: 10.27204/d.cnki.glzhu. 2021. 002397.Li M Q, 2021.Formation potential and pollution characteristics of secondary organic aerosol in Lanzhou, China[D].Lanzhou: Lanzhou University.DOI: 10.27204/d.cnki.glzhu.2021.002397 .
null
李明明, 王雁, 闫世明, 等, 2018.基于太阳光度计大气气溶胶光学厚度变化特征研究[C].北京: 第 35 届中国气象学会年会 S12大气成分与天气、气候变化与环境影响暨环境气象预报及影响评估, 280-286.Li M M, Wang Y, Yan S M, et al, 2018.Variation Characteristics of Atmospheric Aerosol Optical Depth in Taiyuan[C].Beijing: 35th Annual Meeting of the Chinese Meteorological Society S12 Atmospheric Composition and Weather, Climate Change and Environmental Impacts and Environmental Meteorological Forecasting and Impact Assessment, 280-286.
null
李霞, 陈勇航, 胡秀清, 等, 2005.乌鲁木齐大气气溶胶的光学特性分析[J].中国环境科学(S1): 22-25.Li X, Chen Y H, Hu X Q, et al, 2005, Analysis of atmospheric aerosol optical properties over Urumqi[J].China Environmental Science(S1): 22-25.
null
李岩瑛, 张春燕, 张爱萍, 等, 2022.河西走廊春季沙尘暴大气边界层垂直结构特征[J].气象, 48(9): 1171-1185.
null
Li Y Y, Zhang C Y, Zhang A P, et al, 2022.Vertical structure characteristics of atmospheric boundary layer in spring sandstorm over Hexi Corridor[J].Meteorological Monthly, 48(9): 1171-1185.
null
刘浩, 高小明, 谢志英, 等, 2015.京津冀晋鲁区域气溶胶光学厚度的时空特征[J].环境科学学报, 35(5): 1506-1511.
null
Liu H, Gao X M, Xie Z Y, et al, 2015.Spatio-temporal characteristics of aerosol optical depth over Beijing-Tianjin-Hebei-Shanxi-Shandong region during 2000-2013[J].Acta Scientiae Circumstantiae, 35(5): 1506-1511.
null
刘慧, 余晔, 夏敦胜, 等, 2020.基于太阳光度计的兰州市秋季气溶胶光学特性[J].高原气象, 39(1): 204-212.DOI: 10.7522/j.issn.1000-0534.2019.00057.Liu H ,
null
Yu Y, Xia D S, et al, 2020.Analysis on autumn aerosol optical characteristics at Lanzhou with sun-photometer[J].Plateau Meteorology, 39(1): 204-212.DOI: 10.7522/j.issn.1000-0534.2019.00057 .
null
刘莹, 林爱文, 覃文敏, 等, 2019.1990~2017 年中国地区气溶胶光学厚度的时空分布及其主要影响类型[J].环境科学, 40(6): 2572-2581.DOI: 10.13227/j.hjkx.201809220.Liu Y ,
null
Lin A W, Tan W M, et al, 2019.Spatial-temporal distribution of aerosol optical depth and its main influence types in China during 1990-2017[J].Environmental Science, 40(6): 2572-2581.DOI: 10.13227/j.hjkx.201809220 .
null
刘玉杰, 牛生杰, 郑有飞, 2004.用CE-318太阳光度计资料研究银川地区气溶胶光学厚度特性[J].南京气象学院学报(5): 615-622.DOI: 10.13878/j.cnki.dqkxxb.2004.05.005.Liu Y J ,
null
Niu S J, Zheng Y F, 2004.Optical depth characteristics of Yinchuan atmospheric aerosols based on the CE-318 sun tracking spectrophotometer data[J].Journal of Nanjing Institute of Meteorology(5): 615-622.DOI: 10.13878/j.cnki.dqkxxb.2004.05.005 .
null
卢永正, 2000.气溶胶科学引论[M].北京: 原子能出版社.Lu Y Z, 2000.Introduction to aerosol science[M].Beijing: Atomic Energy Press.
null
罗宇翔, 陈娟, 郑小波, 等, 2012.近10 年中国大陆 MODIS遥感气溶胶光学厚度特征[J].生态环境学报, 21(5): 876-883.DOI: 10.16258/j.cnki.1674-5906.2012.05.026.Luo Y X ,
null
Chen J, Zheng X B, et al, 2012.Climatology of aerosol optical depth over China from recent 10 years of MODIS remote sensing data[J].Ecology and Environmental Sciences, 21(5): 876-883.DOI: 10.16258/j.cnki.1674-5906.2012.05.026 .
null
麻金继, 杨世植, 张玉平, 2005.厦门海域气溶胶光学特性的观测研究[J].量子电子学报, 2005(3): 473-476.
null
Ma J J, Yang S Z, Zhang Y P, 2005.Measurements and study of aerosol optical characterization over Xiamen sea region[J].Chinese Journal of Quantum Electronics, 2005(3): 473-476.
null
马玉娟, 陈艳拢, 赵建华, 等, 2020.北黄海圆岛海域MODIS气溶胶光学厚度产品有效性验证[J].海洋环境科学, 39(1): 99-105.DOI: 10.13634/j.cnki.mes.2020.01.014.Ma Y J ,
null
Chen Y L, Zhao J H, et al, 2020.Validation of MODIS aerosol optical depth over Yuandao in the North Yellow Sea[J].Marine Environmental Science, 39(1): 99-105.DOI: 10.13634/j.cnki.mes. 2020.01.014 .
null
毛节泰, 张军华, 王美华, 2002.中国大气气溶胶研究综述[J].气象学报, 60(5): 625-634.
null
Mao J Q, Zhang J H, Wang M H, 2002.Summary comment on research of atmospheric aerosl in China[J].Acta Meteorological Sinica, 60(5): 625-634.
null
牟福生, 李素文, 李昂, 等, 2018.利用太阳光度计进行北京地区气溶胶光学性质研究[J].大气与环境光学学报, 13(2): 88-96.
null
Mou F S, Li S W, Li A, et al, 2018.Aerosol optical properties in Beijing based on observation by sun-photometer[J].Journal of Atmospheric and Environmental Optics, 13(2): 88-96.
null
任宜勇, 李霞, 吕鸣, 等, 2006.CE318太阳光度计观测资料应用前景及其解读[J].气象科技, 2006(3): 349-352.DOI: 10.19517/j.1671-6345.2006.03.029.Ren Y Y ,
null
Li X, Lü M, et al, 2006.Application prospect of measurement by sun-photometer CE318 and retrieval methodology[J].Meteorological Science and Technology, 2006(3): 349-352.DOI: 10.19517/j.1671-6345. 2006.03.029 .
null
盛丹睿, 温小虎, 冯起, 等, 2021.2018年春季西北五省省会城市大气质量与健康风险评价[J].高原气象, 40(1): 200-208.DOI: 10.7522/j.issn.1000-0534.2019.00113.Sheng D R ,
null
Wen X H, Feng Q, et al, 2021.Air quality and health risk assessment of capital cities in five northwest provinces of China in the Spring of 2018[J].Plateau Meteorology, 40(1): 200-208.DOI: 10.7522/j.issn.1000-0534.2019 .
null
宋广宁, 杨小银, 付培健, 2013.兰州市大气气溶胶的太阳光度计观测分析[J].兰州大学学报(自然科学版), 49(4): 470-473+482.
null
Song G N, Yang X Y, Fu P J, 2013.Aerosol optical parameter observations in Lanzhou City[J].Journal of Lanzhou University (Natural Sciences), 49(4): 470-473+482.
null
王贺, 曹念文, 王鹏, 等, 2017.南京地区大气气溶胶综合观测与对比分析[J].遥感学报, 21(1): 125-135.
null
Wang H, Cao N W, Wang P, et al, 2017.Aerosol comprehensive observation and analysis in Nanjing area[J].Journal of Remote Sensing, 21(1): 125-135
null
王智敏, 热苏力·阿不拉, 冯婉悦, 等, 2019.新疆地区不同下垫面气溶胶光学特性的分析[J].冰川冻土, 41(6): 1367-1376.DOI: 10.7522/j.issn.1000-0240.2019.0087.Wang Z M ,
null
Abla Rasul, Feng W Y, et al, 2019.Analysis of aerosol optical properties on different underlying surfaces in Xinjiang[J].Journal of Glaciology and Geocryology, 41(6): 1367-1376.DOI: 10. 7522/j.issn.1000-0240.2019.0087 .
null
吴立新, 吕鑫, 秦凯, 等, 2016.基于太阳光度计地基观测的徐州气溶胶光学特性变化分析[J].科学通报, 61(20): 2287-2298.
null
Wu L X, Lü X, Qin K, et al, 2016.Analysis to Xuzhou aerosol optical characteristics with ground-based measurements by sun photometer[J].Science China Press, 61(20): 2287-2298.
null
徐丹, 邓孺孺, 陈启东, 等, 2015.基于CE318观测的广州市气溶胶光学特性[J].热带地理, 35(1): 21-28.DOI: 10.13284/j.cnki.rddl.002660.Xu D ,
null
Deng R R, Chen Q D, et al, 2015.Aerosol optical properties in Guangzhou based on the CE318 data[J].Tropical Geography, 35(1): 21-28.DOI: 10.13284/j.cnki.rddl.002660 .
null
徐小红, 余兴, 朱延年, 等, 2021.气溶胶对中国中纬度夏季低层风速的影响[J].高原气象, 40(2): 367-373.DOI: 10.7522/j.issn.1000-0534.2020.00037.Xu X H ,
null
Yu X, Zhu Y N, et al, 2021.Impact of aerosol on the summer wind speed at the lower layer in the mid-latitude of China[J].Plateau Meteorology, 40(2): 367-373.DOI: 10.7522/j.issn.1000-0534.2020.00037 .
null
杨志峰, 张小曳, 车慧正, 等, 2008.CE318型太阳光度计标定方法初探[J].应用气象学报, 19(3): 297-305.
null
Yang Z F, Zhang X Y, Che H Z, et al, 2008.An introductory study on the calibration of CE318 sun-photometer[J].Journal of Applied Meteorological Science, 19(3): 297-305.
null
于杰, 车慧正, 陈权亮, 等, 2016.2010-2012年我国西北地区沙尘个例气溶胶特征分析[J].气象与环境科学, 39(2): 33-40.DOI: 10.16765/j.cnki.1673-7148.2016.02.005.Yu J ,
null
Che H Z, Chen Q L, et al, 2016.Characteristics analysis of aerosol on dust weather cases in northwestern China from 2010 to 2012[J].Meteorological and Environmental Sciences, 39(2): 33-40.DOI: 10.16765/j.cnki.1673-7148.2016.02 .
null
于志翔, 李霞, 于晓晶, 等, 2022.2003-2019年新疆气溶胶光学厚度时空变化特征[J].干旱区地理, 45(2): 346-358.
null
Yu Z X, Li X, Yu X J, et al, 2022.Spatiotemporal variation characteristics of aerosol optical depth in Xinjiang from 2003 to 2019[J].Arid Land Geography, 45(2): 346-358.
null
曾唯, 郝庆菊, 赵仲婧, 等, 2020.北碚区气溶胶光学厚度特征及其与颗粒物浓度的相关性[J].环境科学, 41(3): 57-67.DOI: 10.13227/j.hjkx.201907068.Zeng W ,
null
Hao Q J, Zhao Z J, et al, 2020.Characteristics of aerosol optical depth in the urban area of Beibei and its correlation with particle concentration[J].Environmental Science, 41(3): 57-67.DOI: 10.13227/j.hjkx. 201907068 .
null
张小曳, 2014.中国不同区域大气气溶胶化学成分浓度、组成与来源特征[J].气象学报, 72(6): 1108-1117.
null
Zhang X Y, 2014.Characteristics of the chemical components of aerosol particles in the various regions over China[J].Acta Meteorological Sinica, 72(6): 1108-1117.
null
赵秀娟, 陈长和, 袁铁, 等, 2005.兰州冬季大气气溶胶光学厚度及其与能见度的关系[J].高原气象, 24(4): 617-622.
null
Zhao X J, Chen C H, Yuan T, et al, 2005.Lanzhou aerosol optical depth in winter and their relation with visibility[J].Plateau Meteorology, 24(4): 617-622.
null
郑玉蓉, 王旭红, 崔思颖, 等, 2022.基于地基太阳光度计观测的长安区气溶胶光学特性变化及其与颗粒物浓度的关系[J].环境科学, 43(7): 3494-3507.DOI: 10.13227/j.hjkx.202109055.Zheng Y H ,
null
Wang X H, Cui S Y, et al, 2022.Aerosol optical characteristics with ground-based measurements via sun photometer and its relationship with PM particle concentration in Chang'an[J].Environmental Science, 43(7): 3494-3507.DOI: 10. 13227/j.hjkx.202109055 .
Outlines

/

〈 〉