Formation and Evolution Mechanisms of A Severe Haze Event in the Sichuan Basin in Winter 2016

  • Xinbing REN ,
  • Xianyu YANG ,
  • Jun WEN ,
  • Shigong WANG
Expand
  • 1. College of Atmospheric Sciences,Chengdu University of Information Technology / Sichuan Key Laboratory of Plateau Atmosphere and Environment,Chengdu 610225,Sichuan,China
    2. Chengdu Plain Urban Meteorology and Environment Sichuan Provincial Field Scientific Observation and Research Station,Chengdu 610225,Sichuan,China
    3. State Key Laboratory of Atmospheric Boundary Layer Physics and Atmospheric Chemistry (LAPC),Institute of Atmospheric Physics,Chinese Academy of Sciences,Beijing 100029,China
    4. College of Earth and Planetary Sciences,University of Chinese Academy of Sciences,Beijing 100049,China

Received date: 2023-04-16

  Revised date: 2023-10-09

  Online published: 2023-10-09

Abstract

Studying the formation and evolution mechanism of heavy pollution haze events is beneficial to control the regional scale air quality and to formulate the prevention policies of severe haze pollution.Based on the WRF-CMAQ model and actual observation data, a severe haze event which occurred in Chengdu of Sichuan Basin from December 23, 2016 to January 7, 2017 was reproduced.The distribution of temporal and spatial variations of PM2.5 concentration and ventilation coefficient, the physical and chemical processes and the distribution of potential pollution source areas were analyzed to study the formation and evolution mechanism of this severe pollution haze event.Major results were as follows: (1) The environmental conditions of low temperature and low wind speed during the haze event created favorable conditions for the accumulation of pollutants.(2) The northerly airflow in the north of the basin, the southwesterly airflow in the south and the lower ventilation coefficient value (weak turbulent diffusion capability of atmosphere) were the main reasons for the accumulation of pollutants.The PM2.5 concentration in Chengdu reached the peak under the influence of the northeast airflow.The dissipation of pollutants was mainly because of the strengthening of the northerly airflow and the higher ventilation coefficient value (strong turbulent diffusion capability of atmosphere).(3) The positive contribution of the aerosol process and emission sources in this haze event was strengthened.And the increase in PM2.5 was mainly at night (the negative contribution of the advection process and the weak diffusion process) and the magnitude of the increase was greater relative to the decrease, resulting in an overall gradual increase in PM2.5.(4) PSCF and CWT analysis showed that the airflows with high PM2.5 concentration in Chengdu mainly came from its northeast and southwest directions during this haze event, and the potential pollution source areas were generally distributed in a northeast-southwest band.

Cite this article

Xinbing REN , Xianyu YANG , Jun WEN , Shigong WANG . Formation and Evolution Mechanisms of A Severe Haze Event in the Sichuan Basin in Winter 2016[J]. Plateau Meteorology, 2024 , 43(3) : 775 -789 . DOI: 10.7522/j.issn.1000-0534.2023.00082

1 引言

世界主要发达国家和发展中国家的经济发展仍然在很大程度上依赖于煤炭、 石油和天然气等化石能源, 大量化石能源的消耗不可避免会对环境造成一定的破坏, 尤其是在一些发展中国家中(IPCC, 2014)。近年来, 霾事件得到了最为广泛的关注。霾指的是悬浮在大气中的大量微小尘、 烟或盐类粒子使空气混浊, 降低能见度的一种天气现象(Chang et al, 2009Cai et al, 2017)。霾事件通常是一种复合型的空气污染, 往往伴随着强烈的人为排放(Zhang et al, 2010Kong et al, 2015)。在复合型的空气污染中, 空气中存在着大量的一次和二次气态及颗粒态污染物, 这些污染物为发生在颗粒物表面的非均相反应提供前体物, 会改变大气的氧化能力以及对颗粒物的化学组成、 物理和光学性质产生影响, 加速空气污染复合物和霾的形成(Zhu et al, 2011a)。这类颗粒物的化学成分通常包含多种物质, 如硫酸盐、 硝酸盐、 铵盐、 有机物和黑碳气溶胶等(Yang et al, 2005Wang et al, 2006a)。根据颗粒物的空气动力学直径(Dp), 颗粒物通常被分为PM2.5Dp≤2.5 μm)和PM10Dp≤10 μm)。因此, PM2.5和PM10通常分别被称为细颗粒物和粗颗粒物。霾事件的形成主要是由细颗粒物的大量增加引起的(Wang et al, 2006aYang et al, 2020)。除了导致能见度急剧下降进而造成更多的交通事故外, 颗粒物污染还严重恶化了空气质量。此外, 霾事件中的细颗粒物的粒径较小, 富含大量的有毒有害物质(Tie et al, 2009), 其在大气中的停留时间和传输距离更长, 严重影响大气环境质量和人类健康。例如, 细颗粒物可以侵入人体的呼吸道和肺叶, 引起呼吸道疾病、 心血管疾病、 精神健康和其他疾病(Zhang et al, 2014)。此外, 颗粒物的大量增加还将通过其直接和间接的辐射强迫效应影响地球-大气系统的辐射平衡, 进而影响区域和全球气候变化(Ma et al, 20202022)。
随着经济的快速发展, 大气环境的污染问题也越来越突出(Wu et al, 2005Lei et al, 2011)。经过多年的大气污染治理工作, 中国的雾霾污染得到了有效改善(Wang et al, 2017)。然而, 一些城市群在冬季仍有频繁的霾事件发生, 如华北平原的京津冀地区(Wang et al, 2014bZhao et al, 2021)、 长江三角洲(Ding et al, 2016Cao et al, 2018)、 珠江三角洲(Wu et al, 2005Liu et al, 2008)和四川盆地的成渝经济区(Wang et al, 2013Zhao et al, 2018)。这些地区的严重霾事件已有较多的研究和分析, Wu et al(2005, 2007)指出了珠江三角洲近地层高浓度的气溶胶颗粒强烈降低了区域能见度和减少排放对于颗粒物污染的重要性。Wang et al(2014b)基于地面观测、 卫星和激光雷达数据研究了2013年1月中国东部的一次长期严重雾霾事件, 认为静稳天气条件与严重霾事件密切相关, 表现为低风速、 高相对湿度、 强逆温和低混合层高度。在京津冀、 长江三角洲、 珠江三角洲和四川盆地城市群的霾事件研究也表明了气象条件是霾事件发生的重要因素(Liu et al, 2008Ding et al, 2016Zhao et al, 2018)。此外, 在高湿度环境下, SO2二次形成硫酸盐是霾事件中颗粒物浓度大幅增加的主要原因(Sun et al, 2013Wang et al, 2014b)。成都位于四川盆地, 属于成渝经济圈的重点城市, 也是我国西南地区最大的城市之一。戴永立等(2013)的研究表明, 成都污染天气出现的频率是在四个超大城市(北京、 上海、 广州、 成都)中的第一位, 其霾天气年均频率为50.50%。四川盆地的大气污染物消散条件较差, 特别是在偏北风风速较小的冬季, 成都地区的颗粒物浓度常维持在一个较高水平(Wang et al, 2013Chen and Xie, 2013陈源等, 2016刘培川等, 2018)。近年来, 尽管成都地区的空气质量正逐渐好转, 但仍时常发生严重大气污染事件。Zeng and Zhang(2017)分析了2014年冬季春节期间成都地区发生的一次持续灰霾事件, 表明成都地区低风速的环境条件降低了大气对污染物的水平和垂直扩散能力, 且较低的混合层高度和较强的逆温层阻止了污染物的垂直扩散, 导致了污染物的进一步积累。Liao et al(2017)研究了2013年冬季成都的一次重污染事件, 发现四川盆地的复杂特殊地形利于形成局地环流, 白天污染物由城市传输至郊区, 夜间由郊区传输回至城市, 污染物易堆积。李世广等(2013)利用CMAQ 对成渝经济区2012年的PM2.5浓度进行了数值模拟, 发现PM2.5污染带位于四川盆地和成渝经济区南部的交界处, 成都为PM2.5高值区, 且其主要受本地污染源影响。
本文研究了2016年12月23日至2017年1月7日四川盆地成都市的一次重污染霾事件, 期间成都市观测到的最高小时PM2.5浓度达到487 µg·m-3, 最高日均PM2.5浓度为386 µg·m-3, 远超中国环境空气质量标准二级浓度限值(PM2.5日均浓度大于75 µg·m-3及以上), 盆地内多个城市也出现了霾污染, 如眉山市(PM2.5日均最高浓度: 231 µg·m-3)、 自贡市(PM2.5日均最高浓度: 212 µg·m-3)、 达州市(PM2.5日均最高浓度: 257 µg·m-3)、 德阳市(PM2.5日均最高浓度: 256 µg·m-3)和宜宾市(PM2.5日均最高浓度: 287 µg·m-3)等地。此次四川盆地重霾事件污染程度严重且涉及范围广, 有必要深入研究分析。对比分析了此次霾事件中气象观测值及WRF-CMAQ模式模拟值的时间变化, 讨论了污染期间PM2.5浓度和通风系数VH的时空演变, 量化了各个物理化学过程对此次污染过程的相对贡献, 并分析了污染物源区, 探讨了此次霾事件的形成演化机制, 可为进一步开展区域污染治理提供管理决策参考。

2 数据来源与方法介绍

2.1 观测数据

WRF模拟的成都市温江站气象参数, 包括温度(T), 相对湿度(RH), 10 m风速(WS10)与10 m风向(WD10)与实际国家基准气候站成都市温江站观测值进行比较。PM2.5的每小时观测数据来自四川省的8个国控空气质量监测点和成都市环境科学研究院(环科院)的超级站, 详细经纬度信息如表1所示。
表1 监测站点基本信息

Table 1 Basic information of surface environmental observation stations in Sichuan province

站点(城市) 经度/(°E) 纬度/(°N)
金泉两河(成都) 103.97 30.72
三瓦窑(成都) 104.08 30.57
灵岩寺(成都) 103.61 31.03
大石西路(成都) 104.02 30.66
环科院(成都) 104.05 30.56
温江(成都) 103.86 30.75
市政府(宜宾) 104.64 28.76
西小区(德阳) 104.39 31.13
春华路(自贡) 104.77 29.34
市监测站(遂宁) 105.68 30.61

2.2 模型设置

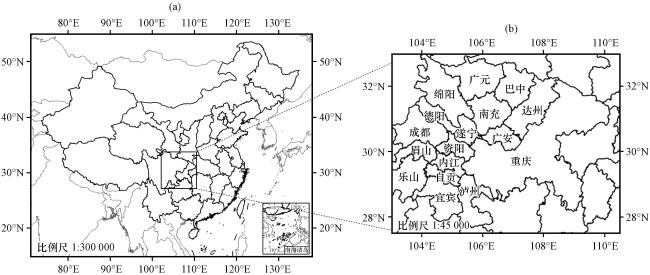
中尺度气象预报模式WRF (Weather Research and Forecasting Model)是由美国国家环境预报中心(NCEP)和美国国家大气研究中心(NCAR)等多个机构联合研发的中尺度天气预报模式。区域多尺度空气质量模型CMAQ (Community Multiscale Air Quality)是美国环保署(USEPA)发展的第3代空气质量模式, 属于三维欧拉大气化学传输模式。本研究利用WRF v3.9.1模拟气象场, CMAQ v5.2.1对成都市PM2.5进行模拟。模拟区域采用三层嵌套, 水平分辨率分别为27 km、 9 km 和3 km, 最外层区域包含东亚地区, 第二层覆盖了中国中部地区, 最外层则主要集中覆盖了四川盆地的主要区域(图1)。本文所涉及的地图底图来源于中华人民共和国自然资源部地图技术审查中心标准地图服务系统下载的审图号为GS(2016)1585的中国地图和审图号为GS(2016)2950的世界地图, 底图无修改。WRF模式的初始条件和边界条件来自NCEP FNL 1.0°×1.0°再分析数据, 垂直气压层数为40层, 并对3 km内的层数进行了加密。WRF-CMAQ模型的参数化方案如表2所示(张颖等, 2016)。人为源排放采用清华大学开发的2016年MEIC排放清单, 空间分辨率为0.25°×0.25°(Zheng et al, 2018)。天然源排放通过MEGAN 2.1计算得到(Guenther et al, 2012)。CMAQ最外层区域的初始场和边界场来自于全球大气化学传输模型CAM-Chem, 内层区域的初始场和边界层来自于外层CMAQ模拟结果。模拟起始时间设置为2016年12月11日08:00(北京时, 下同), 终止时间为2017年1月12日16:00。
图1 WRF-CMAQ模拟嵌套区域(a)和最内层模拟区域(b)

Fig.1 The simulation domains for WRF-CMAQ modeling system (a) and the inner most simulation domain(b)

表2 WRF-CMAQ模式参数化方案设置

Table 2 The parameterization of WRF-CMAQ model

模式方案类型 模式方案选项
微物理方案 Morrison
积云对流方案 Grell
长波辐射方案 RRTM
短波辐射方案 RRTM
边界层物理方案 YSU
陆面过程物理方案 Noah LSM
化学机制 CB05-AERO06

3 结果与讨论

3.1 模型验证

本节详细对比了观测(OBS)和模拟(SIM)的气象参数(温度: T; 相对湿度: RH; 10 m风速: WS10; 10 m风向: WD 10)与污染物浓度(细颗粒物: PM2.5), 见表3。其中, O B S ¯ S I M ¯分别为平均观测值和模拟值。使用的统计指标, 包括平均值, 标准化平均偏差(NMB), 平均分数偏差(MFB), 平均分数误差(MFE), 一致性指数(IOA)和相关系数(R), 如下所示(其中n为样本数量):
O B S ¯ = 1 n × i = 1 n O B S i S I M ¯ = 1 n × i = 1 n S I M i
N M B = 1 n × i = 1 n S I M i - O B S i O B S i × 100 %
M F B = 2 n × i = 1 n S I M i - O B S i S I M i + O B S i × 100 %
M F E = 2 n × i = 1 n | S I M i - O B S i | S I M i + O B S i × 100 %
I O A = 1 - i = 1 n ( S I M i - O B S i ) 2 i = 1 n ( | O B S i - O B S ¯ | + | S I M i - S I M ¯ | ) 2
R = i = 1 n ( | O B S i - O B S ¯ | × | S I M i - S I M ¯ | ) i = 1 n ( O B S i - O B S ¯ ) 2 + i = 1 n ( S I M i - S I M ¯ ) 2
表3 观测值和模拟值之间的统计验证指标与结果

Table 3 Validation of statistical indicators and results between observations and simulations

变量 O B S ¯ S I M ¯ NMB MFB MFE IOA R
T 8.44 9.14 0.36 0.03 0.36 0.72 0.63
RH 70.05 56.69 -0.18 -0.23 0.23 0.44 0.60
WS 10 1.16 2.60 2.10 0.80 0.86 -0.42 0.13
WD 10 169.67 117.95 1.82 -0.13 0.95 0.51 0.19
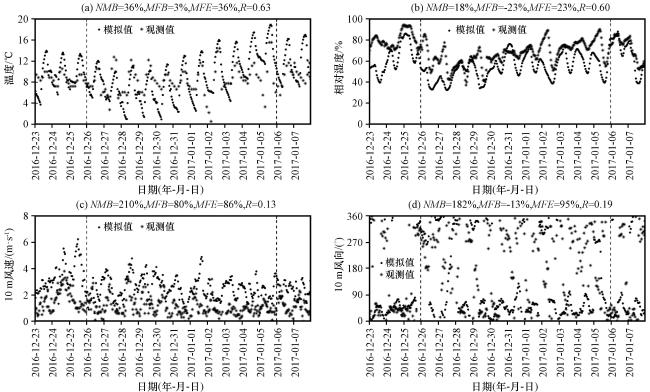
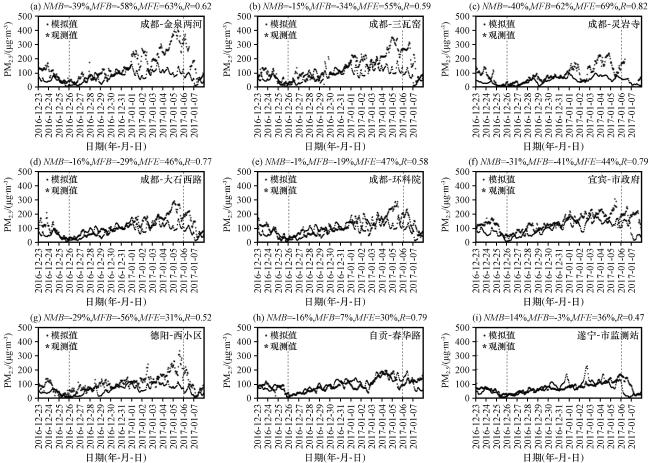
由于研究区域所处位置地形复杂, 数值模式模拟的气象环境特征模拟存在误差, 因此本试验所模拟的温度, 相对湿度, 10 m风速和10 m风向与观测值之间存在一定的差距, 但仍具有参考意义。如图2所示, WRF模式能较好地模拟温度(T)的昼夜变化和日变化, 相关系数R为0.66, 但存在持续高估, NMB为35%, 对于某些时段的峰值模拟效果偏差, 可能是由于参数化方案难以匹配复杂的下垫面地形所导致的。而对于相对湿度(RH), 相关系数R为0.60, 张颖等(2016)对2014 年 5 月初四川盆地内一次空气重污染过程中模拟的2 m相对湿度的相关系数R的均值为0.63, 表明本次试验模拟的相对湿度在可接受的参考范围内。但模拟的相对湿度存在持续低估, NMB为-18%。不同的表层和边界层参数化方案的设置可能会影响模拟的近地层水汽通量, 这些方案的设置可以部分解释观测和模拟之间的相对湿度偏差(Qian et al, 2016)。10 m风场的模拟, 由于盆地地形以及下垫面的复杂性, 模式对风场的模拟还存在较大误差(Miao et al, 2009)。对于10 m风速, WRF较好地模拟出了其变化趋势, 但存在明显高估, 可能是由于表面阻力参数设置中未能完全匹配复杂下垫面地形特征所致。图3为2016年12月23日至2017年1月7日在不同站点观察到的近地面每小时PM2.5浓度与模式模拟结果, CMAQ模式可以合理地再现四川盆地内观测到的PM2.5浓度的演变特征(R=0.50~0.82)。李世广等(2013)曾利用CMAQ对成渝经济区(四川)的PM2.5浓度进行了模拟, 其相关系数R为0.58, 本次试验模拟的精度在可接受的范围之内。然而, 成都PM2.5浓度存在明显低估。前人的模拟研究结果也出现了类似负偏差(Qian et al, 2016)。低估的可能原因有: (1)复杂的下垫面地导致气象条件模拟值的偏差(例如模式低估了RH和高估了WS10, 以及在此期间模拟风向为偏北风, 致使污染物向南消散, 模拟的PM2.5浓度降低); (2)污染源清单的不确定性; (3)某些二次气溶胶生成机制中的非均相反应的不足和缺失(Huang et al, 2014Wang et al, 2014c)。以往对于成都或者四川盆地的PM2.5模拟的研究较少, 因此可参考的标准比较缺乏, 但总体而言, 成都大石西路和环科院站点、 遂宁市监测站站点和自贡的市政府站点的PM2.5模拟性能统计数据均达到Boylan and Russel(2006)提出的模式性能目标(MFB在±30%以内, MFE≤50%), 其他站点对于PM2.5的模拟性能稍差。
图2 成都温江站的温度(a)、 相对湿度(b)、 10 m风速(c)和10 m风向(d)的模拟值(黑点)和观测值(星号)的时间序列

Fig.2 Time series of simulated (dot) and observed (star) values of temperature (a), relative humidity (b), 10 m wind speed (c) and 10 m wind direction (d) at Wenjiang Station, Chengdu

图3 不同站点的PM2.5浓度模拟值(黑点)和观测值(星号)的时间序列及相关统计指标验证结果

Fig.3 Time series of simulated (dot) and observed (star) PM2.5 concentrations at different stations and the results of validation of related statistical indicators

3.2 观测结果分析

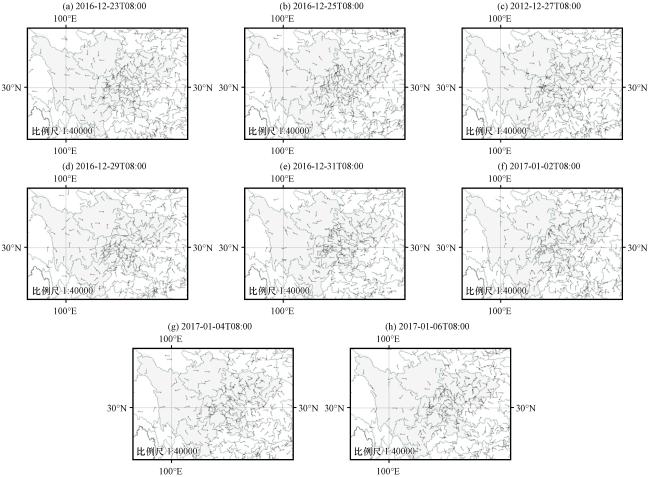
图2所示, 此次研究期间(2016年12月23日至2017年1月7日)的平均温度为8.45 ℃, 由于成都地区地处四川盆地西部, 冬季的日照时间常常较少, 气温也通常较低, 大气层结一般较稳定, 对流活动较弱, 使得污染物能够长时间的停留在近地层, 因此长时间的较低温稳定环境不利于污染物的消散, 会导致气溶胶颗粒物的积累。研究期间平均相对湿度为70.40%, 较高的湿度能使得颗粒物的吸湿增长作用更为显著, 颗粒物直径变大, 使能见度变低, 加重空气污染。其次, 平均10 m风速为1.15 m·s-1, 小于3 m·s-1, 通常在一定的范围内, 风速的大小决定了污染物稀释和扩散程度(Ulas et al, 2006; Jones et al, 2010), 若加之边界层的高度较低, 污染物更难以消散, 从而导致污染物堆积。根据研究时段内成都九个观测站点PM2.5的浓度变化(图3), 将此次持续污染事件分为三个阶段: (1)上一次霾事件的消散阶段(2016年12月23 -25日, 第1阶段); (2)气溶胶积累阶段(2016年12月26日至2017年1月5日, 第2阶段); 气溶胶消散阶段(自2017年1月6日起, 第3阶段)。本文主要关注后两个阶段, 以揭示导致气溶胶颗粒物积累和消散的重要因素。从实际观测地面10 m风场(图4)可以看出, 在第1阶段, 四川盆地主要受偏北风影响。在第2阶段初期(12月26 -29日), 盆地东北部仍主要为偏东北风, 盆地中南部主要为偏西南风; 在第2阶段中期(2016年12月30日至2017年1月5日), 盆地中部偏北的位置出现了偏西气流, 此后逐渐减弱, 而盆地内的风向较为杂乱。最后, 在第3阶段, 盆地内又转为较一致的偏北风。
图4 研究时段期间08:00地面10 m观测风场

Fig.4 The observed 10 m wind on the ground during study period at 08:00

3.3  PM2.5 浓度的时空演变

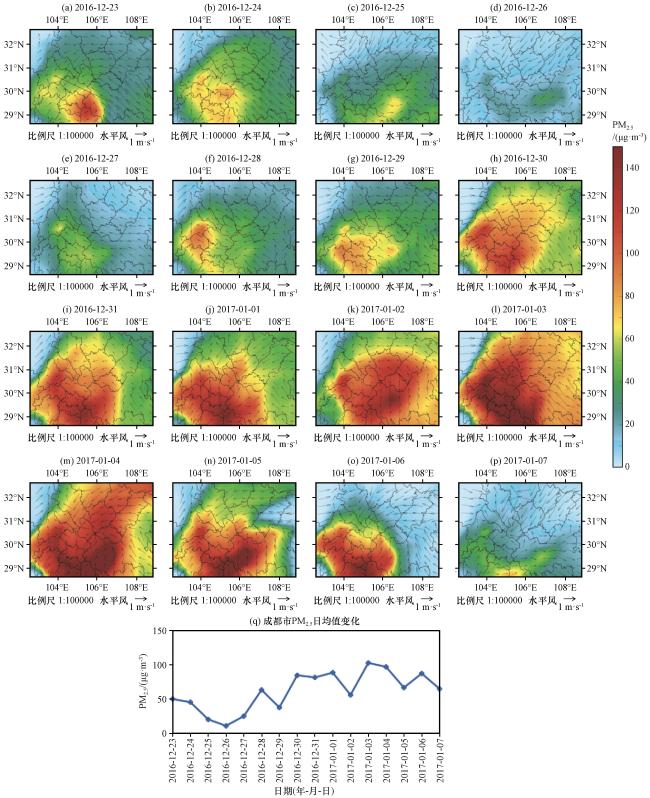
图5为2016年12月23日至2017年1月7日CMAQ模式模拟的PM2.5日平均浓度的空间分布。2016年12月23 -25日为上一次霾事件过程的消散阶段, 因四川区域偏北气流的加强(图4图5)导致四川盆地内气溶胶颗粒物的浓度下降, 12月26日, 盆地内的PM2.5浓度均已降至35 µg·m-3以下, 成都地区的PM2.5浓度已降至11 µg·m-3。此后, 偏北气流减弱, 盆地内部主要为偏东气流(图4图5), 在较统一的偏东气流的作用下这些地区的PM2.5浓度增加尚不明显, PM2.5浓度较低。此后, 盆地中部风向比较统一, 风速较低, 盆地南部主要为偏西南气流, 与盆地北部的偏东气流相遇于盆地内, 呈现出反气旋的特征, 致使盆地内生成的污染物不易消散, 逐渐堆积, 因此盆地中南部的PM2.5浓度首先开始升高。随着盆地中南部南风的增强, 盆地内污染物积聚, 再加上盆地的特殊地形, 使盆地内的颗粒物浓度不断积累增加, 成都地区及四川盆地区域的空气质量恶化。自2017年1月2日起, 盆地东北部的偏东北气流较南风增强致使污染物向南扩散。1月6日起, 在四川盆地主要表现为一致的偏北气流(图4图5), 风速增大, 使得盆地内气溶胶颗粒的积累中断, 盆地内的污染物迅速向南移动且PM2.5的浓度逐步降低, 盆地北部PM2.5浓度已下降到30 µg·m-3, 盆地中心的PM2.5浓度也下降到70 µg·m-3, 四川盆地内的污染物进入消散阶段, 成都地区的PM2.5浓度也随之降低。
图5 2016年12月23日至2017年1月7日期间地表PM2.5的日均模拟浓度(彩色区, 单位: µg· m-3)和日均地面10 m风场(矢量, 单位: m·s-1)的空间分布(a~p)及成都地区PM2.5的日均模拟浓度的时间序列(q)

Fig.5 Spatial distributions of simulated daily surface PM2.5 concentrations (color area, unit: µg·m-3) and wind field in 10 m (vector, unit: m·s-1) (a~p) and time series of simulated daily averaged PM2.5 concentrations over the Chengdu (q) from 23 December 2016 to 7 January 2017

3.4 通风系数VH 的时空演变

大气边界层的高度和大气边界层内的风速反映了边界层内大气湍流扩散的能力。Zhang (2011)将边界层的高度和边界层内平均风速的乘积定义为通风系数VH (单位: m2·s-1), 代表了大气边界层的扩散条件。可用以下公式进行计算:
V H = i = 1 n U i ( Z i ) Δ Z i
式中: n代表边界层内模式的垂直层数; Ui (单位: Zi )代表模式中边界层每一层内的水平风速(单位: m·s-1); ∆Zi 代表模式中边界层内每一层的高度(单位: m)。
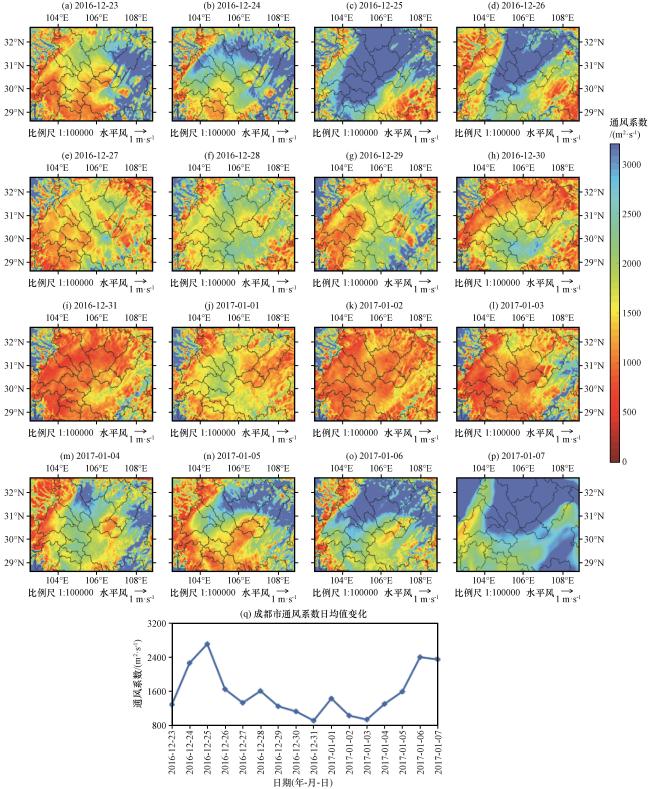
本研究使用上述公式计算了此次霾事件期间各地的VH图6为2016年12月23日至2017年1月7日研究区域的VH 日平均值的空间分布。在第1阶段即对应上一次污染过程的消散阶段, 四川盆地内的VH 普遍增高(包括成都地区), 且VH 值主要在盆地东北-西南向较高, 这与期间的偏东北风有关, 表明期间大气湍流正逐步加强, 以使这些地区的污染物得以迅速消散, 盆地内空气质量改善。自12月25日之后的第2阶段, 即本次霾事件污染物的积累过程, 四川盆地内大部分地方的VH 值逐步减小, 在此期间成都地区的VH 平均值为1291 m2·s-1VH 最小值为916 m2·s-1, 在重污染期间(2016年12月30日至2017年1月5日)四川盆地大部分地方的VH 值普遍小于800 m2·s-1, 表明重污染期间该区域内大气湍流较弱。因此, 污染物不能及时扩散并在该区域内连续积累, 污染物浓度迅速增加, 与本次霾事件期间模拟的PM2.5空间分布的时间变化趋势一致。在第3阶段即本次霾事件污染物的消散阶段, 四川盆地内的VH 值普遍增大, 这与南下的偏北气流有关, 特别是成都地区及其东北方向的V H值迅速增加到2400 m2·s-1以上, 使得污染物可以快速扩散, 区域的空气质量得到改善。
图6 2016年12月23日至2017年1月7日期间通风系数(VH, 单位: m2·s-1)的日均值的空间分布(a~p)及成都市地区通风系数(VH)的日均值的时间序列(q)

Fig.6 Spatial distributions of simulated daily ventilation coefficient (VH, unit: m2·s-1) (a~p) and time series of simulated daily averaged ventilation coefficient (VH) over the Chengdu (q) from 23 December 2016 to 7 January 2017

3.5 污染过程分析

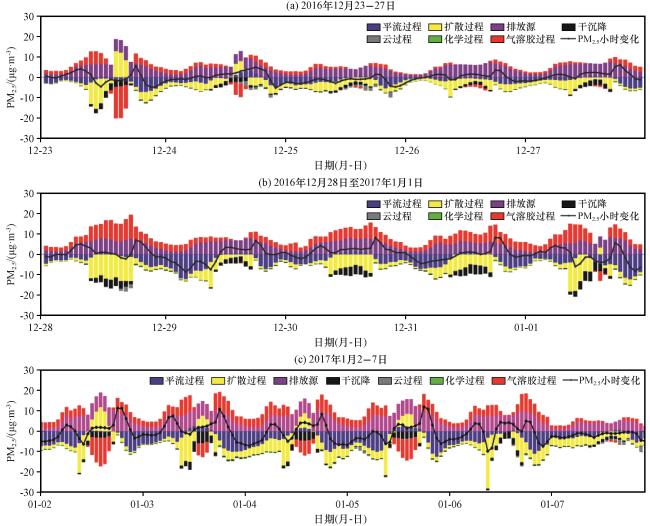
CMAQ中的过程分析模块(IPR)可确定每个物理化学过程对霾事件中PM2.5浓度的相对贡献, 有利于增进四川盆地此次重霾事件形成和演化机制的理解。IPR中共包含了9个过程, 分别是水平平流(HADV), 垂直平流(ZADV), 水平扩散(HDIF), 垂直扩散(VDIF), 排放源(EMIS), 干沉降(DDEP), 气溶胶过程(AERO), 云过程(CLDS)和化学过程(CHEM)。本研究中将水平平流和垂直平流的总和定义为平流过程(TRAN), 水平扩散和垂直扩散的总和定义为扩散过程(DIFF), 分别代表平流和扩散的总效应。图7显示了2016年12月23日至2017年1月7日研究区域每个物理化学过程对PM2.5的贡献和PM2.5的小时变化, 这里PM2.5的小时变化是指当前PM2.5浓度减去上一小时的PM2.5浓度。可以看出, 近地面PM2.5的主要源为EMIS和AERO; 主要汇是TRAN, DIFF, DDEP。在第1阶段(上一次霾事件的消散阶段)中, AERO对PM2.5的正贡献较弱, EMIS对PM2.5的正贡献稳定, 因此PM2.5的源主要为EMIS, 而在PM2.5的汇中DIFF和TRAN对PM2.5的负贡献相对较强, 综合而言, PM2.5有所下降。在第2阶段(气溶胶积累阶段)的初期, AERO对PM2.5的正贡献相比第1阶段已有明显增加, EMIS对PM2.5的正贡献相比第1阶段保持稳定; DIFF和TRAN的负效应比第1阶段有所加强, 但汇的负贡献相对于源的正贡献较弱。此外, PM2.5的增加主要发生在夜间, 夜间的TRAN和DIFF的负效应相比于白天减弱, 这可能是因为夜间边界层高度低, 静风现象明显(图2)所致, 而AERO和EMIS的正效应相比于白天却基本保持不变, 致使PM2.5在夜间迅速增加。白天TRAN和DIFF的负效应增强, 但汇的负贡献仅与源的正贡献大抵相当或稍强, 使得白天的PM2.5增加基本大致稳定在0左右, 而在夜间的PM2.5却有相对较大幅度的增加, 因此在这期间PM2.5持续积累增加。而在污染较重的期间(2017年1月2 -5日), PM2.5的源中, EMIS的正效应相比此前有加强, 表明期间的源排放有一定程度的增加, 而TRAN和DIFF的负效应和第2阶段中积累阶段大致保持不变。同样, PM2.5的增加主要发生在夜间, 白天的PM2.5增加基本为0或有些许减少, 但PM2.5在夜间的增加幅度相比此前更大, 时段更长, 因此PM2.5浓度进一步增加并逐渐达到峰值, 导致污染加重。第3阶段(气溶胶消散阶段)与第1阶段类似。总的来说, 此次霾事件中, AERO和EMIS的正贡献加强, PM2.5的增加主要在夜间(TRAN和DIFF的负贡献减弱), 白天PM2.5增加基本为0或有所减少, 但夜间PM2.5的增加幅度更大, 使得PM2.5总体上逐渐增加, 直到重污染期间, EMIS的正贡献进一步增强, 夜间PM2.5的增加幅度进一步增强, 增加时长也进一步增加, 因此PM2.5浓度逐渐达到峰值。
图7 2016年12月23日至2017年1月7日每个物理化学过程对PM2.5的贡献和PM2.5的小时变化

Fig.7 The hourly PM2.5 changes (current concentration minus the concentration of the previous hour) induced by each physical/chemical process using the IPR analysis method in Chengdu during 23 December 2016 to 7 January 2017

3.6  PSCFCWT分析

潜在源贡献因子法(PSCF)等用于分析空气质量轨迹的统计方法已被用于深入了解潜在源区以及大气颗粒物和气态污染物的主要传输路径(Zachary et al, 2018)。通过计算PSCF值可分析轨迹传输路径, 从而识别污染源区。PSCF值定义为:
P S C F i j = x i j / y i j
式中: yij 是落在ijth 网格单元中的轨迹端点的总数; xij 是在相同网格单元中测得的污染物浓度超过该污染物阈值的轨迹端点的总数(Ashbaugh et al, 1985)。此处污染物为PM2.5, 其浓度阈值设为150 µg· m-3(即达到中度污染以上)。为了消除yij 值较小的单元中的不确定性, PSCF值乘以任意权重函数Wij, 以更好地反映这些单元值中的不确定性(Karaca et al, 2009Polissar et al, 2001Wang et al, 2015Zhu et al, 2011b)。
W i j = 1.0 ( 80 < y i j ) 0.7 ( 25 < y i j 80 ) 0.42 ( 15 < y i j 25 ) 0.17 ( y i j 15 )
PSCF在一定程度上能够反映出网格单元对模拟点PM2.5浓度的贡献大小, 但当网格单元浓度可能略高于或远高于要求的标准阈值时, 一些网格单元可能具有相同的PSCF值, 无法区分中等来源和强来源。因此, 采用浓度轨迹加权法(CWT)(Stohl, 1998Wang et al, 2006bLi et al, 2017)对研究区域内的排放源区域进行地理概述。计算方法如下:
C i j = k k = 1 M τ i j k k = 1 M C k τ i j k
式中: Cij 是第i个单元格中的平均加权浓度; k是轨迹指数; M是轨迹总数; Ck 是轨迹k到达时观测到的浓度; τijk 是轨迹k在第i个单元格中停留的时间(Stohl and Kromp-kolb, 1994Stohl, 1996Xin et al, 2016)。与PSCF方法一样, CWT方法也使用权重函数来消除端点较少的网格单元以减少结果的不确定性。
本文采用基于地理信息系统的软件TrajStat(Wang, 2014a)对受体点进行PSCF和CWT分析, 气象数据来源为美国国家环境预报中心(NCEP)提供的全球资料同化系统资料(GDAS1, https: //www.ready.noaa.gov/gdas1.php)。模拟受点为成都梁家巷站(30.68°N, 104.08°E), 高度设定为500 m, 时间为48 h, 起始时间设定为08:00。PSCF和CWT的网格域范围为27°N -33°N和92°E -106°E, 分辨率为0.5°×0.5°。
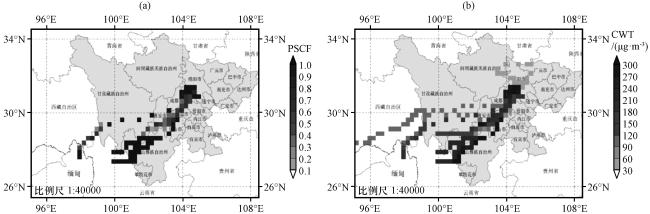
图8为2016年12月23日至2017年1月7日本次霾事件的PSCF(a)和CWT(b)。PSCF网格的颜色越深表示PM2.5轨迹经过的概率越大, 从PSCF图中[图8(a)]可以看出, 较高的PSCF值主要分布在绵阳市, 德阳市, 成都市, 眉山市, 乐山市以及西昌市等地, 且这条PSCF的较大值带大致呈东北-西南向。可以得出, 此次霾事件期间成都市PM2.5的来源主要是在其东北方向和西南方向上, 且来自西南方向的高浓度PM2.5占据对成都市PM2.5贡献的绝大多数, 再次说明此次污染事件中污染物的积累主要是由于盆地内东北风和西南风辐合所导致的, 这与PM2.5的空间分布变化和风场变化相对应。此外, 还可判断出东北-西南区域长距离传输的一次污染物和二次气溶胶前体物对本次霾事件期间成都市的高浓度PM2.5有较大贡献。从CWT图中同样可以得出, CWT网格颜色越深表示网格区域对模拟受点PM2.5浓度的贡献越大, 当其与PM2.5轨迹经过概率越大的地方(即具有较高PSCF值的地方)相重合时, 可以认为是模拟受点的潜在污染区。在成都市东北方向上, 德阳市对模拟受点PM2.5的贡献达240 µg·m-3以上, 成都市本地对模拟受点PM2.5的贡献为90~210 µg·m-3, 在成都市西南方向上, 眉山市对模拟受点PM2.5的贡献为150~240 µg·m-3, 乐山市和西昌市对模拟受点PM2.5的贡献达240 µg·m-3以上。因此, 比较PSCF图和CWT图可知, 两者重合度较高, 潜在的污染源区总体上呈东北-西南向带状分布, 也均是人口较密集、 工业也比较发达的地区。
图8 基于PSCF(a)和CWT(b)的污染期间PM2.5潜在源区分布

Fig.8 Potential source area distribution of PM2.5 during pollution by using the PSCF (a) and CWT (b) analysis

在气溶胶积累阶段(第2阶段)初期阶段结合第3.3节中所谈到的盆地中南部的西南风处于PM2.5潜在源区, 污染物在盆地内部逐渐辐合聚集。除此之外, 由第3.5节可知, 在EMIS和前一阶段相差不大的情况下, AERO正贡献明显增加, 尤其是在日间, 可为风速较小日和夜晚的PM2.5积累造成贡献, 表明西南风携带的污染物对局地气溶胶过程(包括热力过程、 气体向颗粒的质量传输和凝结)的增强作用。

4 结论

本次2016年冬季成都地区及四川盆地霾事件期间, 低温静稳大气环境为颗粒物的积累创造了有利条件, 同时受局地风场对污染物的传输和扩散影响, 总体上不利于污染物的消散, 污染物逐渐堆积, 恶化区域空气质量, 主要结论如下:
(1) 此次研究时段内, 在上一次霾事件的扩散阶段(2016年12月23 -25日), 期间PM2.5浓度的下降主要是因为大气的湍流扩散能力增强以及偏北气流的加强, 污染物得以迅速消散。在气溶胶积累阶段(2016年12月26日至2017年1月5日), 盆地中部在其南部偏西南气流和其北部的偏北气流的辐合作用以及大气的湍流扩散能力弱的条件下PM2.5开始积累, 后在偏东北气流作用下, 盆地东北部的污染物开始向西南方向移动, 成都地区及盆地中南部的PM2.5浓度逐渐达到峰值。在气溶胶扩散阶段(自2017年1月6日起), 受盆地内一致的偏北风和大气的湍流扩散能力增强影响下, PM2.5浓度开始下降, 污染物得以消散。
(2) 此次霾事件中, 气溶胶过程和排放源对PM2.5的正贡献加强, PM2.5的增加主要在夜间(平流过程和扩散过程的负贡献减弱), 白天PM2.5增加基本为0或有所减少, 但夜间PM2.5的增加幅度相对更大, 使得PM2.5总体上逐渐增加。在重污染期间, 排放源的正贡献进一步增强, 夜间PM2.5的增加幅度和时长也进一步增加, 因此PM2.5浓度逐渐达到峰值。
(3) 通过PSCF和CWT方法对污染期间PM2.5的潜在污染源区的分析, 导致成都地区PM2.5浓度较高的气流主要来自其东北和西南方向, 潜在污染源区在总体上呈东北-西南向带状分布, 也均是人口较密集、 工业较发达的地方。
受四川盆地及周围的复杂山地地形所致, 本研究中WRF的气象场模拟结果与观测结果还存在一定的差距, 而这对于污染物的扩散至关重要。因此在接下来的工作中应尽可能地调整复杂地形的物理参数化方案, 并结合卫星和雷达等数据进行同化, 这对于再现霾事件过程中的大气热动力结构和大气扩散条件有着良好的促进作用。其次, 本研究并未探讨本次重霾事件中各排放源对污染的贡献程度, 也并未探讨气象场和排放源对本次重霾事件的贡献程度, 这也是进一步研究的工作重点。

References

null
Ashbaugh L L Malm W C Sadeh W Z1985.A residence time probability analysis of sulfur concentrations at grand Canyon National Park[J].Atmospheric Environment19(8): 1263-1270.DOI: 10.1016/0004-6981(85)90256-2 .
null
Boylan J W Russell A G2006.PM and light extinction model performance metrics, goals, and criteria for three-dimensional air quality models[J].Atmospheric Environment40(26): 4946-4959.DOI: 10.1016/j.atmosenv.2005.09.087 .
null
Cai W Li K Liao H, et al, 2017.Weather conditions conducive to Beijing severe haze more frequent under climate change[J].Nature Climate Change7(4): 257-262.DOI: 10.1038/nclimate3249 .
null
Cao Y Q Zhang W Wang W J2018.Spatial-temporal characteristics of haze and vertical distribution of aerosols over the Yangtze River Delta of China[J].Journal of Environmental Sciences66(4): 12-19, DOI: 10.1016/j.jes.2017.05.039 .
null
Chang D Song Y Liu B2009.Visibility trends in six megacities in China 1973-2007[J].Atmospheric Research94(2): 161-167.DOI: 10.1016/j.atmosres.2009.05.006 .
null
Chen Y Xie S D2013.Long-term trends and characteristics of visibility in two megacities in Southwest China: Chengdu and Chongqing[J].Journal of the Air & Waste Management Association63(9): 1058-1069.DOI: 10.1080/10962247.2013.791348 .
null
Ding A J Huang X Nie W, et al, 2016.Enhanced haze pollution by black carbon in megacities in China[J].Geophysical Research Letters43(6): 2873-2879, DOI: 10.1002/2016gl067745 .
null
Huang X Song Y Zhao C, et al, 2014.Pathways of sulfate enhancement by natural and anthropogenic mineral aerosols in China[J].Journal of Geophysical Research: Atmospheres119(14): 14165-14179.DOI: 10.1002/2014JD022301 .
null
Guenther A B Jiang X Heald C L, et al, 2012.The model of emissions of gases and aerosols from nature version 2.1 (MEGAN2.1): an extended and updated framework for modeling biogenic emissions[J].Geoscientific Model Development5(6): 1471-1492.DOI: 10.5194/gmd-5-1471-2012 .
null
IPCC, 2014.Climate Change 2014.Synthesis Report.Contribution of Working Groups I, II and III to the Fifth Assessment Report of the Intergovernmental Panel on Climate Change[R].IPCC, Geneva, Switzerland, 151.
null
Jones A M Harrison R M Baker J, et al, 2010.The wind speed dependence of the concentrations of airborne particulate matter and NOX [J].Atmospheric Environment44(13): 1682-1690.DOI: 10.1016/j.atmosenv.2010.01.007 .
null
Karaca F Anil I Alagha O2009.Long-range potential source contributions of episodic aerosol events to PM10 profile of a megacity[J].Atmospheric Environment43 (36): 5713-5722.DOI: 10. 1016/j.atmosenv.2009.08.005 .
null
Kong S F Li L Li X X, et al, 2015.The impacts of firework burning at the Chinese Spring Festival on air quality: insights of tracers, source evolution and aging processes[J].Atmospheric Chemistry and Physics15(4): 2167-2184.DOI: 10.5194/acp-15-2167-2015 .
null
Lei Y Zhang Q He K B, et al, 2011.Primary anthropogenic aerosol emission trends for China, 1990-2005[J].Atmospheric Chemistry and Physics11(3): 931-954.DOI: 10.5194/acp-11-931-2011 .
null
Li D P Liu J G Zhang J S, et al, 2017.Identification of long-range transport pathways and potential sources of PM2.5 and PM10 in Beijing from 2014 to 2015[J].Journal of Environmental Sciences, 56: 214-229.DOI: 10.1016/j.jes.2016.06.035 .
null
Liao T Wang S Ai J, et al, 2017.Heavy pollution episodes, transport pathways and potential sources of PM2.5 during the winter of 2013 in Chengdu (China)[J].Science of the Total Environment584-585: 1056.DOI: 10.1016/j.scitotenv.2017.01.160 .
null
Liu S Hu M Slanina S, et al, 2008.Size distribution and source analysis of ionic compositions of aerosols in polluted periods at Xinken in Pearl River Delta (PRD) of China[J].Atmospheric Environment42(25): 6284-6295, DOI: 10.1016/j.atmosenv.2007.12.035 .
null
Ma Y J Ye J H Xin J Y, et al, 2020.The stove, dome, and umbrella effects of atmospheric aerosol on the development of the planetary boundary layer in hazy regions[J].Geophysical Research Letters47(13): e2020GL087373.DOI: 10.1029/2020GL087373 .
null
Ma Y J Xin J Y Wang Z F, et al, 2022.How do aerosols above the residual layer affect the planetary boundary layer height?[J] Science of the Total Environment, 814: 151953, DOI: 10.1016/j.scitotenv.2021.151953 .
null
Miao S G Chen F LeMone M A, et al, 2009.An observational and modeling study of characteristics of urban heat island and boundary layer structures in Beijing[J].Journal of Applied Meteorology and Climatology48(3): 484-501.DOI: 10.1175/2008JAMC1909.1 .
null
Polissar A V Hopke P K Harrwas J M2001.Source regions for atmospheric aerosol measured at Barrow, Alaska[J].Environmental Science & Technology35 (21): 4214-4226.DOI: 10.1021/es0107529 .
null
Qian Y Yan H P Berg L K, et al, 2016.Assessing impacts of PBL and surface layer schemes in simulating the surface-atmosphere interactions and precipitation over the tropical ocean using observations from AMIE/DYNAMO[J].Journal of Climate29(22): 8191-8210.DOI: 10.1175/JCLI-D-16-0040.1 .
null
Stohl A Kromp-kolb H1994.Origin of ozone in Vienna and surroundings, Austria[J].Atmospheric Environment28 (7): 1255-1266.DOI: 10.1016/1352-2310(94)90272-0 .
null
Stohl A1996.Trajectory statistics-a new method to establish source-receptor relationships of air pollutants and its application to the transport of particulate sulfate in Europe[J].Atmospheric Environment30(4): 579-587.DOI: 10.1016/1352-2310(95)00314-2 .
null
Stohl A1998.Computation, accuracy and applications of trajectories: a review and bibliography[J].Atmospheric Environment32(6): 947-966.DOI: 10.1016/S1352-2310(97)00457-3 .
null
Sun Y L Wang Z F Fu P Q, et al, 2013: The impact of relative humidity on aerosol composition and evolution processes during wintertime in Beijing, China[J].Atmospheric Environment, 77: 927-934, DOI: 10.1016/j.atmosenv.2013.06.019 .
null
Tie X X Wu D Brasseur G2009.Lung cancer mortality and exposure to atmospheric aerosol particles in Guangzhou, China[J].Atmospheric Environment43(14): 2375-2377, DOI: 10.1016/j.atmosenv.2009.01.036 .
null
Ula? ? M Tayan? M Yenigün O, et al, 2006.Analysis of major photochemical pollutants with meteorological factors for high ozone days in Istanbul, Turkey[J].Water, Air, and Soil Pollution, 175: 335-359.DOI: 10.1007/s11270-006-9142-x .
null
Wang Q Y Cao J J Shen Z X, et al, 2013.Chemical characteristics of PM2.5 during dust storms and air pollution events in Chengdu, China[J].Particuology11(1): 70-77.DOI: 10.1016/j.partic.2012.08.001 .
null
Wang Y Zhuang G S Zhang X Y, et al, 2006a.The ion chemistry, seasonal cycle, and sources of PM2.5 and TSP aerosol in Shanghai[J].Atmospheric Environment40(16): 2935-2952.DOI: 10. 1016/j.atmosenv.2005.12.051 .
null
Wang Y Q Zhang X Y Arimoto R2006b.The contribution from distant dust sources to the atmospheric particulate matter loadings at Xi’an, China during spring[J].Science of the Total Environment368(2-3): 875-883.DOI: 10.1016/j.scitotenv.2006. 03. 040 .
null
Wang Y Q2014a.MeteoInfo: GIS software for meteorological data visualization and analysis[J].Meteorological Applications21(2): 360-368.DOI: 10.1002/met.1345 .
null
Wang Y S Yao L Wang L L, et al, 2014b.Mechanism for the formation of the January 2013 heavy haze pollution episode over central and eastern China[J].Science China Earth Sciences57(1): 14-25, DOI: 10.1007/s11430-013-4773-4 .
null
Wang Y X Zhang Q Q Jiang J K, et al, 2014c.Enhanced sulfate formation during China’s severe winter haze episode in January 2013 missing from current models[J].Journal of Geophysical Research: Atmospheres119(17): 10425-410440.DOI: 10.1002/2013JD021426 .
null
Wang L L Liu Z R Sun Y, et al, 2015.Long-range transport and regional sources of PM2.5 in Beijing based on long-term observations from 2005 to 2010[J].Atmospheric Research, 157: 37-48.DOI: 10.1016/j.atmosres.2014.12.003 .
null
Wang J D Zhao B Wang S X, et al, 2017.Particulate matter pollution over China and the effects of control policies[J].Science of the Total Environment584-585: 426-447.DOI: 10.1016/j.scitotenv.2017.01.027 .
null
Wu D Tie X X Li C C, et al, 2005.An extremely low visibility event over the Guangzhou region: A case study[J].Atmospheric Environment39(35): 6568-6577.DOI: 10.1016/j.atmosenv. 2005.07.061 .
null
Wu D Bi X Y Deng X J, et al, 2007.Effect of atmospheric haze on the deterioration of visibility over the Pearl River Delta[J].Journal of Meteorological Research21(2): 215-223.DOI: CNKI: SUN: QXXW.0.2007-02-008 .
null
Xin Y G Wang G C Chen L2016.Identification of long-range transport pathways and potential sources of PM10 in Tibetan plateau uplift area: case study of Xining, China in 2014[J].Aerosol Air Quality Research16(4): 1044-1054.DOI: 10.4209/aaqr. 2015.05.0296 .
null
Yang F He K Ye B, et al, 2005.One-year record of organic and elemental carbon in fine particles in downtown Beijing and Shanghai[J].Atmospheric Chemistry and Physics5(6): 1449-1457.DOI: 10.5194/acp-5-1449-2005 .
null
Yang Y J Zheng Z F Yim S Y L, et al, 2020.PM2.5 Pollution modulates wintertime Urban-Heat-Island intensity in the Beijing-Tianjin-Hebei Megalopolis, China[J].Geophysical Research Letters47(1): e2019GL084288, DOI: 10.1029/2019gl084288 .
null
Zachary M Yin L Zacharia M2018.Application of PSCF and CWT to identify potential sources of aerosol optical depth in ICIPE Mbita[J].Open Access Library Journal5(4): 1-12.DOI: 10.4236/oalib.1104487 .
null
Zeng S L Zhang Y2017.The effect of meteorological elements on continuing heavy air pollution: a case study in the Chengdu Area during the 2014 Spring Festival[J].Atmosphere8(4): 71.DOI: 10.3390/atmos8040071 .
null
Zhang B2011.A simulation study on the structure of the urban boundary layer and the diffusion of SO2 pollutants over Shenyang[D].Peking University, Beijing, China, pp.92-97.
null
Zhang M Wang X M Chen J M, et al, 2010.Physical characterization of aerosol particles during the Chinese New Year’s firework events[J].Atmospheric Environment44(39): 5191-5198.DOI: 10.1016/j.atmosenv.2010.08.048 .
null
Zhang Z L Wang J Chen L H, et al, 2014.Impact of haze and air pollution-related hazards on hospital admissions in Guangzhou, China[J].Environmental Science & Pollution Research21(6): 4236-4244, DOI: 10.1007/s11356-013-2374-6 .
null
Zhao D D Xin J Y Gong C S, et al, 2021.The impact threshold of the aerosol radiative forcing on the boundary layer structure in the pollution region[J].Atmospheric Chemistry and Physics21(7): 5739-5753, DOI: 10.5194/acp-21-5739-2021 .
null
Zhao S P Yu Y Yin D Y, et al, 2018.Spatial patterns and temporal variations of six criteria air pollutants during 2015 to 2017 in the city clusters of Sichuan Basin, China[J].Science of the Total Environment, 624: 540-557, DOI: 10.1016/j.scitotenv.2017. 12.172 .
null
Zheng B Tong D Li M, et al, 2018.Trends in China's anthropogenic emissions since 2010 as the consequence of clean air actions[J] Atmospheric Chemistry and Physics18(19): 14095-14111.DOI: 10.5194/acp-18-14095-2018 .
null
Zhu T Shang J Zhao D F2011a.The roles of heterogeneous chemical processes in the formation of an air pollution complex and gray haze[J].Science China Chemistry, 54: 145-153.DOI: 10. 1007/s11426-010-4181-y .
null
Zhu L Huang X Shi H, et al, 2011b.Transport pathways and potential sources of PM10 in Beijing[J].Atmospheric Environment45 (3): 594-604.DOI: 10.1016/j.atmosenv.2010.10.040 .
null
陈源, 谢绍东, 罗彬, 2016.成都市大气细颗粒物组成和污染特征分析(2012-2013年)[J].环境科学学报36(3): 1021-1031.DOI: 10.13671/j.hjkxxb.2015.0501.Chen Y
null
Xie S D Luo B2016.Composition and pollution characteristics of fine particles in Chengdu from 2012 to 2013[J].Acta Scientiae Circumstantiae36(3): 1021-1031.DOI: 10.13671/j.hjkxxb. 2015.0501 .
null
戴永立, 陶俊, 林泽健, 等, 2013.2006-2009年我国超大城市霾天气特征及影响因子分析[J].环境科学34(8): 2925-2932.DOI: CNKI: SUN: HJKZ.0.2013-08-000.Dai Y L
null
Tao J Lin Z J, et al, 2013.Characteristics of haze and its impact factors in four megacities in China during 2006-2009[J].Environmental Science34(8): 2925-2932.DOI: CNKI: SUN: HJKZ.0.2013-08-000 .
null
李世广, 蒋厦, 佟洪金, 等, 2013.基于空气质量模型CMAQ的成渝经济区(四川)PM2.5浓度数值模拟研究[J].四川环境32(): 109-113.
null
Li S G Jiang X Dong H J, et al, 2013.Study on the numerical simulation of PM2.5 in Chengdu-Chongqing economic zone based on air quality model system CMAQ[J].Sichuan Environment32(): 109-113.
null
刘培川, 罗彬, 张巍, 等, 2018.基于WRF模式的成都地区边界层污染气象特征研究[J].四川环境37(3): 48-55.DOI: 10. 3969/j.issn.1001-3644.2018.03.010.Liu P C
null
Luo B Zhang W, et al, 2018.Research on pollution meteorological characteristics of boundary layer in Chengdu area based on WRF model[J].Sichuan Environment37(3): 48-55.DOI: 10.3969/j.issn. 1001-3644.2018.03.010 .
null
张颖, 刘志红, 吕晓彤, 等, 2016.四川盆地一次污染过程的WRF模式参数化方案最优配置[J].环境科学学报36(8): 28192826.DOI: 10.13671/j.hjkxxb.2016.0009.Zhang Y
null
Liu Z H X T, et al, 2016.Optimal configuration of parameterized schemes in WRF model during a pollution episode in Sichuan Basin[J].Acta Scientiae Circumstantiae36(8): 28192826.DOI: 10.13671/j.hjkxxb.2016.0009 .
Outlines

/