An EOF-Based Study of Precipitation Characteristics and Their Responses to Different Configurations of Summer Monsoon in the East Asian Monsoon Region from 1951 to 2020

  • Zhanghuai MA ,
  • Yibo WANG ,
  • Zeyong GAO
Expand
  • 1. College of Earth and Environment Science,Lanzhou University,Lanzhou 730000,Gansu,China
    2. State Key Laboratory of Frozen Soil Engineering,Northwest Institute of Eco-Environment and Resources,Chinese Academy of Sciences,Lanzhou 730000,Gansu,China

Received date: 2023-09-21

  Revised date: 2023-12-07

  Online published: 2023-12-07

Abstract

Summer precipitation in the East Asian monsoon region is significantly affected by monsoon variations.Different monsoon configurations form distinct precipitation patterns in the East Asian monsoon region by affecting regional water vapor transport.Further, the phase changes in precipitation patterns are prone to the occurrence of abnormal precipitation events, which in turn induce droughts and floods.Based on the EOF analysis, the GPCC precipitation, NCEP/NCAR reanalysis data and different monsoon indices were used to study the spatial and temporal distribution of summer precipitation in the East Asian monsoon region.The effects of four different configurations of summer monsoon on summer precipitation patterns in the East Asian monsoon region were further investigated by combining correlation analysis and water vapor flux analysis.The results show that: (1) Precipitation in the East Asian monsoon region experienced a decrease followed by an increase from 1951 to 2020.The increase in precipitation anomalies after 2010, as well as the rapid fluctuations in precipitation series, indicate a decline in regional climate stability.The EOF successfully presents the distribution of summer precipitation over the East Asian monsoon region.It mainly exhibits as the three-pole structure of north-south "-, +, -", followed by the dipolar-type structure with north-south reversed-phase variations.Precipitation anomalies occur in the phase transition of precipitation structure, mainly tripolar type followed by dipole type.(2) The combined influence of the East Asian, South Asian, West Pacific, and westerly circulation monsoon systems results in the summer precipitation anomaly in the East Asian monsoon region.The monsoon configurations leading to anomalous increase and decrease in precipitation are Configuration 1 (WNPMI strong, EASMI and AZCI weak) and Configuration 2 (AZCI strong, EASMI and SASMI weak) respectively.(3) At Configuration 1, the subtropical high is located in the southwest, the westerly trough appears at 40°N, and the southern monsoon is strong.These combine to form precipitation in the central part of the monsoon region through shear lines as well as uplift, leading to an increase in anomalous precipitation.In Configuration 2, the westerlies are strong and the southern water vapor dynamics are too weak to penetrate deep into the continent, resulting in an anomalous decrease in precipitation.The results of this study provide a theoretical framework for investigating the mechanisms behind precipitation anomalies in the East Asian monsoon region in the context of climate change.They also provide critical scientific references for managing the region's extreme precipitation occurrences, as well as preventing and controlling floods and droughts.

Cite this article

Zhanghuai MA , Yibo WANG , Zeyong GAO . An EOF-Based Study of Precipitation Characteristics and Their Responses to Different Configurations of Summer Monsoon in the East Asian Monsoon Region from 1951 to 2020[J]. Plateau Meteorology, 2024 , 43(4) : 855 -867 . DOI: 10.7522/j.issn.1000-0534.2023.00098

1 引言

降水是地球气候系统水循环的关键组成部分, 在连接陆地、 大气和海洋过程中发挥着核心作用。降水特征的研究对于理解季风环流及其与水文循环其他组成部分的关系至关重要(Li et al, 2014; 何静等, 2021)。在气候变化背景下, 全球大气水文循环发生了不同程度的变化, 极端降水作为一个重要指标, 其变化所带来的社会和经济损失受到了水文气候研究者、 管理部门及广大公众的极大关注(Zhang and Zhou, 2019)。政府间气候变化专门委员会(IPCC)研究报告称, 自20世纪50年代以来, 异常降水事件的数量、 范围正在不断增加(Hartmann et al, 2013; Seneviratne, 2012; Trenberth et al, 2007)。季风环流系统与夏季降水变化关系密切, 季风降水影响着全球60%以上人口的生产生活, 明确季风环流对季风区降水时空分布的影响, 对科学应对旱涝灾害, 防灾减灾具有重要意义(Cai et al, 2010; Huang et al, 2003; 曹博文等, 2023)。其中, 东亚季风区由于邻近海洋, 水汽输送和季风环流较强, 是受极端降水影响最大的区域之一。
东亚季风区存在显著影响降水的区域大气环流系统, 并主要由东亚季风、 南亚季风和西风带三个子系统组成(Ha et al, 2017; Hsu et al, 2014; Lee et al, 2014; Qu et al, 2016; Sampe and Xie, 2010)。在水汽输送方面, 人们普遍认为东亚夏季降水有四条主要的水汽输送途径, 包括孟加拉湾、 南海、 北太平洋西部和欧亚大陆。由于位于欧亚大陆和太平洋之间, 存在巨大的热力差异, 并受到青藏高原的强烈影响, 跨越多个气候带的东亚季风区降水在空间和时间上极为复杂(Wang et al, 2008)。已有学者针对东亚季风区内某个或某两个子系统对降水的影响展开研究, 任菊章等(2021)研究了南亚季风与东亚季风对中国南方降水的影响, 结果发现季风强年南支气流增强, 导致长江流域降水减少; 桓玉等(2018)通过季风交界面指数证明了东亚季风与南亚季风的强弱情况, 解释了我国南方降水异常原因; 陈海山和陈健康(2017)通过两类东亚夏季风指数描述了我国夏季降水分布类型; Shi et al(2020)通过拉格朗日模型识别了东亚季风不同阶段的水汽来源。然而, 关于东亚夏季风子系统之间的联系和独立性的许多特征并没有很好地阐明。目前研究表明子系统之间可能通过水汽输送、 低频波传播以及能量交换等相互作用(Kripalani et al, 2010; Tao et al, 2016; Wu et al, 2012; 顾元华等, 2023), 这个关系的研究是目前气候变化和水文循环之间耦合关系研究的关键科学问题。
EOF已广泛用于大气、 海洋和气候研究(杜梦莹等, 2022; 陈子凡等, 2022; 晏红明等, 2023)。EOF分析的本质是识别和提取数据, 按方差表示顺序排列的时空模式。由于少数主要模式通常占总方差的大部分, 因此EOF分析使人们能够挑选出占主导地位的、 有解释含义的模态, 同时大大减少了数据空间(Lian and Chen, 2012)。目前研究主要集中在东亚季风和南亚季风的相互作用以及对我国南方降水的影响, 然而西风以及西太平洋季风对东亚季风区降水也有难以忽视的重要影响。研究东亚季风区降水对不同季风配置的响应有助于对季风区降水复杂机制的理解, 并能更全面地分析揭示东亚夏季风系统的环流特征。因此, 本文基于EOF分析了1951 -2020年东亚季风区降水时空格局, 识别出东亚季风区异常降水的空间模态, 并进一步研究了降水对不同季风配置的响应情况, 为季风区气候变化以及降水预测提供理论支持。

2 数据来源与方法介绍

2.1 数据来源

本研究使用的资料来源于德国气象局GPCC 1951 -2020年夏季(6月、 7月和8月)降水资料(Schneider et al, 2022), 水平空间分辨率为0.5°×0.5°, 为更好地反映降水本身的波动特征, 在进行进一步分析前, 对降水序列进行了去趋势化处理。大气资料为NCEP/NCAR提供的再分析月值数据集, 包括u, v风场, 对外长波辐射、 比湿、 位势高度等, 数据可在(https: //www.esrl.noaa.gov/psd/data/gridded/data.ncep.reanalysis.html)下载。文中所用地图是基于中华人民共和国自然资源部标准地图服务网站下载的审图号为GS(2020)4619的中国地图制作, 底图无修改。

2.2 季风指数

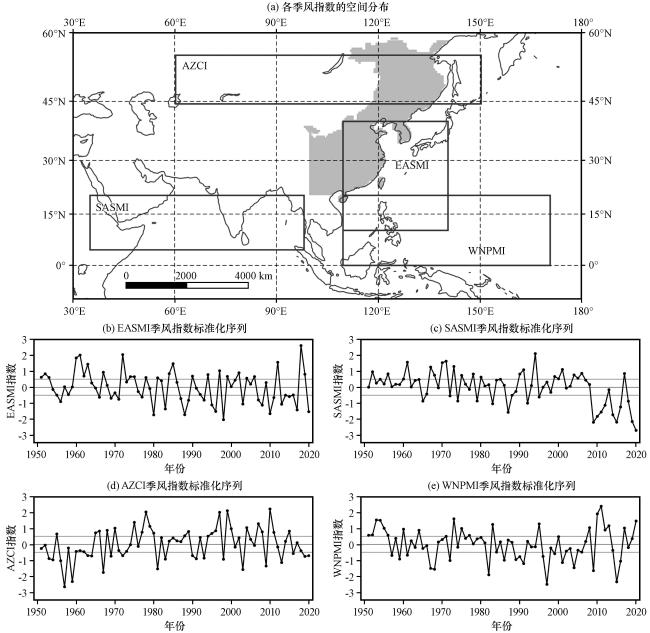
本文采用了4个季风指数, 分别是东亚季风指数(EASMI)、 南亚季风指数(SASMI)、 表征西风的亚洲纬向环流指数(AZCI)和西太平洋季风(WNPMI)。其中, 东亚季风指数和南亚季风指数分别是用东亚季风区(10°N -40°N, 110°E -140°E)和南亚季风区(2.5°N -20°N, 35°E -70°E)内的标准化风场季节变率定义的夏季东亚季风指数和南亚季风指数(Li and Zeng, 2003; 李建平和曾庆存, 2005), 对其6、 7和8月季风指数求平均作为EASMI和SASMI。AZCI数据来自中国国家气候中心(http: //cmdp.ncc-cma.net/cn/index.htm)。WNPMI是西太平洋季风区(0° -20°N, 110°E -170°E)所有格点上标准化后的东南风与标准化后的向外长波辐射之差的和, 能够有效反映热带海洋季风的强弱以及西太平洋副热带高压的移动情况。

2.3 水汽通量的计算

垂直积分的水汽通量Q可表示为(Trenberth, 1991):
Q u = 1 g ∫ P s P t q u d P a
Q v = 1 g ∫ P s P t q v d P a
式中: Q u和Q v分别为Q的纬向分量和经向分量; g=10 m·s-2, 为重力加速度; q为比湿(单位: g·kg-1); P t为气柱顶部压力(单位: hPa), 取300 hPa; P s为地面压力(单位: hPa); u和v分别为纬向风和经向风(单位: m·s-1); P a为气压(单位: hPa)。

3 结果与分析

3.1 东亚季风区降水时空分布

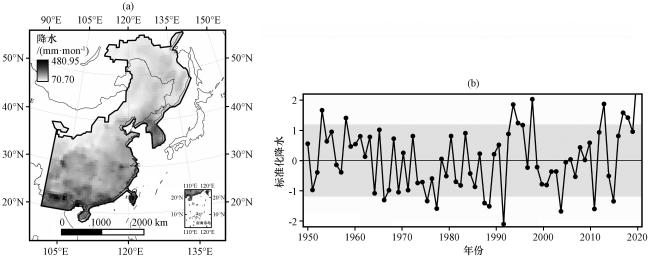
根据Wang et al(2012), 本文将东亚季风区定义为夏季和冬季降水之差超过2.0 mm·d-1, 且夏季降水超过年总降水量55%的地区。其中, 夏天指的是5 -9月, 冬天为11月到次年3月。基于 GPCC的1951 -2020年气候降水数据, 对东亚陆地季风区进行了定义, 20°N和100°E将南亚与东亚季风区分开(Kitoh et al, 2013), 结果如图1所示, 东亚季风区夏季(6月、 7月和8月)平均降水为148.90 mm·mon-1, 空间分布南北差异较大, 主要呈现为南多北少格局, 200 mm·mon-1以上的降水主要分布在南部沿海地区、 朝鲜半岛地区, 此外, 在30°N附近有降水中心分布。从时间上分析, 1951 -2020年夏季标准化降水年际波动较大, 降水量最大值和最小值分别出现在2020年(223.18 mm·mon-1)和1992年(132.71 mm·mon-1)。结合M-K趋势分析发现, 1951 -1992年降水显著降低, 而1992 -2020年降水显著上升, 增长速率约为6 mm·mon-1·(10a)-1, 这与先前的研究相符(陈海山和陈健康, 2017; 陈金明等, 2016)。
图1 1951 -2020年东亚季风区夏季平均月降水分布(a, 阴影区, 单位: mm·mon-1)及标准化降水序列(b)

黑框内为东亚季风区范围

Fig.1 Distribution of summer mean monthly precipitation (a, the shaded, unit: mm·mon-1) and its standardized series (b) in the East Asian monsoon region from 1951 to 2020.The black box shows the range of the East Asian monsoon region

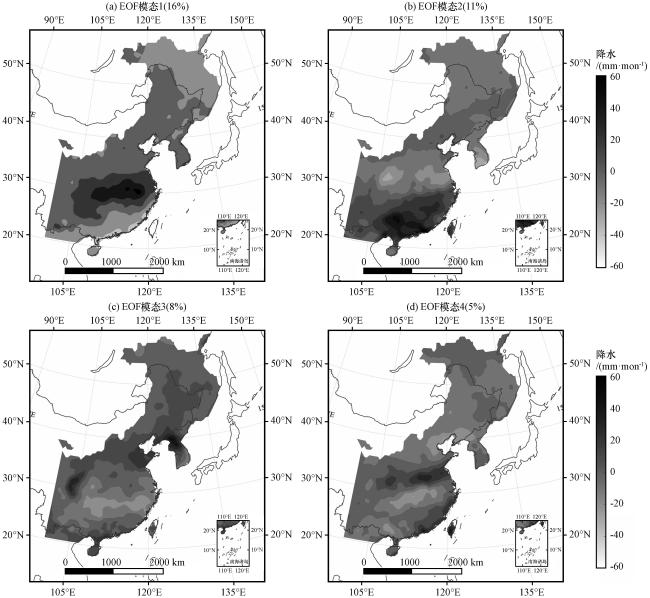
进一步对东亚季风区1951 -2020年夏季降水场进行EOF分析, 降水前四个EOF模态的空间分布特征如图2所示, 其中, 各模态的解释方差分别为16%、 11%、 8%和5%, 累计方差贡献约40%。结果显示(图2), 模态1特征向量的方差贡献率远高于其他模态的方差贡献率, 是东亚季风区主要的空间分布类型, 主要表现出南北向“-、 +、 -”的三极型分布; 第2模态表现出以30°N长江为界, 南北方降水反相变化的偶极型特征; 第3、 4模态表现为和第1、 2模态结构类似, 分别呈现出相位相反的三极型和偶极型分布, 但在40°N以北未展现出明显的分界特征, 这与学者对我国东部夏季降水模态相符合(丁一汇等, 2013; 黄荣辉等, 2011; 杨涵洧等, 2021)。从以上结果可以得出, 东亚季风区中南部区域减少异常在空间上主要表现为离散度不一的三极型和偶极型分布, 在季风区东北区域则未表现出显著的变化中心。其中, 三极型分布的方差贡献为24%, 偶极型分布的方差贡献为16%。
图2 1951 -2020年东亚季风区夏季降水EOF模态

(a)模态1, (b)模态2, (c)模态3, (d)模态4

Fig.2 The EOF patterns of summer precipitation in the East Asia monsoon region from 1951 to 2020.In Fig.2, (a)~(d) indicates the Pattern 1~4, respectively

3.2 降水异常年份及其空间分布

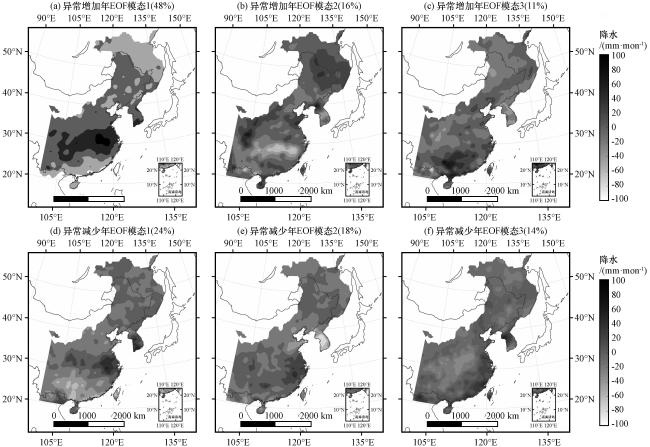
降水时空异常改变是气候异常的直接反映, 将图1降水标准序列大于1.2和小于-1.2的年份分别识别为降水异常增加年和异常减少年, 结果如表1。异常增加年主要集中在20世纪50年代、 90年代和21世纪10年代, 而异常减少年分布较为离散, 主要出现在20世纪70年代、 80年代和21世纪10年代, 可以看出2010年后降水异常的发生频率上升, 降水波动剧烈, 间接反映了气候稳定性的下降。进一步对异常年降水场进行EOF分析, 图3(a)~(c)表示异常增加年降水前三个EOF模态的空间分布特征, 其中, 各模态的解释方差分别为48%、 16%和11%, 累计方差贡献约75%。如图3所示, 模态1表现为和图2(a)相似的南北向“-、 +、 -”的三极型分布, 并在安徽南部一带出现强降水中心; 模态2和图2(c)类似, 为相位相反的三极型分布, 并在四川盆地以及东北部区域降水显著增加; 模态3和图2(b)类似, 表现为东南-西北方向“+、 -”的偶极型结构, 但分布更加离散, 强降水主要出现在中国南部的两广地区以及贵州、 湖南等地。图3(d)~(f)表示异常减少年降水前三个EOF模态的空间分布特征, 其中, 各模态的解释方差分别为24%、 18%和14%, 累计方差贡献约56%。如图所示, 模态1同样表现出南北向“-、 +、 -”的三极型分布, 然而降水中心主要集中在江浙沿海, 且在云南、 广西地区出现明显的降水减少; 模态2中, 整个季风区除江浙沿海以外降水普遍偏低, 且在朝鲜半岛出现明显低值中心, 未展现出明显的极型分布; 模态3图2(b)类似, 不同的是其偶极型分界线呈东南-西北方向, 表现为东南-西北方向“+、 -”的结构, 中部地区降水减少。结合结果与分析第一部分的降水时空分布可得, 东亚季风区夏季降水异常主要发生在三极型降水结构的相位转换上, 在异常增加年和异常减少年分别贡献了64%和24%的方差变化。此外, 偶极型的相位转换是除三极型以外的主要解释模态, 在异常增加年和异常减少年分别贡献了11%和14%的方差变化。
表1 降水异常年

Table 1 Abnormal precipitation years

类型 年份
异常增加年 1954, 1959, 1994, 1995, 1998, 2013, 2017, 2018, 2020
异常减少年 1967, 1976, 1978, 1988, 1989, 1992, 2004, 2011, 2015
图3 异常增加年(a~c)和异常减少年(d~f)降水EOF模态

(a)异常增加年模态1, (b) 异常增加年模态2, (c) 异常增加年模态3, (d) 异常减少年模态1, (e) 异常减少年模态2, (f) 异常减少年模态3

Fig.3 The EOF patterns of precipitation in anomalously increasing years (a~c) and anomalously decreasing years (d~f).(a) Pattern 1 of abnormal increase year, (b) Pattern 2 of abnormal increase year, (c) Pattern 3 of abnormal increase year, (d) Pattern 1 of abnormal decrease year, (e) Pattern 2 of abnormal decrease year, (f) Pattern 3 of abnormal decrease year

3.3 季风指数及其与夏季降水的相关性

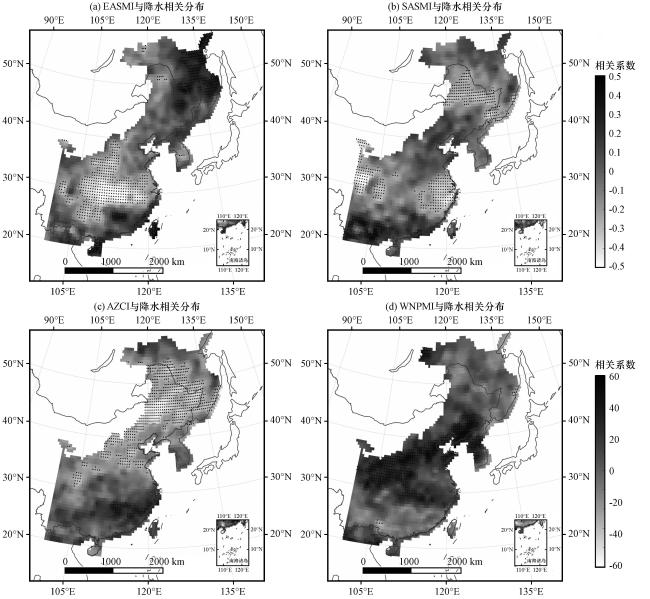
基于数据集以及相关计算分析结果, 阐明了与东亚季风区夏季降水关系密切的四个季风指数随时间的变化, 其空间范围和标准化序列结果如图4所示。通过进一步分析了空间格点夏季降水与四个季风指数之间的相关性, 结果如图5所示, EASMI与季风区降水表现出两个相关中心, 分布集中且相关性显著, 分别与中部降水呈显著负相关关系, 而与东北部区域以及南部沿海区域降水呈显著正相关关系; SASMI与季风区降水相关性分布较离散, 分别与中国东部沿海、 青藏高原东麓以及东北部区域呈负相关关系, 并在南部及沿海区域存在正相关分布特征; AZCI在35°N以北与降水呈现出西南-东北的负相关关系分布, 并在东南沿海区域存在正相关中心; WNPMI在25°N以北与降水呈现出西南-东北的正相关关系分布, 分布较为集中, 且未出现明显的负相关分布。这与先前学者的研究结果相符合(陈海山和陈健康, 2017; 靳莉君和赵平, 2012; 汪卫平和杨修群, 2008; 谢傲和罗伯良, 2023)。由以上分析可得, 4个季风指数都与东亚季风区夏季降水存在不同的显著相关关系, 表明东亚季风区夏季降水异常同时与东亚季风、 南亚季风、 西风环流都有密切的关系, 是不同季风系统共同作用的结果, 引入AZCI以及WNPMI对研究东亚季风区季风与降水关系是十分必要的。
图4 1951 -2020年东亚季风区季风指数空间范围(a)及其标准化序列(b~e)

(a)各季风指数的空间分布, (b)EASMI季风指数标准化序列, (c) SASMI季风指数标准化序列, (d) AZCI季风指数标准化序列, (e) WNPMI季风指数标准化序列

Fig.4 Spatial extent of monsoon index (a) and its normalized time series (b~e) in the East Asian monsoon region from 1951 to 2020.(a) Spatial extent of monsoon indexes, (b) EASMI normalized time series, (c) SASMI normalized time series, (d) AZCI normalized time series, (e) WNPMI normalized time series

图5 1951 -2020年东亚季风区夏季降水与不同季风指数的相关系数分布

(a)EASMI与降水相关分布, (b) SASMI与降水相关分布, (c) AZCI与降水相关分布, (d) WNPMI与降水相关分布。黑色打点区域表示相关系数通过了0.05显著性水平的检验

Fig.5 Distribution of correlation coefficients between summer precipitation and different monsoon indices in the East Asian monsoon region from 1951 to 2020.(a) Correlation coefficients between precipitation and EASMI, (b) Correlation coefficients between precipitation and SASMI, (c) Correlation coefficients between precipitation and AZCI, (d) Correlation coefficients between precipitation and WNPMI.Black dots area indicates the correlation coefficient has passes the significance level at 0.05

3.4 不同季风配置对东亚季风区夏季降水的影响

为进一步研究夏季风对东亚季风区夏季降水的影响机制, 我们将季风指数标准化序列> 0.5(<-0.5)的年份识别为该季风强年(弱年), 并统计了降水异常增加年和异常减少年的季风强弱配置, 结果如表2所示。结合表2的结果我们发现, 在降水异常增加的9年中, 有5年都是WNPMI强年份, 且有5年都是EASMI或AZCI弱年份, 我们将WNPMI强年份, EASMI和AZCI弱年这样的季风配置记为“配置1”。在降水异常减少的9年中, 有6年都是AZCI强年, 且有4年都是EASMI或SASMI弱年, 我们将AZCI强年, EASMI和SASMI弱年份这样的季风配置记为“配置2”。
表2 降水异常增加年和异常减少年的季风强弱配置

Table 2 Monsoon configurations for years with anomalous precipitation increases and decreases

异常增加年 异常减少年
年份 EASMI SASMI AZCI WNPMI 年份 EASMI SASMI AZCI WNPMI
1954 + - + 1967 + + - -
1959 - - 1976
1994 + + + 1978 + + +
1995 - - + + 1988 - - +
1998 - - 1989 - + -
2013 - - + 1992 -
2017 - + + 2004 + + + -
2018 + - 2011 - - + +
2020 - - - + 2015 - - + -

“+”和“-”分别代表季风指数强年和弱年(“+" and " - "respectively represent strong and weak years of monsoon index)

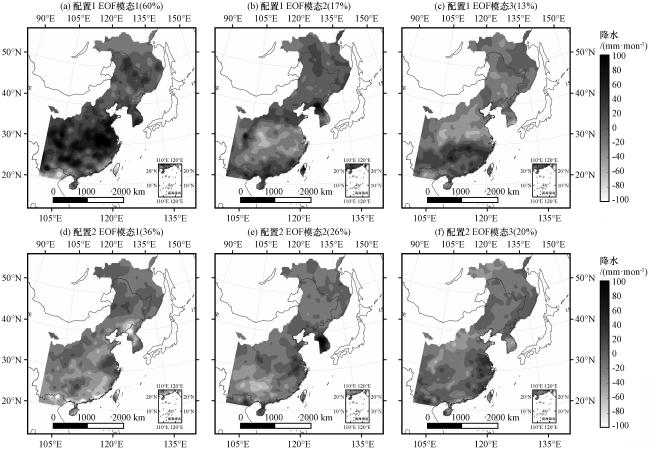
进一步筛选出了1951 -2020年所有配置1和配置2的年份, 将其夏季降水进行EOF分析, 结果如图6所示。图6(a)~(c)表示配置1降水前三个EOF模态的空间分布特征, 其中, 各模态的解释方差分别为60%、 17%和13%。如图6所示, 模态1方差解释度显著大于其他模态, 表现出和图3(a)中模态1相似的南北向“-、 +、 -”的三极型分布, 然而, 其中部降水中心范围更大, 强度更强, 几乎占据了整个东亚季风区中南部, 和图3(b)类似, 在东北部区域也有降水中心分布; 模态2表现出和图3(b)中模态2类似的结构, 为相位相反的三极型分布, 并在四川盆地、 朝鲜半岛以及东北部区域降水显著增加; 模态3表现出和图3(c)中模态3类似的结构, 表现为南-北方向“+、 -”的偶极型结构, 但分布更集中, 分界线更明晰, 更接近于图2(b)中模态2的空间分布。图6中(d)~(f)表示配置2降水前三个EOF模态的空间分布特征, 其中, 各模态的解释方差分别为36%、 26%和20%, 配置2的三个模态方差解释度差异较小, 均在一定程度上反映了配置2年夏季降水的空间分布状况。模态1表现出和图3(e)中模态2相似的分布, 在江浙沿海出现降水中心, 但未呈现出明显的极型空间格局; 模态2表现出和图3(d)中模态1类似的结构, 为南北向“-、 +、 -”的三极型分布, 然而降水中心主要集中在江浙沿海, 且在云南、 贵州、 广西地区出现明显的降水减少; 模态3表现出和图3(f)中模态3类似的结构, 表现为东南-西北方向“+、 -”的偶极型结构, 中北部区域降水减少。
图6 季风配置1(a~c)和配置2(d~f)时东亚季风区夏季降水EOF模态

(a) 配置1的EOF模态1, (b) 配置1的EOF模态2, (c) 配置1的EOF模态3, (d) 配置2的EOF模态1, (e) 配置2的EOF模态2, (f) 配置2的EOF模态3

Fig.6 The EOF patterns of summer precipitation in the East Asian monsoon region under monsoon configuration 1 (a~c) and configuration 2 (d~f).(a) Pattern 1 of configuration 1, (b) Pattern 2 of configuration 1, (c) Pattern 3 of configuration 1, (d) Pattern 1 of configuration 2, (e) Pattern 2 of configuration 2, (f) Pattern 3 of configuration 2

由上可得, 配置1、 配置2的年降水EOF模态基本和降水异常增加年和异常减少年的EOF模态相符, 由于降水异常减少年与配置2年EOF模态之间方差解释度差异较小, 存在错位对应的情况。这说明1951 -2020年东亚季风区夏季降水异常增加与减少主要由季风配置1和配置2主导, 换而言之, 当季风配置1、 配置2出现时, 极易在东亚季风区夏季出现降水异常。如图4(a)所示, WNPMI反映了太平洋西部季风的东南风向强度, 当配置1出现时, WNPMI属于强年, 意味着此时热带季风强劲, 西太平洋副高位置偏西南, 大陆季风区容易被高压西侧控制, 再加上AZCI处于弱年份, 副高所受到的中纬度扰动较小, 能够深入到大陆内部。其携带的丰沛水汽越过华南沿海地区, 在华北以及长江中下游地区形成降水, 导致降水异常增加。此外, 如果这时SASMI也处于强年份, 便会在四川盆地、 云南以及两广地区形成相互扰动, 导致该地区降水增加。而当配置2发生时, 由于AZCI处于强年, 横跨亚欧大陆的西风带经向波动较小, 除了自身难以在大陆内部形成降水外, 还会阻碍西太平洋副高的登陆, 使太平洋水汽只能在沿海地区形成降水, 无法深入大陆, 导致东亚季风区夏季降水异常减少。

3.5 不同季风配置时东亚季风区环流结构及水汽分布

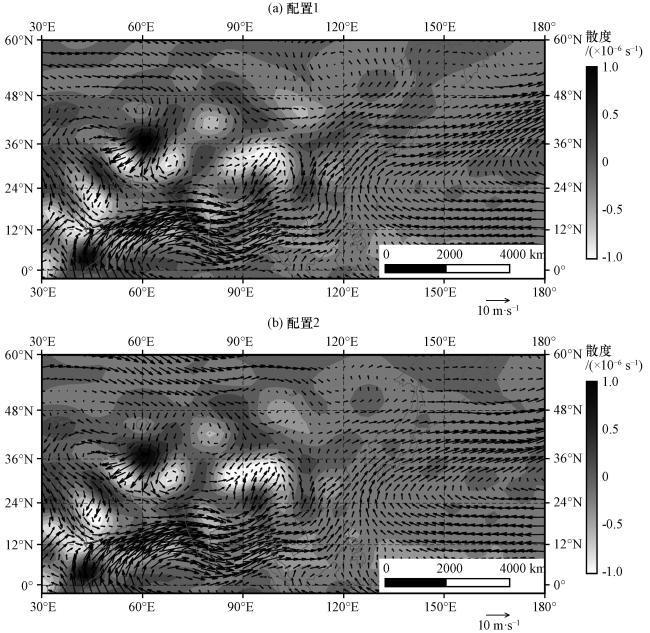
风场的异常变化对夏季降水存在重要影响。如图7所示结果为配置1、 配置2年夏季850 hPa风场及散度图, 从图7(a)可以看出, 配置1时, 青藏高原东麓、 云南四川地区存在明显的气旋式环流, 其北部为西风槽, 低纬度地区北上的暖湿气流与南下的冷空气在中纬度季风区相遇, 冷暖气流明显, 有利于降水; 东亚季风区东北部区域也有一气旋式环流, 中心位于贝加尔湖东, 其西南气流加强了西风槽南下气流有利于冷空气向南活动; 此外, 由于处于WNPMI强年, 西太平洋副高偏南, 强劲的东南信风迫使跨越过中南半岛的南亚季风无法继续向东输送水汽, 而是北上将暖湿气流带到长江流域一带中低纬季风区, 有利于东亚季风区中部形成降水, 强劲的东南季风也使得水汽无法在东亚季风区东南沿海一带降落, 形成了三极型降水格局, 这种格局在全球气温升高背景下, 会导致东南沿海地区的异常降水增加。
图7 东亚季风区夏季风不同配置时850 hPa风场(矢量, 单位: m·s-1)及其散度(阴影, 单位: ×10-6 s-1)

(a)配置1, (b)配置2

Fig.7 The horizontal wind (vector, unit: m·s-1) and divergence (the shaded, unit: ×10-6 s-1) at 850 hPa under different monsoon configurations in the East Asian monsoon region.(a) Configuration 1, (b) Configuration 2

配置2中, 强劲的西风环流未能在季风区中高纬度形成明显的西风槽, 反而在越过蒙古高原时形成了反气旋式环流, 其余西风气流继续向东, 汇入偏北的副高西北侧气流, 不利于冷空气的南下。由于处于SASMI弱年, 从孟加拉湾北上的暖湿气流, 在青藏高原东南麓形成气旋式环流, 而由于没有西风槽南下气流的作用, 冷暖气流变化不明显, 低纬度地区北上的暖湿气流主要汇入印度低压和南海气流, 不利于降水产生[图7(b)], 会使该区域出现干旱和降水减少。
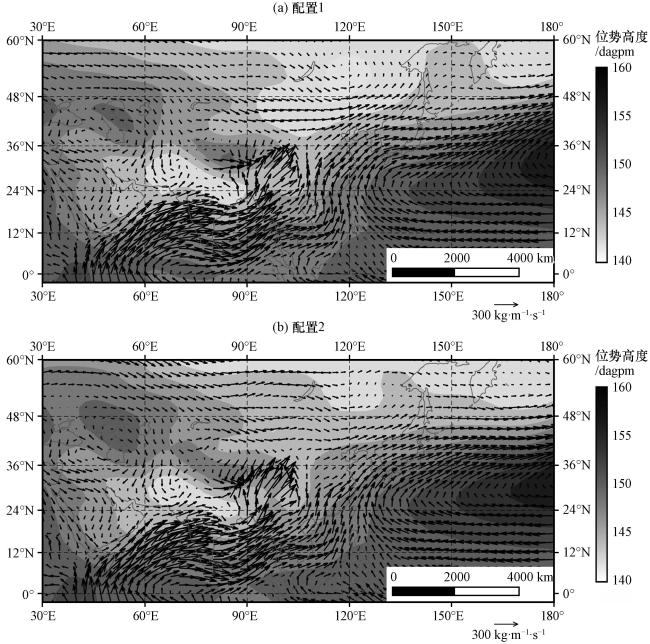
水汽运动是决定东亚季风区水资源分布和变化趋势的关键因素之一。图8为配置1、 配置2年水汽通量以及850 hPa位势高度合成图, 从图8(a)可以看出, 配置1时, WNPMI处于强年, 西太副高偏南偏西。来自印度洋的暖湿气流越过印度半岛后, 一部分在孟加拉湾迅速北上, 与南下的西风支流形成切变线, 在青藏高原东麓以及四川盆地等地形成大量降水, 另一部分越过中南半岛后, 在偏南的西延伸副高作用下, 加强了南海区域的水汽输送, 在长江流域一带形成降水。此外, 由于AZCI处于弱年, 西风槽的存在, 部分水汽也会在西风推动下, 与西侧副高压支流结合后, 在季风区的东北部产生降水。而配置2中, 由于SASMI处在弱年, 在孟加拉湾登陆的水汽比配置1少, 又由于处在AZCI强年, 强劲的西风以水平运动为主, 部分水汽被西风裹挟, 继续向东运动, 无法形成切变线天气系统, 在季风区西南部的降水较配置1更少。此外, 由于南亚季风较弱, 大量水汽在跨越中南半岛时被消耗, 又由于西太副高压较配置1偏北, 副高西脊点对大陆影响较小, 部分南海水汽继续向东北移动, 另一部分登陆的水汽也无法深入大陆内部, 使得降水主要形成于东南沿海区域, 不利于内陆降水, 造成从东南到西北“+、 -”的偶极型降水分布, 造成了该区域的干旱年份有所增加。此外, 由于西风以水平运动为主, 没有西风槽影响后, 水汽水平向东进入太平洋, 无法在东北部季风区形成有效降水[图8(b)]。
图8 东亚季风区夏季风不同配置时整层水汽通量积分(矢量, 单位: kg·m-1·s-1)和850 hPa位势高度合成(阴影, 单位: dagpm)

(a)配置1, (b)配置2

Fig.8 The water vapor flux integrated from the Earth’s surface up to 300 hPa (vector, unit: kg·m-1·s-1) and potential height (the shaded, unit: dagpm) under different monsoon configurations in the East Asian monsoon region.(a) Configuration 1, (b) Configuration 2

4 结论

基于EOF分析, 利用GPCC降水资料、 NCEP/NCAR再分析资料和东亚夏季风指数, 研究了东亚季风区降水时空格局以及4种夏季风强弱变化, 识别出了造成东亚季风区降水异常的季风配置, 并从环流结构、 水汽输送等方面揭示不同季风配置对东亚季风区夏季降水的影响, 得到如下主要结论:
(1) 1951 -2020年东亚季风区降水经历了先减少后增加的变化, 低谷值在1992年。EOF分析较好地展现了东亚季风区夏季降水的时空分布, 主要表现为南北向“-、 +、 -”的三极型结构以及南北向反相变化的偶极型结构。降水异常主要发生在三极型降水结构的相位转换上, 其次是偶极型的相位转换。
(2) 东亚季风区夏季降水异常是EASMI、 SASMI、 AZCI以及WNPMI等系统共同作用的结果, 引入AZCI以及WNPMI对研究东亚季风区季风与降水关系十分重要。导致东亚季风区降水异常增加和减少的季风配置分别为配置1(WNPMI强, EASMI和AZCI弱)和配置2(AZCI强, EASMI和SASMI弱)。
(3) 当季风配置表现为配置1(配置2)时, 东亚季风区夏季降水异常增加(减少), 极易造成旱涝灾害。配置1时, WNPMI强, EASMI和AZCI弱, 西太副高偏南偏西, 中高纬形成西风槽。海洋暖湿气流一部分与西风槽南下气流形成切变线产生降水, 另一部分在副高作用下深入大陆, 在季风区中部形成降水, 造成南北向“-、 +、 -”的三极型降水分布, 整体降水显著上升, 导致降水异常增加。配置2时, AZCI强, EASMI和SASMI弱, 未出现西风槽, 南方海洋气流动力不足, 季风难以深入大陆, 在东南沿海一带形成降水, 造成南北向 “+、 -”的偶极型降水分布, 降水总体降低, 导致降水异常减少。
此外, 亚洲各季风子系统与东亚季风区降水的协同机制, 以及东亚夏季旱涝异常的内在机理问题较为复杂, 需结合其他影响因子进一步深入细致地分析和研究。

References

null
Cai Y J, Tan L C, Cheng H, et al, 2010.The variation of summer monsoon precipitation in Central China since the last deglaciation[J].Earth and Planetary Science Letters, 291(1): 21-31.
null
Ha K J, Seo Y W, Lee J Y, et al, 2017.Linkages between the South and East Asian summer monsoons: a review and revisit[J].Climate Dynamics, 51: 4207-4227.DOI: 10.1007/s00382-017-3773-z .
null
Hartmann D L, Klein A M G, Rusicucci M, et al, 2013.Observations: atmosphere and surface.Climate Change 2013: the physical science basis[M].Stocker T F, et al, Eds, Cambridge University Press, 159-254.
null
Hsu H H, Zhou T J, Matsumoto J, 2014.East Asian, Indochina and Western North Pacific summer monsoon-an update[J].Asia-Pacific Journal of Atmospheric Sciences, 50: 46-68.
null
Huang R H, Zhou L T, Chen W, 2003.The progresses of recent studies on the variabilities of the East Asian monsoon and their causes[J].Advances in Atmospheric Sciences, 20(1): 55-69.DOI: 10.1007/BF03342050 .
null
Kitoh A H, Endo K, Krishna K I, et al, 2013.Monsoons in a changing world: a regional perspective in a global context[J].Journal of Geophysical Research-Atmospheres, 118: 3053-3065.DOI: 10.1002/JGRD.50258 .
null
Kripalani R H, Oh J H, Chaudhari H S, 2010.Delayed influence of the Indian Ocean Dipole mode on the East Asia-West Pacific monsoon: possible mechanism[J].International Journal of Climatology, 30(2): 197-209.
null
Lee E J, Ha K J, Jhun J G, 2014.Interdecadal changes in interannual variability of the global monsoon precipitation and interrelationships among its subcomponents[J].Climate Dynamics, 42: 2585-2601.
null
Li J N, Zheng Y P, Li F Z, et al, 2014.The structural characteristics of precipitation in Asian-Pacific’s three monsoon regions measured by tropical rainfall measurement mission[J].Acta Oceanologica Sinica, 33: 111-117.DOI: 10.1007/s13131-014-0417-6 .
null
Li J P, Zeng Q C, 2003.A new monsoon index and the geographical distribution of the global monsoons[J].Advances in Atmospheric Sciences, 20(2): 299-302.
null
Lian T, Chen D, 2012.An evaluation of rotated EOF Analysis and its application to tropical Pacific SST variability[J].Journal of Climate, 25: 5361-5373.DOI: 10.1175/jcli-d-11-00663.1 .
null
Qu J X, Gong D Y, Mao R, et al, 2016.Possible influence of Arctic oscillation on precipitation along the East Asian rain belt during boreal spring[J].Theoretical and Applied Climatology, 130: 487-495.DOI: 10.1007/s00704-016-1900-0 .
null
Sampe T, Xie S P, 2010.Large-scale dynamics of the Meiyu-Baiu rainband: environmental forcing by the westerly jet[J].Journal of Climate, 23(1): 113-134.
null
Schneider U, H?nsel S, Finger P, et al, 2022.GPCC full data monthly product version 2022 at 0.25°: Monthly land-surface precipitation from rain-gauges built on GTS-based and historical data[DB/OL].DOI: 10.5676/DWD_GPCC/FD_M_V2022_025 .[2023-09-07].
null
Seneviratne S I, 2012.Changes in climate extremes and their impacts on the natural physical environment.Managing the risks of extreme events and disasters to advance climate change adaptation, Field C B, et al, Eds[M].Cambridge University Press, 109-230.
null
Shi Y, Jiang Z H, Liu Z Y, et al, 2020.A Lagrangian Analysis of water vapor sources and pathways for precipitation in East China in different Stages of the East Asian Summer Monsoon[J].Journal of Climate, 33: 977-992.DOI: 10.1175/jcli-d-19-0089.1 .
null
Tao Y, Cao J, Lan G D, et al, 2016.The zonal movement of the Indian-East Asian summer monsoon interface in relation to the land-sea thermal contrast anomaly over East Asia[J].Climate Dynamics, 46(9/10): 2759-2771.
null
Trenberth K E, Jones P D, Ambenje P, et al, 2007.Observations: Surface and atmospheric climate change.Climate Change 2007: The physical science basis, S.Solomon et al, Eds[M].Cambridge University Press, 235-336.
null
Trenberth K E, 1991.Climate diagnostics from global analyses: conservation of mass in ECMWF analyses[J].Journal of Climate, 4: 707-722.
null
Wang J, Liu H J, Kim P J, et al, 2012.Recent change of the global monsoon precipitation (1979-2008)[J].Climate Dynamics, 39: 1123-1135, DOI: 10.1007/s00382011-1266-z .
null
Wang B, Wu Z W, Li J P, et al, 2008.How to measure the strength of the East Asian summer monsoon[J].Journal of Climate, 21: 4449-4463.DOI: 10.1175/2008jcli2183.1 .
null
Wu G X, Guan Y, Liu Y M, et al, 2012.Air-sea interaction and formation of the Asian summer monsoon onset vortex over the Bay of Bengal[J].Climate Dynamics, 38(1/2): 261-279.
null
Zhang W X, Zhou T J, 2019.Significant increases in extreme precipitation and the associations with global warming over the global land monsoon regions[J].Journal of Climate, 32: 8465-8488.DOI: 10.1175/jcli-d-18-0662.1 .
null
曹博文, 严蜜, 刘征宇, 等, 2023.过去千年东亚季风环流与内部变率对中国东部年代际降水分型的影响研究[J].第四纪研究, 43(4): 1076-1088.DOI: 10.11928/j.issn.1001-7410.2023.04.15.Cao B ,
null
Yan M, Liu Z Y, et al, 2023.A study on the relationship between the summer rainfall pattern and the East Asian monsoon circulation and internal variability at decadal scale over the past millennium[J].Quaternary Sciences, 43(4): 1076-1088.DOI: 10.11928/j.issn.1001-7410.2023.04.15 .
null
陈海山, 陈健康, 2017.东亚夏季风指数的分类及物理特征分析[J].大气科学学报, 40(3): 299-309.DOI: 10.13878/j.cnki.dqkxxb.20160323001.Chen H S ,
null
Chen J K, 2017.Classification of East Asian summer monsoon indices and their basic physical features[J].Transactions of Atmospheric Sciences, 40 (3): 299-309.DOI: 10.13878/j.cnki.dqkxxb.20160323001 .
null
陈金明, 陆桂华, 吴志勇, 等, 2016.1960-2009年中国夏季极端降水事件与气温的变化及其环流特征[J].高原气象, 35(3): 675-684.DOI: 10.7522/j.issn.1000-0534.2015.00072.Chen J M ,
null
Lu G H, Wu Z Y, et al, 2016.Change properties of summer extreme precipitation events and temperature and associated large-scale circulation in China during 1960-2009[J].Plateau Meteorology, 35(3): 675-684.DOI: 10.7522/j.issn.1000-0534.2015.00072 .
null
陈子凡, 王磊, 李谢辉, 等, 2022.西南地区极端降水时空变化特征及其与强ENSO事件的关系[J].高原气象, 41(3): 604-616.DOI: 10.7522/j.issn.1000-0534.2022.00004.Chen Z F ,
null
Wang L, Li X H, et al, 2022.Spatiotemporal change characteristics of extreme precipitation in South‐ western China and its relationship with intense ENSO events[J].Plateau Meteorology, 41(3): 604-616.DOI: 10.7522/j.issn.1000-0534.2022.00004 .
null
丁一汇, 孙颖, 刘芸芸, 等, 2013.亚洲夏季风的年际和年代际变化及其未来预测[J].大气科学, 37(2): 253-280.DOI: 10.3878/j.issn.1006-9895.2012.12302.Ding Y H ,
null
Sun Ying, Liu Y Y, et al, 2013.Interdecadal and interannual variabilities of the Asian summer monsoon and its projection of future change[J].Chinese Journal of Atmospheric Sciences, 37 (2): 253–280.DOI: 10.3878/j.issn.1006-9895.2012.12302 .
null
杜梦莹, 李艳, 冯娟, 2022.亚洲季风区内北半球秋季哈德莱环流特征及其与热带海温之间关系[J].高原气象, 41(6): 1399-1409.DOI: 10.7522/j.issn.1000-0534.2021.00093.Du M Y ,
null
Li Y, Feng J, 2022.Characteries of boreal autumn Hadley circulation over the Asian domain and its relationship with tropical SST[J].Plateau Meteorology, 41(6): 1399-1409.DOI: 10.7522/j.issn.1000-0534.2021.00093 .
null
顾元华, 郭品文, 胡景高, 等, 2023.南亚和东亚热带夏季风强弱不同配置及其对中国夏季降水的影响[J].气象科学, 43(1): 15-24.DOI: 10.12306/2022jms.0058.Gu Y H ,
null
Guo P W, Hu J G, et al, 2023.Different configurations of interannual variation between East Asian tropical summer monsoon and South Asian summer monsoon[J].Journal of the Meteorological Sciences, 43(1): 15-24.DOI: 10.12306/2022jms.0058 .
null
何静, 范广洲, 张永莉, 等, 2021.气候变化背景下陆地季风与非季风区极端降水特征对比[J].高原气象, 40(2): 324-332.DOI: 10.7522/j.issn.1000-0534.2020.00077.He J ,
null
Fan G Z, Zhang Y L, et al, 2021.Land monsoon and non‐monsoon regions under climate change com‐parison of extreme precipitation characteristics[J].Plateau Meteorology, 40(2): 324-332.DOI: 10.7522/j.issn.1000-0534.2020.00077 .
null
桓玉, 李跃清, 2018.夏季东亚季风和南亚季风协同作用与我国南方夏季降水异常的关系[J].高原气象, 37(6): 1563-1577.DOI: 10.7522/j.issn.1000-0534.2018.00044.Huan Y ,
null
Li Y Q, 2018.The synergy between the East Asian summer monsoon and the south Asian summer monsoon and its relations with anomalous rainfall in southern China[J].Plateau Meteorology, 37(6): 1563-1577.DOI: 10.7522/j.issn.1000-0534.2018.00044 .
null
黄荣辉, 陈际龙, 刘永, 2011.我国东部夏季降水异常主模态的年代际变化及其与东亚水汽输送的关系[J].大气科学, 35(4): 589-606.
null
Huang R H, Chen J L, Liu Y, 2011.Interdecadal variation of the leading modes of summertime precipitation anomalies over Eastern China and its association with water vapor transport over East Asia[J].Chinese Journal of Atmospheric Sciences, 35 (4): 589-606.
null
靳莉君, 赵平, 2012.夏季南海季风对长江中下游季风降水影响的观测分析和数值模拟[J].气象学报, 70(4): 670-680.
null
Jin L J, Zhao P, 2012.Observationally analyzing and numerically simulating the impacts of the South China Sea summer monsoon on summer monsoon rainfall in the middle-lower reaches of the Yangtze River[J].Acta Meteorologica Sinica, 70(4): 670-680.
null
李建平, 曾庆存, 2005.一个新的季风指数及其年际变化和与雨量的关系[J].气候与环境研究, 10(3): 351-365.
null
Li J P, Zeng Q C, 2005.A new monsoon index, its interannual variability and relation with monsoon precipitation[J].Climatic and Environmental Research, 10(3): 351-365.
null
任菊章, 琚建华, 米瑞芝, 等, 2021.亚洲热带夏季风指数与中国南方降水的关系[J].气象科学, 41(2): 228-236.DOI: 10.12306/2020jms.0017.Ren J Z ,
null
Ju J H, Mi R Z, et al, 2021.The relationship between Asian tropical summer monsoon index and precipitation in southern China[J].Journal of the Meteorological Sciences, 41(2): 228-236.DOI: 10.12306/2020jms.0017 .
null
汪卫平, 杨修群, 2008.索马里急流变异及其与东亚夏季风和中国降水异常的关系[J].气象科学, 28(2): 139-146.
null
Wang W P, Yang X Q, 2008.Variation of Somali jet and its impact on East Asian summer monsoon and associated China rainfall anomalies[J].Scientia Meteorological Sinica, 28(2): 139-146.
null
谢傲, 罗伯良, 2023.东亚夏季风指数分类与长江中游地区夏季降水的关系[J].中低纬山地气象, 47(1): 25-30.
null
Xie A, Luo B L, 2023.Relationship between east asian summer monsoon classification and summer precipitation in middle reaches of the yangtze river[J].Mid-low Latitude Mountain Meteorology, 47(1): 25-30.
null
晏红明, 王灵, 金燕, 等, 2023.云南冬季气温变化的主要模态及其影响的关键环流因子[J].高原气象, 42(2): 386-402.DOI: 10.7522/j.issn.1000-0534.2021.00070.Yan H M ,
null
Wang L, Jin Y, et al, 2023.Dominant patterns of winter temperature variation in Yunnan and key circulation factors affecting on them[J], Plateau Meteorology, 42(2): 386-402.DOI: 10.7522/j.issn.1000-0534.2021.00070 .
null
杨涵洧, 龚志强, 王晓娟, 等, 2021.中国东部夏季极端降水年代际变化特征及成因分析[J].大气科学, 45(3): 683-696.DOI: 10.3878/j.issn.1006-9895.2007.19247.Yang H W ,
null
Gong Z Q, Wang X J, et al, 2021.Analysis of the characteristics and causes of interdecadal changes in the summer extreme precipitation over eastern China[J].Chinese Journal of Atmospheric Sciences, 45(3): 683-696.DOI: 10.3878/j.issn.1006-9895.2007.19247 .
Outlines

/

〈 〉