
1 引言
2 资料来源及数据预处理
2.1 资料介绍
2.2 数据的预处理
2.3 验证数据
3 质量控制方法介绍
3.1 常规质量控制方法
3.2 基于EOF分析的质量控制方法
4 背景场误差对质量控制影响分析
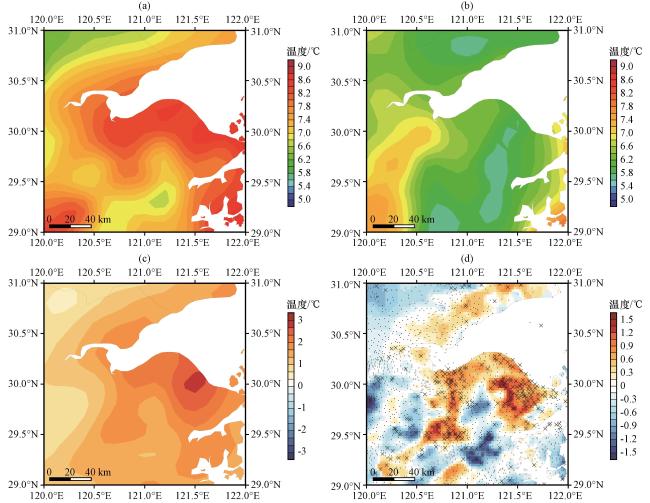
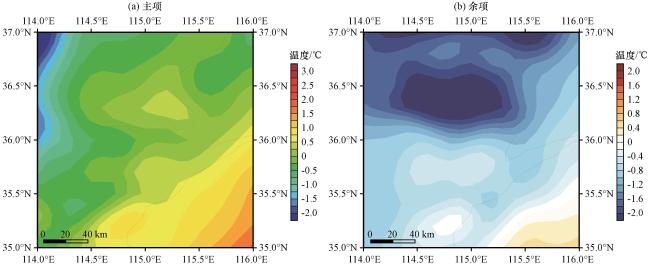
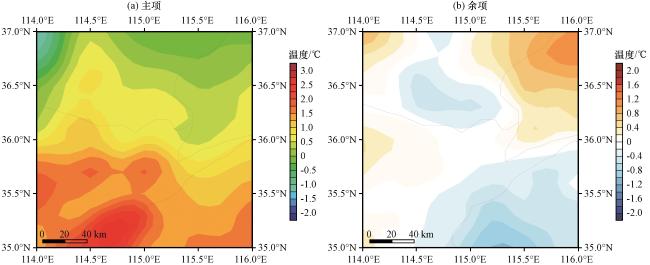
图3 2022年1月22日05:00观测温度(a, 彩色区, 单位: ℃), 背景场温度(b, 彩色区, 单位: ℃)和观测减背景场温度(c, 彩色区, 单位: ℃)空间分布及质量控制结果(d)图(d)中黑点为未被剔除站点, 叉为剔除站点, 阴影为观测和背景场温度的余项之差(单位: ℃) Fig.3 Spatial distribution of observed temperature (a, color area, unit: ℃), background temperature (b, color area, unit: ℃), and their differences (observed-background) (c, color area, unit: ℃) at 05:00 on January 22, 2022 and for the quality control result (d).In Fig.3(d), the black points are for reserved observation, the crosses are for the rejected data, and the color area is the residual difference between the observed and the background (unit: ℃) |
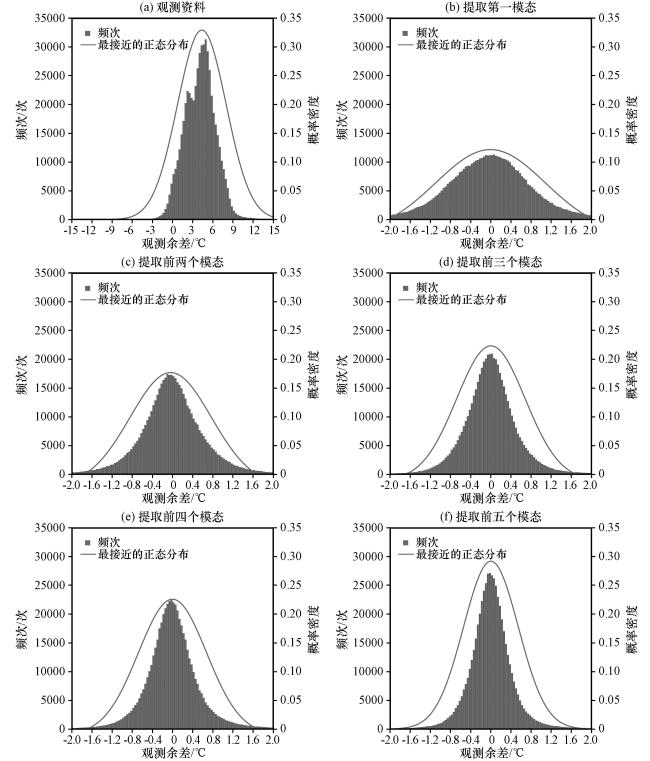
图4 2022年1月20 -27日30°N-34°N, 114°E-118°E区域自动站温度观测资料(a)和n分别取1~5时余项(b~f)概率分布(a) 观测资料, (b) 提取第一个模态后的余项, (c) 提取前两个模态后的余项, (d) 提取前三个模态后的余项, (e) 提取前四个模态后的余项, (f) 提取前五个模态后的余项.灰色实线为最接近的正态分布函数曲线 Fig.4 Probability distribution of temperature observations (a) and residuals after first 1~5 EOF modes extracted (b~f) in areas 30°N -34°N, 114°E -118°E during 20 -27 January, 2022.(a) temperature observations, (b) residuals after first EOF mode, (c) residuals after 1~2 EOF modes, (d) residuals after 1~3 EOF modes, (e) residuals after 1~4 EOF modes, (f) residuals after 1~5 EOF modes.Gray solid curves are for the closest normal distribution function |
5 EOF质量控制方法模态阈值
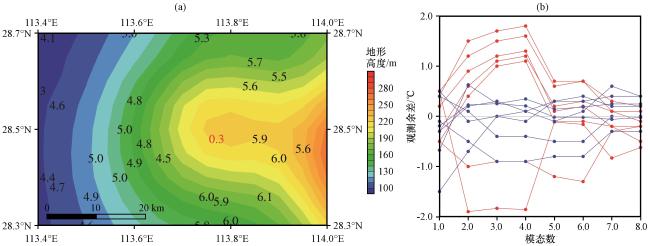
图5 2022年1月27日08:00观测温度空间分布(a, 数值, 单位: ℃)及14个不同站点在提取第一个模态至提取前八个模态时的观测余差(b)图(a)中红色数字为人工识别的错误站点, 阴影为地形高度(单位: m); 图(b)中红色为错误站点, 分别位于(117.29°E, 34.32°N); (117.58°E, 34.24°N); (117.11°E, 34.15°N); (113.77°E, 28.48°N); (116.43°E, 33.78°N); (117.29°E, 34.32°N); (117.58°E, 34.24°N); 蓝色为保留站点, 分别位于(117.82°E, 31.02°N); (117.97°E, 34.87°N); (117.4°E, 33.25°N); (116.36°E, 33.24°N); (116.12°E, 33.02°N); (116.56°E, 34.97°N); (116.64°E, 34.96°N) Fig.5 Spatial distribution of observed temperature at 08:00 on January 27, 2022 (a, the number, unit: ℃) and the residuals of 14 selected stations when different mode extracted (b).The red station in Fig.5(a) represent manually identified erroneous stations, and the shadows represent terrain height (in meters); in Fig.5(b), the red indicates incorrect stations located at (117.29°E, 34.32°N); (117.58°E, 34.24°N); (117.11°E, 34.15°N); (113.77°E, 28.48°N); (116.43°E, 33.78°N); (117.29°E, 34.32°N); (117.58°E, 34.24°N); Blue represents reserved sites located at (117.82°E, 31.02°N); (117.97°E, 34.87°N); (117.4°E, 33.25°N); (116.36°E, 33.24°N); (116.12°E, 33.02°N); (116.56°E, 34.97°N); (116.64°E, 34.96°N) |
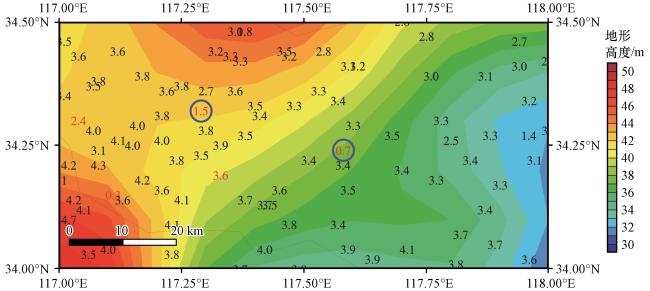
图6 2022年1月21日23:00观测温度的空间分布(数字, 单位: ℃)红色数字为仅n=4的质量控制方法识别的错误站点(单位: ℃); 阴影为地形高度(单位: m) Fig.6 Spatial distribution of observed temperature (the number, unit: ℃) at 23:00 on January 21, 2022.The red numbers are wrong data only detected by n=4 quality control (unit ℃), shading represents terrain elevation (unit: m) |
6 自动站资料空间特征尺度对EOF质量控制方法的影响
7 温度强梯度对质量控制的影响
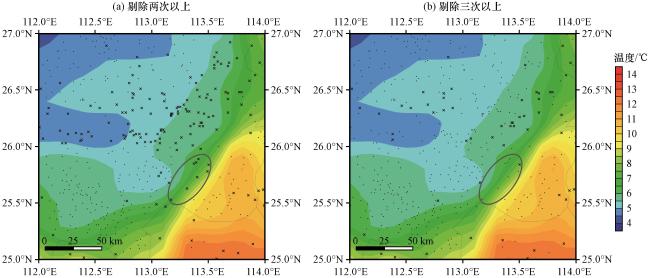
图12 2022年1月25日17:00观测温度的空间分布(彩色区, 单位: ℃)(a) 黑色叉号代表剔除两次以上的检测结果, (b) 黑色叉号代表剔除三次以上的检测结果, 黑色点代表正确资料 Fig.12 Spatial distribution of observed temperature (color area, unit: ℃) in the 2° domain at 17:00 on January 25, 2022.(a) The black cross indicates the result of more than two rejections, (b) The black cross indicates the result of more than three rejections, and the black dot represents the correct information |
8 质量控制结果的正确性验证
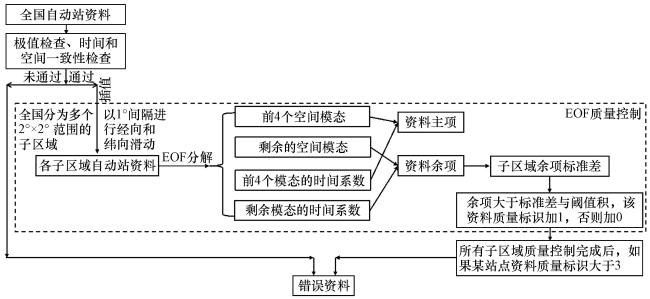
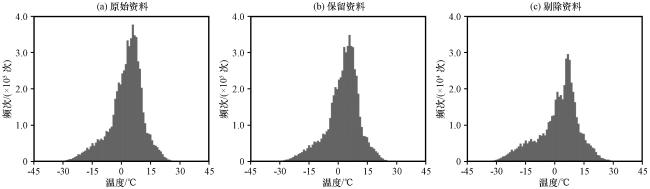
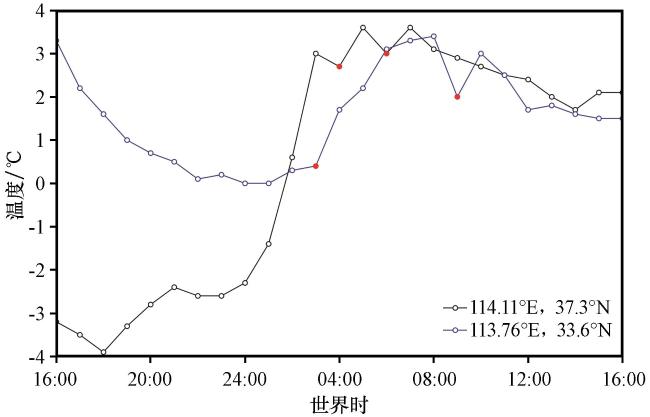
图15 2022年1月21日16:00至22日15:00站点A(114.11°E, 37.29°N, 黑线)以及2022年1月24日16:00至25日15:00站点B(113.76°E, 33.6°N, 蓝线)温度随时间变化红色为质量控制剔除时次 Fig.15 Temperature varying with time for site A (114.11°E, 37.29°N, black curve) on January 21, 2022 and site B (113.76°E, 33.6°N, blue curve) on January 24, 2022.The red dots are for data rejected by the quality control |
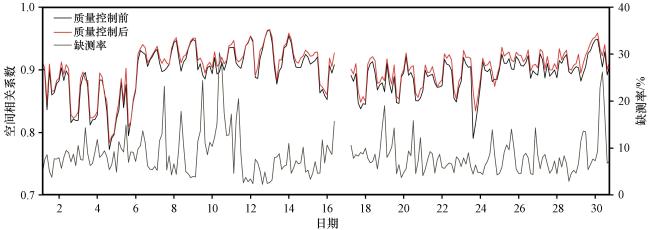
图16 2022年5月1 -30日质量控制前后观测资料与CRA资料的空间相关系数随时间变化曲线黑色是所有观测资料, 红色是仅保留资料, 灰色曲线为剔除率(右边y轴), 空白区代表资料缺测 Fig.16 Spatial correlation coefficient between CRA and all observations (black curve), and between CRA and only data passed the quality control (red curve) from May 1 to May 30, 2022, the gray curve is the rejection rate (y-axis on the right), and blank areas are because data missing |
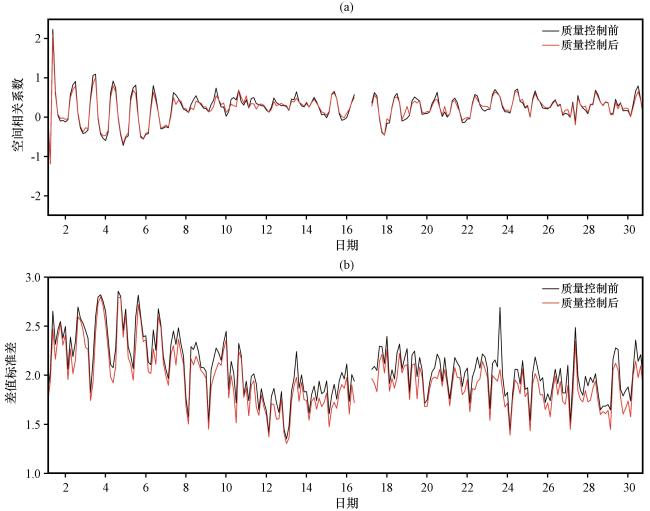
图17 2022年5月1 -30日质量控制前后观测资料和CRA资料差值的平均值(a)和标准差(b)随时间变化曲线黑色是剔除前资料, 红色是保留资料, 空白地区代表资料缺测 Fig.17 Mean (a) and standard deviation (b) of temperature between CRA and observations before (black curve) and after (red curves) the quality control during 1 -30 May 2022.Blank areas represent data missing |