
1 引言
2 数据来源和方法介绍
2.1 积雪数据
2.2 分析方法
2.2.1 偏差及均方根误差的计算
2.2.2 卫星雪盖数据处理
2.2.3 相关分析法
3 结果与讨论
3.1 再分析资料中雪深数据的误差估计
3.2 高原积雪年际及年代际变化特征
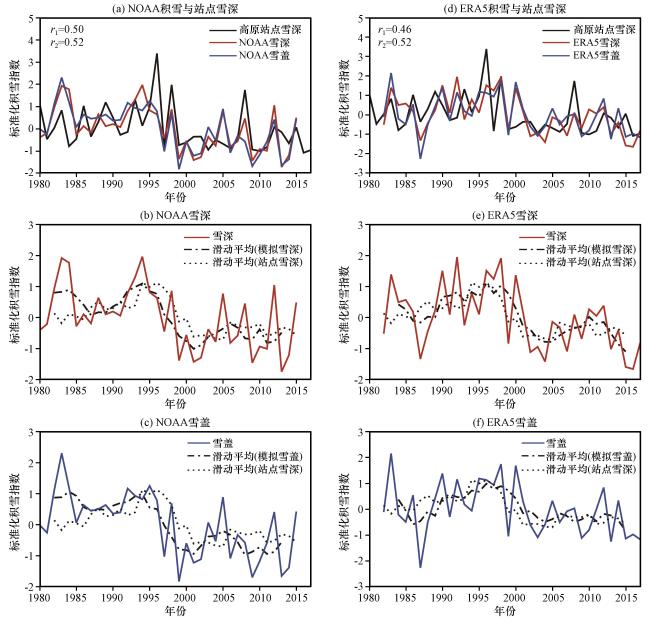
图4 青藏高原站点雪深(黑色)、 NOAA-V3再分析雪深(红色)及雪盖(蓝色)年际变化时间序列(a~c)及青藏高原站点雪深(黑色)、 ERA5再分析雪深(红色)及雪盖(蓝色)年际变化时间序列(d~f)r 1表示站点积雪和再分析雪深的相关关系; r 2表示和雪盖的相关关系; 虚线为5年滑动平均时间序列 Fig.4 Interannual variation of snow depth observed by the 50 stations over the Qinghai-Xizang (Tibetan) Plateau (black) and snow depth by NOAA-V3 (red) snow cover by NOAA-V3 (blue) (a~c), Interannual variation of snow depth observed by the 50 stations over the Qinghai-Xizang (Tibetan) Plateau (black) and snow depth by ERA5 (red) snow cover by ERA5 (blue) (d~f), respectively.The data are standardized, where r 1 represents the correlation with snow depth and r 2 represents the correlation with snow cover, and the dotted line is the time series of five-year moving average |
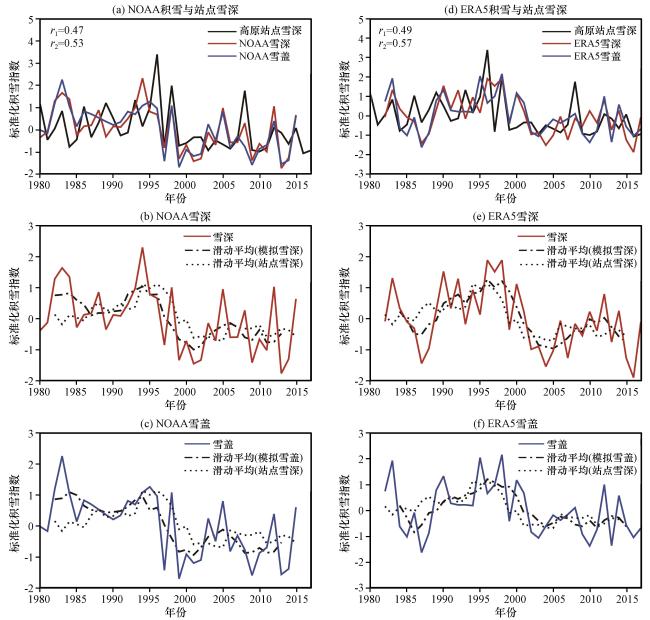
图5 青藏高原站点雪深(黑色)、 NOAA-V3再分析雪深(红色)及雪盖(蓝色)年际变化时间序列(a~c)及青藏高原站点雪深(黑色)、 ERA5再分析雪深(红色)及雪盖(蓝色)年际变化时间序列(d~f)r 1表示站点积雪和再分析雪深的相关关系; r 2表示和雪盖的相关关系; 虚线为5年滑动平均时间序列; 再分析数据为对应站点周围格点的平均值 Fig.5 Interannual variation of snow depth observed by the 50 stations over the Qinghai-Xizang (Tibetan) Plateau (black) and snow depth by NOAA-V3 (red) snow cover by NOAA-V3 (blue) (a~c), Interannual variation of snow depth observed by the 50 stations over the Qinghai-Xizang (Tibetan) Plateau (black) and snow depth by ERA5 (red) snow cover by ERA5 (blue) (d~f), respectively.The data are standardized, where r 1 represents the correlation with snow depth and r 2 represents the correlation with snow cover, the dotted line is the time series of five-year moving average, and the reanalysis data is the average of the grid points around the corresponding site |
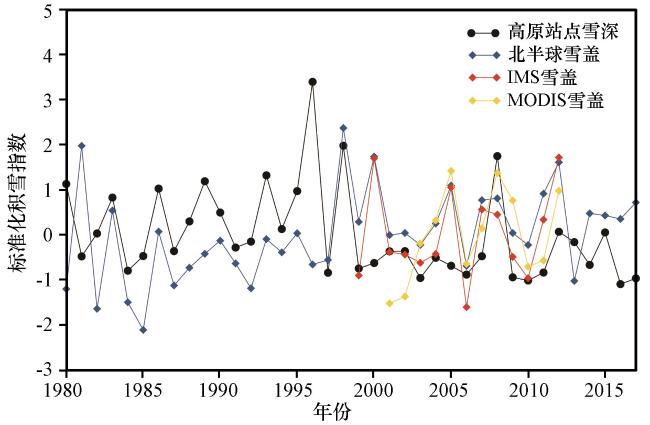
表1 北半球雪盖与青藏高原站点观测雪深的相关关系Table 1 Correlation coefficient between northern hemisphere snow cover and snow depth at station on the eastern Plateau |
| 相关关系 | 高原50站点雪深 |
|---|---|
| 北半球雪盖(1980 -2017年) | 0.06 |
| 北半球雪盖(1980 -2017年)(剔除1996年) | 0.17 |
| 北半球雪盖(1980 -1996年) | 0.23 |
| 北半球雪盖(1980 -1995年) | 0.42 |
| 北半球雪盖(1996 -2017年) | 0.15 |
| 北半球雪盖(1997 -2017年) | 0.62 |
加粗数值表示表示不含1996年的时间序列 |
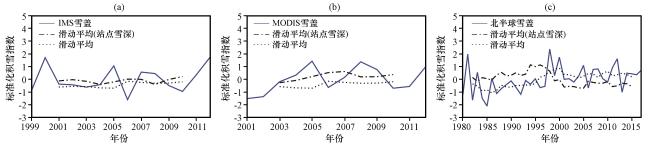
图7 IMS雪盖(a)、 MODIS传感器雪盖(b)、 北半球雪盖(c)以及青藏高原站点观测雪深滑动平均的年际变化时间序列对应各数据时间段, 虚线为五年滑动平均时间序列 Fig.7 Interannual variation of snow cover derived from IMS (a), MODIS (b), the Northern Hemisphere (c) and the five-year moving average snow depth observed by the 50 stations over the Qinghai-Xizang (Tibetan) Plateau.For their time periods, and the dotted line is the time series of five-year moving average |