
1 引言
2 天气实况
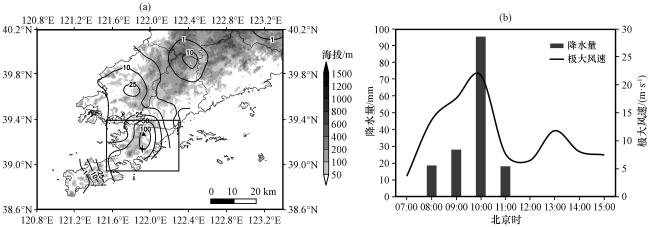
图1 2020年9月11日06:00 -15:00累计降水量(a, 单位: mm)分布, 得胜站降水量(直方图)和极大风速(黑色实线)随时间的演变(b)(a)中▲为向应站, “+”为得胜站, 黑色方框代表大连金州, 阴影区为地形海拔(单位: m) Fig.1 Cumulative rainfall distribution during 06:00 and 15:00 on 11 September 2020(a, unit: mm), time variations of rainfall at Desheng station(column diagram)and extreme wind speed(black solid line)(b).In Fig.1(a), ▲ denotes Xiangying station, +denotes Desheng station, the black rectangle denotes Dalian Jinzhou, the shaded area denotes the elevation of the terrain (unit: m) |
3 环流背景
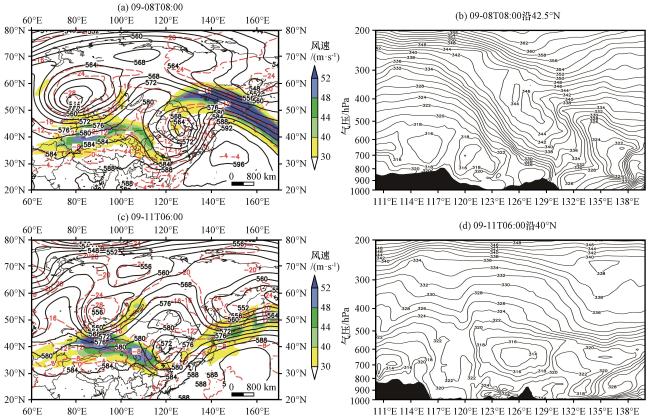
图3 500 hPa高度场(黑色实线, 单位: dagpm)、 温度场(红色虚线, 单位: ℃), 200 hPa风速(彩色区, 单位: m·s-1)(a, c)和相当位温(等值线, 单位: K)沿42.5°N(b)和40°N(d)的剖面(b)和(d)中黑色阴影为地形 Fig.3 500 hPa height field (black solid contour, unit: dagpm), temperature field (red dotted contour, unit: ℃), 200 hPa wind speed (colored area, unit: m·s-1) (a, c) and cross section of equivalent potential temperature (contour, unit: K)along 42.5°N (b) and 40°N (d) latitude.In Fig.3(b) and (d), the black shaded denotes the terrain |
4 对流演变及结构特征
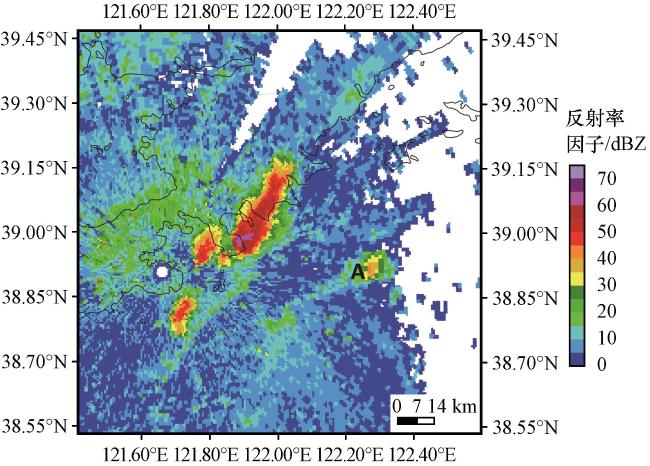
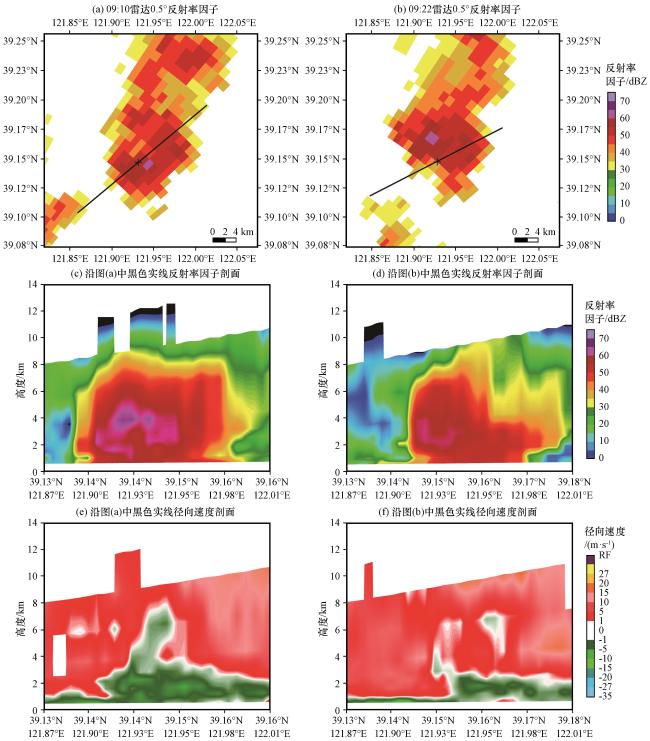
图5 2020年9月11日09:10和09:22大连多普勒天气雷达0.5°仰角反射率因子(a~b, 单位: dBZ)及其垂直剖面(c~d)以及径向速度剖面(e~f)(a~b)中黑色“+”表示大连金州得胜站 Fig.5 Base reflectivity (a~b, unit: dBZ) and the cross sections (c~d) of Dalian Doppler radar at 09:10 and 09:22 on 11 September 2020 at 0.5 elevation angle, and the cross section of radial velocity (e~f).In Fig.5(a~b), the black "+ "denotes Desheng station |
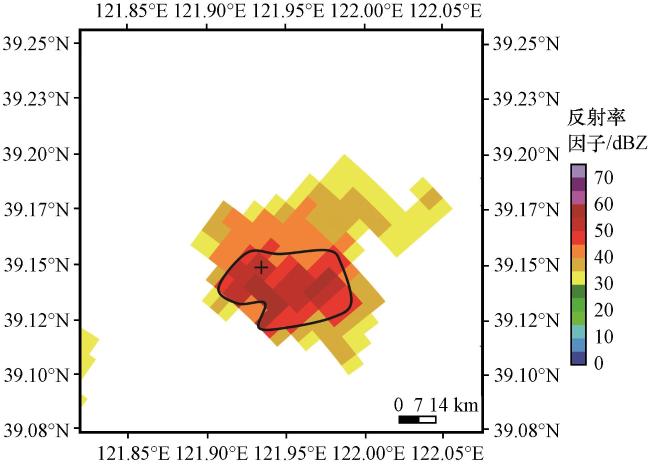
图6 2020年9月11日09:10大连多普勒天气雷达9.8°仰角反射率因子(单位: dBZ)黑色曲线表示超过45 dBZ反射率因子的轮廓, “+”表示大连金州得胜站 Fig.6 Base reflectivity of Dalian Doppler radar at 09:10 on 11 September 2020 at 9.8 elevation angle.Unit: dBZ.Black curved line indicates reflectivity outline larger than 45 dBZ, "+"denotes Desheng station |
5 对流发生发展环境分析
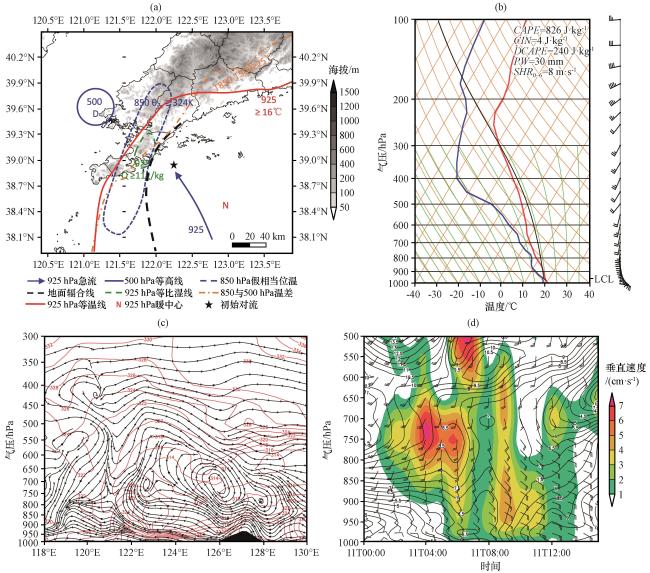
图7 基于ERA5再分析资料的动力和热力环境场分析(a)2020年9月11日06:00中尺度环境条件; (b)2020年9月11日06:00得胜站探空; (c)2020年9月11日07:00合成风流场(黑色流线)和假相当位温(红色等值线, 单位: K)沿39°N的剖面(黑色阴影为地形); (d)图(a)★处水平风(风向杆, 单位: m·s-1)、 水平风速(等值线, 单位: m·s-1)和垂直速度(彩色区, 单位: cm·s-1)随时间的变化 Fig.7 Dynamic and thermal environment field analysis diagram based on ERA5 reanalysis data.(a) mesoscale environmental conditions at 06:00 on 11 September 2020; (b) sounding at Desheng station at 06:00 on11 September 2020; (c) cross section of composite wind stream line (black stream) and potential pseudo-equivalent temperature (red contour, unit: K) along 39°N at 07:00 on 11 September 2020 (black shadow is terrain); (d) the variations of horizontal wind (wind bar, unit: m·s-1), horizontal wind speed(contour, unit: m·s-1) and vertical velocity (colored shaded area, unit: cm·s-1) with time in (a) at location ★ |
6 冷池对强对流天气的影响
6.1 试验方案及资料
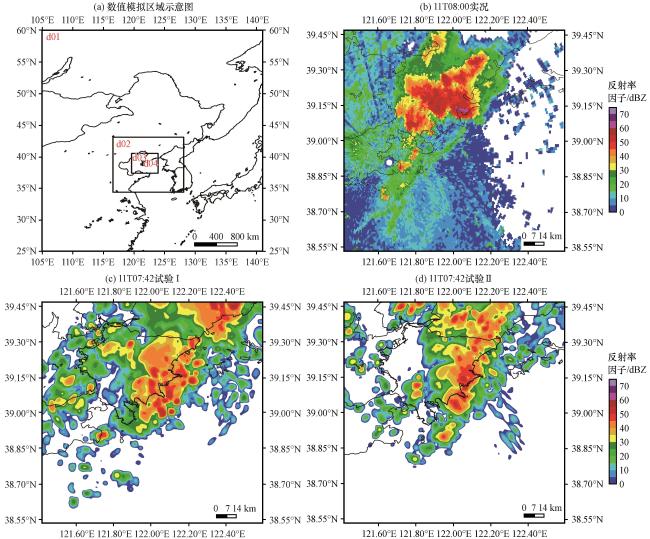
图9 四重嵌套天气数值模拟区域示意图(a)和11日08:00实况(b)、 11日07:42试验Ⅰ(c)和试验Ⅱ(d)的雷达组合反射率因子(单位: dBZ)Fig.9 Four nested weather numerical simulation regional schematic diagram (a), observations at 08:00 on 11 September 2020 (b), test Ⅰ (c) and test Ⅱ (d) of radar composite reflectivity at 07:42 on 11 September 2020.Unit: dBZ |