
1 引言
2 资料来源与方法介绍
2.1 资料来源
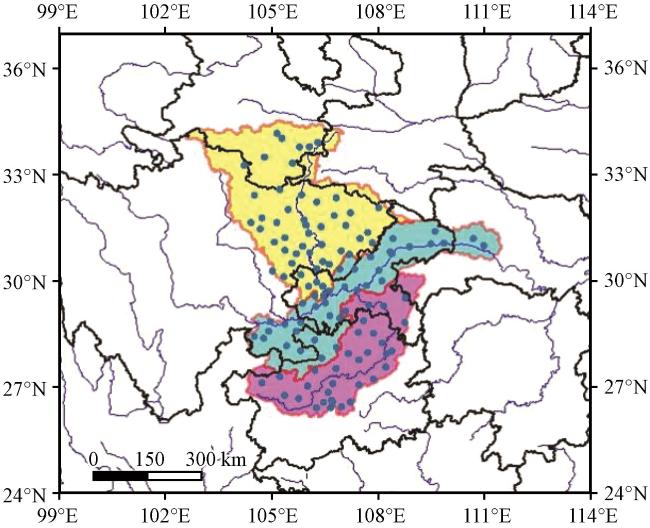
图1 重庆水电流域115个国家气象站分布黄色区域为嘉陵江流域, 蓝色区域为长江干流, 紫色区域为乌江流域, 蓝色线为河流, 黑色线为省界 Fig.1 The distribution of 115 meteorological observation stations in hydropower basins in Chongqing.The yellow area is the Jialing River basin, the blue area is the Yangtze River Basin.The purple area is the Wujiang River Basin.The blue line are rivers.The black line are the provincial boundaries |
2.2 方法介绍
3 重庆水电流域夏季降水模态及其变化
表1 各模态特征值及典型误差Table 1 Eigenvalues and standard deviation error of each modes |
| 第一模态 | 第二模态 | 第三模态 | 第四模态 | |
|---|---|---|---|---|
| 特征值 | 985.6 | 614.4 | 251 | 194 |
| 典型误差 | 199.8 | 134.1 | 54.8 | 42 |
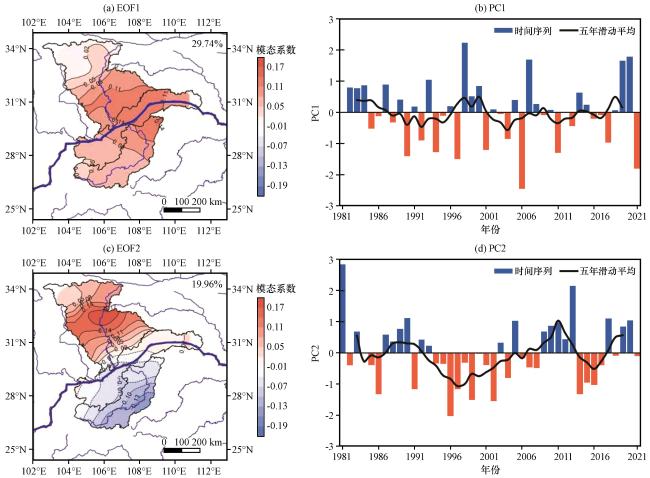
图2 重庆水电流域夏季降水EOF分解第一、 二模态空间场(a, c, 等值线和阴影)及其对应的时间序列(b, d)(a, c)中蓝色粗线为长江干流, 蓝色细线为支流; (b, d)中柱状图为时间系数, 实线为五年滑动平均 Fig.2 EOF1(a) and EOF2(b) modes of the summer rainfall in hydropower basins in Chongqing, and their associated time series PC1(c) and PC2 (d).The thick blue line in (a) and (c) are the main stream of Yangtze River, and the thin blue lines are tributaries.The bars in (b) and (d) are the PC1 and PC2, and the solid line is the PC five-year moving average |
4 第一模态降水分布成因分析及水汽输送特征
4.1 降水分布成因分析
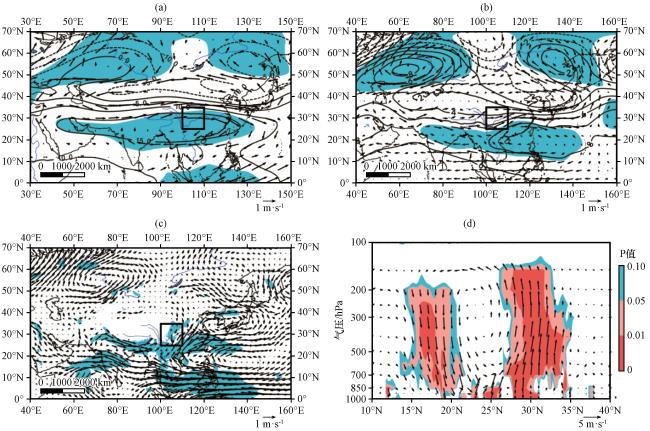
图3 第一模态PC1回归的200 hPa(a)、 500 hPa(b)高度场(等值线, 单位: gpm)和风场(矢量, 单位: m·s-1)与850 hPa风场(c, 单位: m·s-1), 以及典型涝年和旱年夏季沿100°E -110°E 平均的纬度-高度风场差值剖面(d, 垂直速度扩大了150倍, 单位: m·s-1)(a~d)中填色部分表示风场通过显著性检验的区域, 黑色方框为研究流域所在位置 Fig.3 Regression analysis of 200 hPa (a)、 500 hPa (b) height field (unit: gpm) and wind field (unit: m·s-1), and 850 hPa wind field (c, unit: m·s-1) by PC1 of the first mode, the difference of averaged meridional-vertical wind filed circulation over 100°E -110°E between typical flood year and typical drought year in summer(d, vertical velocity magnified 150 times, unit: m·s-1).The filled areas are the area where the wind field graph passed the significance test (a~d) and the black box shows the location of the study basin in (a~c) |
4.2 水汽输送特征
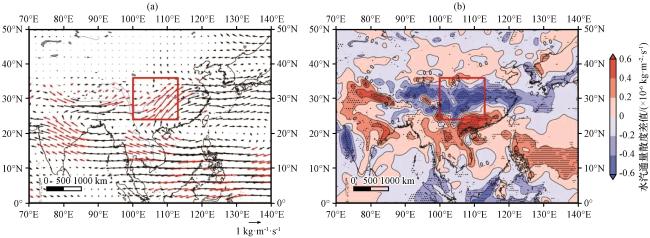
图4 典型涝年和旱年夏季整层积分水汽通量差值场(a, 单位: kg·m-1·s-1)和整层积分水汽通量散度差值场(b, 单位: ×10-6 kg·m-2·s-1)(a)中红色矢量和(b)中打点区域均表示通过95%的显著性检验, 红色方框为研究流域所在位置 Fig.4 The difference of the water vapor flux (a, unit: kg·m-1·s-1) and water vapor flux divergence (b, unit: ×10-6 kg·m-2·s-1) integrated from surface to 200 hPa between typical flood year and typical drought year.The red vectors in (a) and dotted area in (b) are indicate statistically at 95% significance level.The red box shows the location of the study basin |
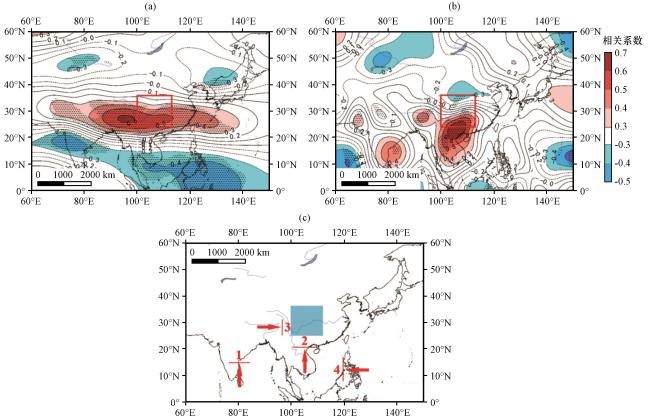
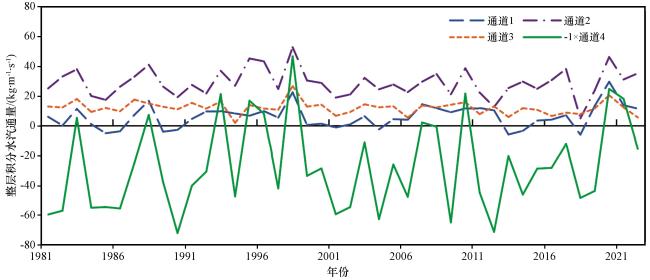
图5 PC1与水汽通量相关场纬向(a)和经向(b)相关系数分布以及主要水汽通道示意图(c)(a~b)中打点区域为相关系数通过95%的显著性检验; (a~b)中红色方框和(c)中蓝色阴影为研究流域所在位置, (c)中数字为四条水汽通道, 红色箭头代表水汽通道方向 Fig.5 The correlation distribution between PC1 and water vapor transport (a: zonal water vapor transport; b: meridional water vapor transport); Schematic diagram of the main water vapor channel(c).The shaded area indicate statistically at 95% significance level in (a) and (b).The red box in (a) (b) and the shade of blue in (c) show the location of the study basin.The numbers in (c) refers to four water vapor channels.The red arrow in (c) represents the direction of the water vapor channel |
表2 四条水汽通道相关性分析Table 2 Correlation analysis of four water vapor channels |
| 通道1 | 通道2 | 通道3 | -1×通道4 | |
|---|---|---|---|---|
| 通道1 | 1 | 0.62* | 0.51* | 0.28 |
| 通道2 | 1 | 0.36 | 0.89* | |
| 通道3 | 1 | 0.25 | ||
| -1×通道4 | 1 |
*为通过99%显著性水平检验(* indicate statistically at 95% significance level) |
5 第二模态降水分布成因分析及水汽输送特征
5.1 降水分布成因分析
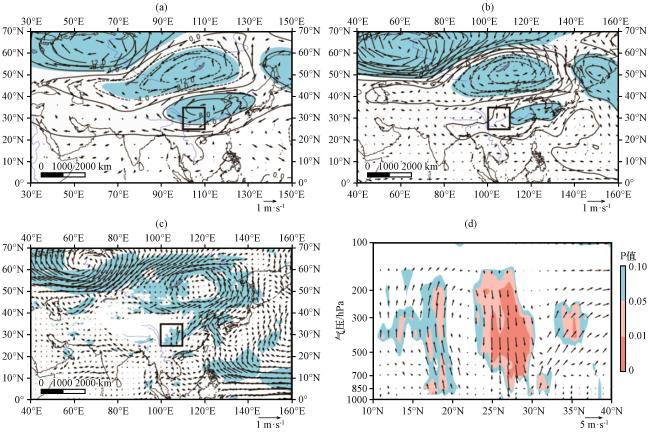
图7 第二模态PC2回归的200 hPa(a)、 500 hPa(b)高度场(等值线, 单位: gpm)和风场(矢量, 单位: m·s-1)与850 hPa风场(c, 单位: m·s-1), 以及典型北涝南旱年与南涝北旱年夏季沿100°E -110°E 平均的纬度-高度风场差值剖面(d, 垂直速度扩大了150倍, 单位: m·s-1)(a~d)中填色部分表示风场通过显著性检验的区域, 黑色方框为研究流域所在位置 Fig.7 Regression analysis of 200 hPa (a)、 500 hPa (b) height field (unit: gpm) and wind field (unit: m·s-1), and 850 hPa wind field (c, unit: m·s-1) by PC2 of the second mode, the difference of averaged meridional-vertical wind filed circulation over 100°E -110°E in summer between typical year of waterlogging in north and typical year of waterlogging in south (d, vertical velocity magnified 150 times, unit: m·s-1).The filled areas are the area where the wind field graph passed the significance test (a~d) in and the black box shows the location of the study basin in (a~c) |
5.2 水汽输送特征
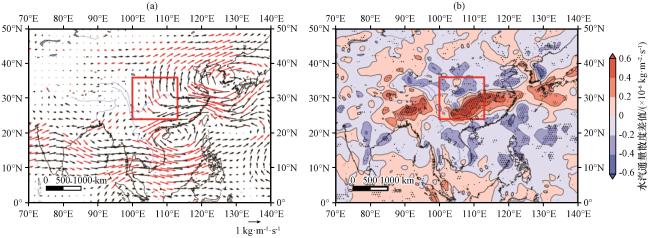
图8 典型北涝南旱年与南涝北旱年夏季整层积分水汽通量差值场(a, 单位: kg·m-1·s-1)和整层积分水汽通量散度差值场(b, 单位: ×10-6 kg·m-2·s-1)(a)中红色矢量和(b)中打点区域均表示通过95%的显著性检验, 红色方框为研究流域所在位置 Fig.8 The difference of the water vapor flux (a, unit: kg·m-1·s-1) and water vapor flux divergence (b, unit: ×10-6 kg·m-2·s-1) integrated from surface to 200 hPa between typical year of waterlogging in north and typical year of waterlogging in south.The red vectors in (a) and dotted area in (b) are indicate statistically at 95% significance level.The red box shows the location of the study basin |
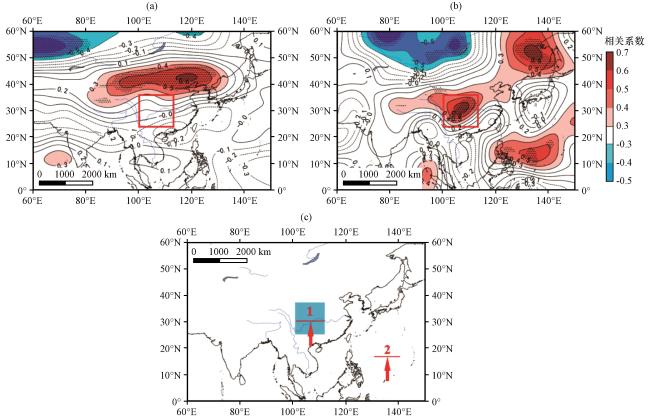
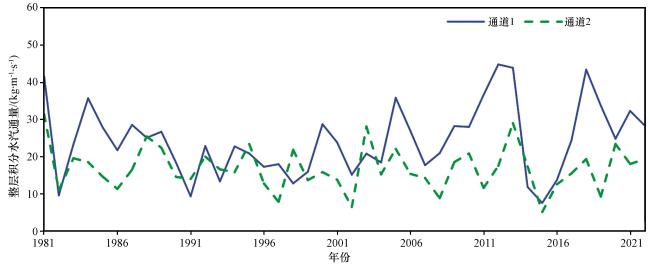
图9 PC2与水汽通量相关场纬向(a)和经向(b)相关系数分布以及主要水汽通道示意图(c)(a~b)中打点区域为相关系数通过95%的显著性检验; (a~b)中红色方框和(c)中蓝色阴影为研究流域所在位置, (c)中数字为两条水汽通道, 红色箭头代表水汽通道方向 Fig.9 The correlation distribution between PC2 and water vapor transport (a: zonal water vapor transport; b: meridional water vapor transport); Schematic diagram of the main water vapor channel (c).The shaded area indicate statistically at 95% significance level in (a) and (b).The red box in (a) (b) and the shade of blue in (c) show the location of the study basin.The numbers in (c) refers to two water vapor channels.The red arrow in (c) represents the direction of the water vapor channel |