
1 引言
2 资料选取及方法介绍
2.1 研究区及资料选取

2.2 方法介绍
2.2.1 高温天气过程定义
2.2.2 热量贡献估算方法
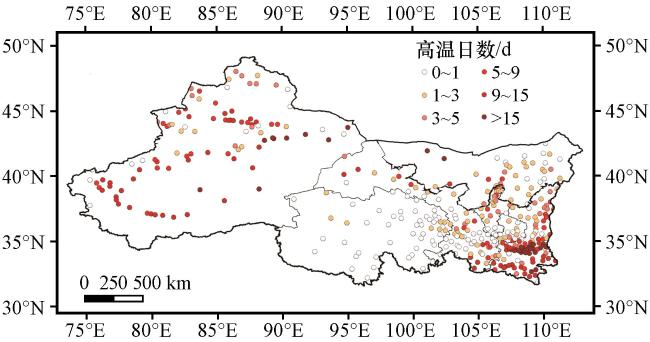
3 持续高温特征及极端性
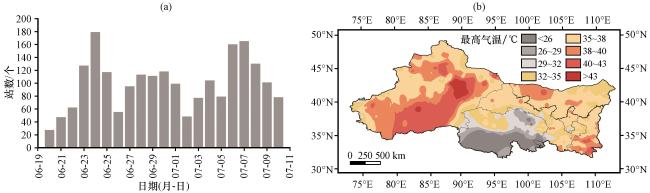
表1 2022年6月20日至7月10日西北区高温突破历史极值的站数及占比Table 1 The number and proportion of stations with high temperature exceeding the historical extreme value in northwest China from June 20 to July 10, 2022 |
| 区域 | 突破极值 站数/个 | 总站数 /个 | 百分比 /% |
|---|---|---|---|
| 西北区 | 108 | 389 | 28 |
| 青藏高原高寒气候区 | 47 | 68 | 69 |
| 温带大陆性气候区 | 21 | 125 | 17 |
| 温带季风气候区 | 22 | 155 | 14 |
| 亚热带季风气候区 | 18 | 41 | 44 |
4 异常大气环流特征
4.1 南亚高压异常
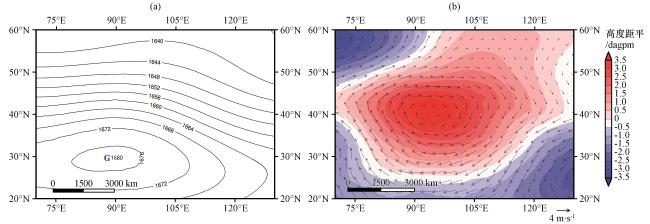
图4 2022年6月20日至7月10日 100 hPa 高度场(等值线, 单位: dagpm)分布(a)及高度距平场(彩色区, 单位: dagpm)和风场距平(矢量, 单位: m·s-1)分布(b)Fig.4 The distribution of the South Asian High (a, contour, unit: dagpm), height field anomaly (color area, unit: dagpm) and wind field anomaly (vector, unit: m·s-1) (b) at 100 hPa from 20 June to 10 July 2022 |
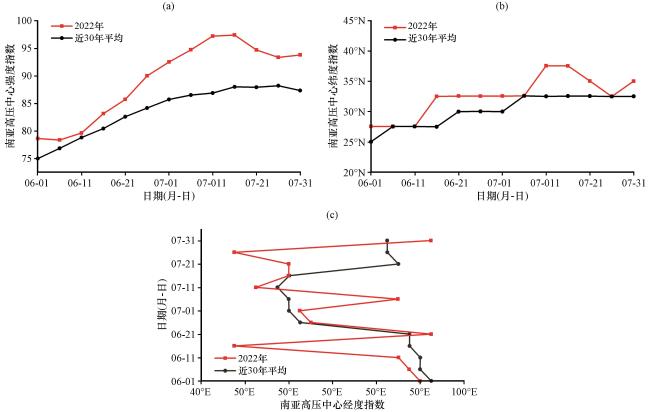
图5 2022年6月20日至7月10日南亚高压中心强度指数(a)、中心纬度指数(b)、中心经度指数(c)逐候变化(黑色)及与同时期历史平均态(红色)的对比Fig.5 Seasonal variation (black line) of the central intensity (a), central latitude (b), and central longitude (c) of the South Asian High from 20 June to 10 July 2022 and comparison with the historical average (red line) of the same period |
4.2 大陆高压异常
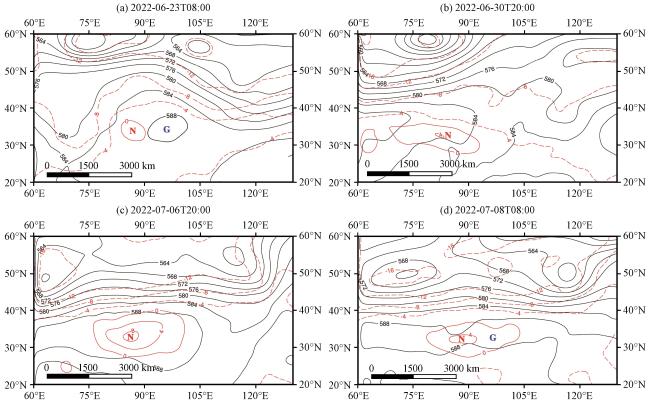
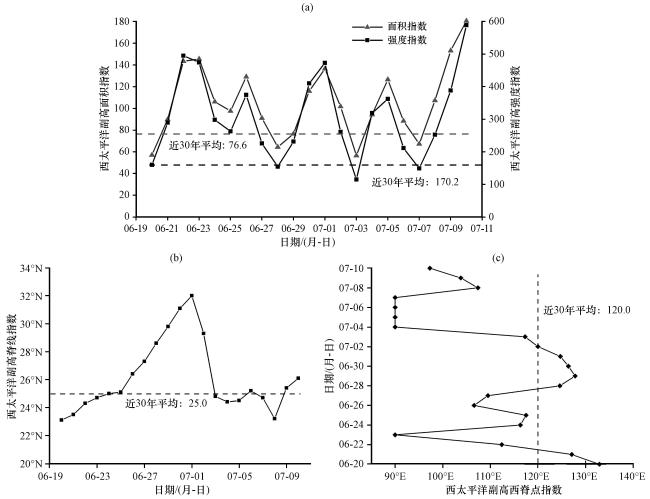
图7 2022年6月20日至7月10日西太副高强度和面积(a)、脊线(b)、西脊点(c)指数逐日变化(实线)及与同时期历史平均态(虚线)的对比Fig.7 The daily variation (solid line) of the intensity and area (a), ridge line (b), and western ridge point (c) indexes of the western Pacific subtropical high from June 20 to July 10, 2022 and the comparison with the historical average (dashed line) of the same period |
4.3 特征物理量场异常特征
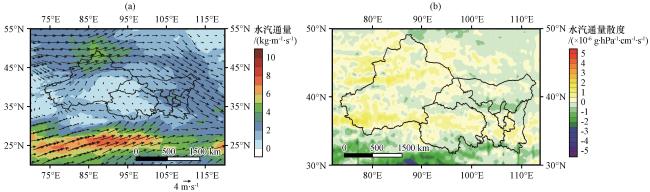
图8 2022年6月20日至7月10日700 hPa平均水汽通量(填色, 单位: kg·m-1·s-1)和风场(矢量, 单位: m·s-1)(a)及水汽通量散度(b, 单位: ×10-6 ·g·hPa-1·cm-1·s-1, 正、负分别表示辐散、辐合)Fig.8 700 hPa average water vapor flux (color area, unit: kg·m-1·s-1) and wind field (vector, unit: m·s-1) (a) and water vapor flux divergence (b, unit: ×10-6 ·g·hPa-1·cm-1·s-1, positive and negative respectively indicate divergence and convergence) from 20 June to 10 July 2022 |
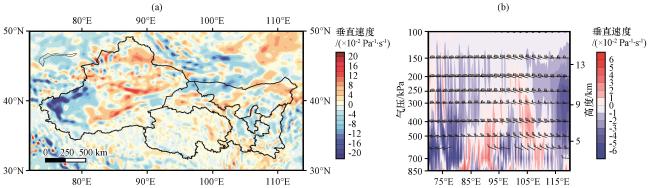
图9 2022年6月20日至7月10日700 hPa垂直速度距平场(a, 单位: ×10-2 Pa-1·s-1)及沿37.5°N -40°N 2022年6月20日至7月10日垂直速度(彩色区, 单位: ×10-2 Pa-1·s-1)和风场(风羽, 单位: m·s-1)高度-经度剖面(b)Fig.9 700 hPa vertical velocity anomaly field (a, unit: ×10-2 Pa-1·s-1) and vertical velocity (color area, unit: ×10-2 Pa-1·s-1) and wind field (barb, unit: m·s-1) height-length profile along 37.5°N -40°N (b) from 20 June to 10 July 2022 |
5 动力和热力贡献定量估计
5.1 温度平流项
5.2 垂直输送项
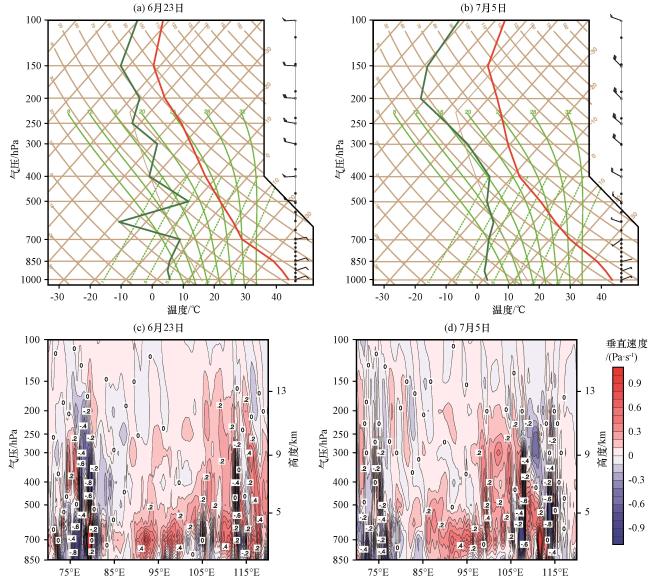
图11 2022年6月23日14:00和7月5日14:00 T-lnP图(a, b)和垂直速度剖面(c, d, 单位: Pa·s-1)图(a)、(b)中红色线为温度, 深绿色线为露点温度 Fig.11 T-lnP diagram (a, b) and vertical velocity profile (c, d, unit: Pa · s-1) at 14:00 on 23 June and 14:00 on 5 July 2022.In Fig.11 (a) and (b), the red line is temperature, dark green line is dew point |