
1 引言
地面温度(2 m temperature above ground, T2m)预报是最基础的气象预报业务之一, 在城乡居民生活、 工农业生产等各方面有重要意义(代刊等, 2016; 闫之辉等, 2010), 也是群众最关心的天气要素之一(叶培龙等, 2019)。随着社会要求的不断提高, 人们不再满足于获得24 h之内的最高最低气温预报, 逐小时、 甚至是分钟级的温度预报也变得日益重要(闫昕旸等, 2018; 周述学等, 2020)。
近年来, 随着数值预报技术的快速发展, T2m预报的时空分辨率有着显著的进步, 预报准确率也有明显提高(沈学顺等, 2020; 韦青等, 2020), 但仍然无法完全满足社会对天气预报的需求, 预报失误时有发生。因此对数值模式直接输出的常规要素进行客观预报订正, 是提高常规要素预报质量的有效手段之一。目前常用的温度预报客观订正方法有三大类。第一类是直接对一种或多种数值预报温度产品进行订正, 其中基于滑动窗(吴启树等, 2016; 郝翠等, 2019; 薛谌彬等, 2019)和递减平均技术(王丹等, 2019; 肖瑶等, 2019), 是目前最常用的温度订正技术之一。这两种方法充分考虑了过去一段时间数值预报的误差变化趋势, 通过构造滞后平均误差、 权重系统和最优权重系数, 减少模式中的系统性误差, 从而提高温度预报准确率。这两种方法不仅适用性好, 准确率高, 还较容易拓展。例如郝翠等(2019)对EC(European Centre for Medium-Range Weather Forecasts, EC)资料进行最优集合后再进行滑动训练, 对北京市站点1~7天的最高、 最低气温进行了订正。盛春岩等(2020)通过将EC温度预报、 滑动偏差订正后的结果与MOS(Model Output Statistic Method)预报结果进行集成, 在多种客观预报产品的基础上再次提高预报准确率。赵滨和张博(2018)参考月预报误差剔除模式系统性误差, 再采用三维插值方法进行地形订正, 对陕西逐日温度预报进行了改进。第二类是基于格点温度预报的改进, 主要将欧洲中期天气预报中心预报(潘留杰等, 2017; 金巍等, 2020)、 国产CMA(China Meteorological Administration, 中国气象局)预报(张玉涛等, 2020; 何珊珊等, 2021)、 国家级智能网格指导预报(SCMOC, 王丹等, 2021)、 CMA陆面数据同化系统CLDAS(Chinese Land Data Assimilation System)等多种格点资料进行融合后, 再通过回归方法训练并分析滑动误差(曾晓青等, 2019)。也有利用温度垂直高度差异对高分辨率数值预报产品进行订正的研究(夏凡等, 2018; 智协飞等, 2019), 对提高温度预报的精细化有重要意义。第三类是基于人工智能技术的温度预报技术。既有采用极度梯度提升决策树(eXtreme Gradient Boosting, XGBoost)(任萍等, 2020)、 LightGBM(Light Gradient Boosting Machine)(谭江红等, 2018)、 随机森林等(王可心等, 2021)机器学习方法开展站点温度预报并取得较好预报效果的方法, 也有基于深度学习的T2m网格预报方法, 其中马景奕等(2021)利用长短时记忆深度学习方法(Long Short-Term Memory, LSTM)进行站点气温预测, 通过与其他经典机器学习方法对比验证了该方法在气象预测中的有效性。Han et al(2021)提出了基于U-net语义分割模型改进的CU-net(Correction U-net)卷积神经网络订正模型, 有效地提高了欧洲中期天气预报中心集合预报(European Centre for Medium-Range Weather Forecasts Integrated Forecasting System, ECMWF-IFS)24~240 h准确率。张延彪等(2022)在CU-net模型中引入稠密卷积模块形成数值预报要素偏差订正模型(Dense-CUnet), 对EC预报结果有较大改善。
虽然这些方法对T2m预报做了很好的订正, 但仍然存在一些问题。前两类方法往往是通过对多模式、 多成员进行集成, 再采用滑动窗、 递减平均、 回归等数学方法减小误差。但在集成过程中, 预报效果较好的模式产品(如EC)往往会获得较大权重, 而预报效果相对较差或预报效果不是非常稳定的模式产品权重则相对较小甚至为0, 造成客观方法过分依赖EC模式, 不利于国产CMA数值模式尤其是中尺度数值模式的应用。此外, 滑动窗、 递减平均、 回归等传统统计方法仍然相对简单, 例如滑动窗一般只考虑30 天之内的误差, 时间太长不仅会增加计算资源, 而且可能会引发误差不稳定(尹姗等, 2020), 且30天之内的系统误差不能完全代表该模式的全部系统误差。第三类方法通过人工智能技术, 可以有效获取数值模式的系统误差特征, 从而对温度预报进行有效订正, 但该类方法最大的问题是比较依赖数据量的大小, 即有效学习样本数量的多少。当样本较少时, 训练结果存在过拟合和欠拟合的风险(Alon et al, 2009; Zhang et al, 2018)。
国内CMA数值模式近年来取得明显进步, 与国际先进模式的差距在快速减小(谌芸等, 2021; 王彩霞等, 2022), 但数值模式内核的频繁更新, 客观上造成国产模式的系统误差变化相对较为剧烈; 同时部分国产数值模式业务运行时间尚短[如中国气象局上海快速更新循环数值预报(CMA-SH3)从2018年底才通过中国气象局业务准入, 2020年才逐渐稳定], 这造成有相似误差的数值预报产品时间序列也较短。最终表现为采用常规CMA数值预报模式进行深度学习建模时可用样本数少, 很难学习到系统误差特征, 产品预报性能较差。这个现状阻碍了研发人员对国产模式的进一步应用, 也是近期大多数相关研究仍然是利用深度学习开展基于EC预报或再分析产品的订正(陈鹤等, 2022), 基于CMA数值模式的地面温度预报研究较少的主要原因。如果国产数值模式在较短时期内能有较多的预报样本, 既可以满足深度学习模型对学习样本量要求, 也可以尽量减少由于模式内核大幅度更新造成的系统误差变化, 是有可能对国产数值模式产品进行订正的。满足这个要求的数值模式包括预报次数较多的快速更新循环同化系统(如CMA-SH3)和成员数较多的集合预报(如CMA Regional Ensemble Prediction System, CMA-REPS)等。文中采用深度学习模型对CMA-SH3模式的T2m温度进行订正和检验, 结果表明即使CMA-SH3自身预报性能要差, 但在数据样本足够多之后, 深度学习仍然能够学习系统误差特征并进行订正, 显著提高CMA-SH3的T2m预报性能, 这对充分利用国产模式资源, 更广泛地开展国产模式的后处理和应用提出了一个新的思路。
2 数据来源和方法介绍
2.1 数据来源和研究区域
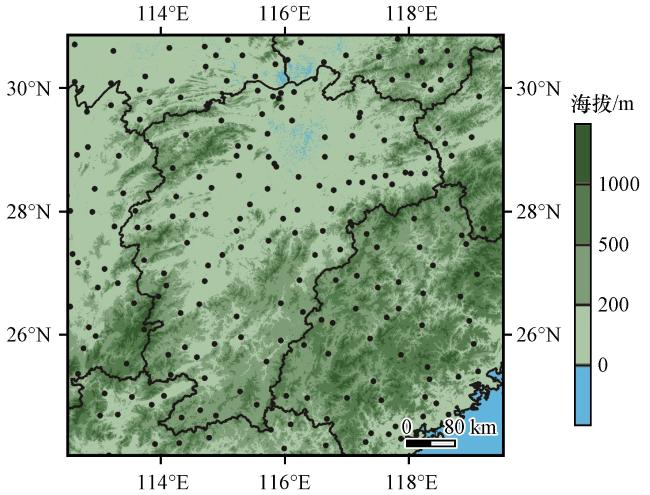
模型采用的高分辨率数值预报模式为CMA-SH3, 每天制作发布24次预报, 水平空间分辨率为3 km, 时间分辨率为1 h, 预报时效为24 h(陈葆德等, 2013); 采用的实况网格产品来源于CLDAS, 其水平空间分辨率为0.05°, 时间分辨率为1 h, 该数据是目前省级气象部门唯一拥有较长时间序列的实况融合网格产品(齐铎等, 2020; 董春卿等, 2021)。为使模式产品和CLDAS产品在空间分布上保持一致, 采用双线性插值法将CMA-SH3的T2m预报数据插值至0.05°的水平网格上。将2022年中国气象局下发的219个国家地面气象观测站逐小时T2m观测数据, 在经过要素范围、 时间一致性和综合判断等方法进行质控后作为T2m真值, 用来评估检验CMA-SH3和利用深度学习订正后的T2m预报产品的误差。文中研究区域(24.15°N -30.50°N, 112.75°E -119.10°E)包括江西及周边省份部分区域, 水平空间分辨率为0.05°, 格点数为128×128。研究区域地形分布复杂多样, 北部多为平原、 湖泊和盆地, 南部多丘陵、 山地(图1)。文中涉及地图是基于中华人民共和国自然资源部地图技术审查中心标准地图服务系统下载的审图号为GS(2017)3320号的中国地图制作, 底图无修改。
2.2 研究方法
深度学习擅长以图像的方式处理数据, 被广泛应用在云图识别、 短临降水、 数值模式订正等气象领域。Han et al(2021)将气象格点数据看成图像像素点数据, 基于经典语义分割模型U-net, 成功建立了一种适合气象要素网格预报订正的CU-net模型。张延彪等(2022)在Han et al(2021)的基础上增加了几个关联气象要素, 但仍然只有一个时刻的要素值。这些模型仅使用起报时刻的实况数据进行训练, 对24 h温度预报是非常有效的, 但如果预报的时间分辨率精确到逐小时并进行滚动预报后, 该方案就略显粗糙: 由于忽略了前几个时次T2m实况对未来变化的影响, 小时温度预报误差较大。文中在CU-net基础上, 将单时次T2m实况与预报数据相融合改为多时次T2m实况与预报数据相融合, 构建成多时间序列的MT-Cunet(Multi-time CU-net)深度学习模型。
常规数值模式一天发布2次预报, 起报时间为08:00(北京时, 下同)和20:00。一年内对某时效的预报数据仅有730次(2次/天×365天), 远不能满足深度学习需要。而CMA-SH3等快速更新循环系统每天能发布24次预报, 对某时效的预报数据有8760次(24次/天×365天), 相当于常规数值模式12年的数据量, 可以满足深度学习的需要, 且误差没有明显变化。为验证这个观点, 在其他参数条件完全一致的情况下, 仅挑选CMA-SH3在08:00、 20:00起报的数据制作模型训练数据, 再利用24个时效起报的数据制作T2m数据集并分别加以训练, 测试结果发现前者在第一个预报时次的MAE比后者增加了146.5%, 其他预报时效的误差也有明显增加, 订正能力大幅度下降。因此利用快速更新循环同化数值模式可以解决利用常规数值预报建模数据过少的弊端。
2.2.1 模型数据预处理
一般来说, 样本数量越多, 越有利于深度学习模型在训练过程中学习到有用的特征信息, 从而做出更准确的预报; 但如果模型的训练样本与预测样本存在较大差异, 提取到的特征不一定能反映预测样本, 反而容易造成模型泛化能力下降, 因此训练样本的误差差异不能过大。CMA-SH3虽然从2019年开始业务下发完整的预报数据, 但该年T2m的MAE与其他年份有明显差异。经过实验, 加入2019年数据后, 模型泛化性能反而会出现显著下降。因此, 文中将 2020年1月至2021年9月数据作为训练集, 2021年10 -12月数据为验证集, 2022年1 -3月数据为测试集, 大致遵循8∶1∶1比例分配方式。由于CMA-SH3模式数据有少量缺失, 各时次订正模型训练数据集的样本数量略有不同, 具体详见表1。模型于2022年4月在江西省气象台进行了实时业务运行, 文中截取2022年4 -12月的数据进行补充检验, 以定量地表征模型全年的订正效果。
表1 各预报时效训练集、 验证集和测试集的样本数量Table 1 Number of samples in the training, validation, and test datasets for each forecast time |
| 预报 时效 /h | 训练集样本/个 2020/01/01 - 2021/6/31 | 验证集样本/个 2021/07/01 - 2021/12/31 | 测试集样本/个 2022/01/01 - 2022/03/31 |
|---|---|---|---|
| 3 | 13637 | 2084 | 2087 |
| 4 | 13627 | 2084 | 2085 |
| 5 | 13615 | 2084 | 2086 |
| 6 | 13605 | 2084 | 2083 |
| 7 | 13609 | 2084 | 2083 |
| 8 | 13606 | 2084 | 2082 |
| 9 | 13602 | 2084 | 2082 |
| 10 | 13597 | 2084 | 2082 |
| 11 | 13586 | 2084 | 2082 |
| 12 | 13582 | 2084 | 2082 |
| 13 | 13581 | 2084 | 2082 |
| 14 | 13570 | 2083 | 2082 |
| 15 | 13567 | 2083 | 2082 |
| 16 | 13564 | 2082 | 2082 |
| 17 | 13561 | 2082 | 2082 |
| 18 | 13556 | 2081 | 2080 |
| 19 | 13555 | 2081 | 2081 |
| 20 | 13550 | 2080 | 2080 |
| 21 | 13545 | 2080 | 2080 |
| 22 | 13540 | 2080 | 2080 |
| 23 | 13531 | 2080 | 2081 |
| 24 | 13523 | 2080 | 2081 |
CMA-SH3产品在业务中存在2 h滞后。以08:00起报为例, 其预报产品要在10:00后才能下发, 此时其1 h、 2 h时效预报已经失效, 首个可用预报时效为3 h。因此文中的MT-Cunet模型仅能对3~24 h这22个时效的T2m预报进行订正, 为了与CMA-SH3的预报时效匹配以方便对比检验, 预报产品也称为3~24 h时效预报。对MT-Cunet模型来说, 10:00 CLDAS的T2m数据是最新时刻的实况, 记为时刻T; 09:00、 07:00和04:00 CLDAS的T2m数据作为过去时刻的实况, 分别记为时刻T-1、 T-3和T-6, 以此类推。11:00到次日08:00 CLDAS的T2m作为Label加入数据集进行训练, 按照与时刻T的关系, 将Label时刻记为T+1、 T+2、 ……、 T+22。
经过多次测试发现, 当选取时刻T、 T-1、 T-3、 T-6时, 模型在计算时间和预报性能达到一个较好的平衡, 且能保证模型的泛化性能。因此本工作中将时刻T、 T-1、 T-3、 T-6的T2m数据当成实况因子, 将CMA-SH3的3~24 h时效预报分别当成各时刻的预报因子, T+1、 ……、 T+22分别当成22个预报时效的Label, 通过模型训练后得到3~24 h时效的深度学习订正模型, 分别对CMA-SH3的3~24 h时效的T2m预报进行订正。
2.2.2 模型架构
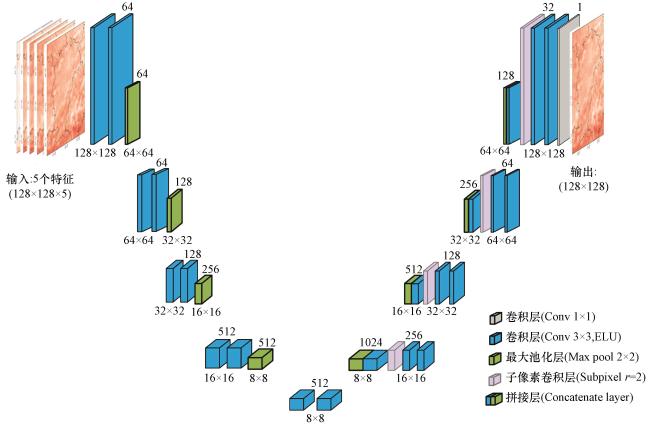
与CU-net全卷积神经网络架构类似, MT-Cunet深度学习模型也由编码(Encoder)和解码(Decoder)两部分组成(图2)。编码主要负责要素输入、 特征提取和图像降维, 包括卷积层和池化层; 解码主要负责拼接和上采样, 包括拼接层、 卷积层和子像素卷积层(subpixel convolution)。以搭建3 h的深度学习预报模型为例, 首先, 将4个时刻的T2m实况因子和3 h的CMA-SH3预报因子融合成5通道数据集, 格点数为128×128×5, 顺序为T-6、 T-3、 T-1、 T和3 h预报。其次, 将数据集原始数据经过4次下采样(down sampling)操作, 进行深度特征提取。每个下采样操作包含1个步长为2的池化层, 其中4次下采样卷积过程中的卷积核数量分别为64、 128、 256和512, 卷积核大小为3×3。当下采样操作完成后, 原始数据维度变为8×8×512。在解码部分, MT-Cunet在进行2次卷积操作后(卷积核数量为512), 再通过4次上采样(up sampling)操作, 将特征通道逐步恢复为原始数据大小。文中的上采样操作包含1个拼接层和1个子像素卷积层和2个卷积层, 其中拼接层的目的是尽量减少卷积过程中的信息损耗, 子像素层卷积的目的是通过减少通道数量从而增加通道的分辨率, 其中缩减比例r设为2, 即通道数量减少4倍, 格点数也相应增大4倍(Shi et al, 2016); 卷积过程中的卷积核数量分别为256、 128、 64和32, 卷积核大小也为3×3。上采样操作完成后, 数据维度成为128×128×32, 再利用1个1×1的卷积核进行卷积输出。由于MT-Cunet模型用于回归预测, 因此卷积输出层不设置激活函数。最终得到128×128×1大小的网格数据, 也就是订正后的T2m预报产品。整个MT-Cunet模型架构由19个卷积层、 4个池化层、 4个拼接层和4个子像素卷积层组成, 总计31层。卷积训练层均采用指数线性单元ELU(Exponential Linear Unit)激活函数, 该激活函数可有效缓解模型训练过程梯度消失和梯度爆炸问题, 相较于ReLU(Rectified Linear Unit)激活函数及其变体, ELU具备有效减少训练时间和模型泛化性能更佳的优势(Terada and Hirose, 2020)。
2.2.3 模型参数
深度学习模型训练设置200个迭代周期(Epoch)。批量大小设为32(Batch-size), 每个训练周期迭代次数约为426。损失函数使用均方差(MSE)。训练过程中, 采用Adam优化器, 初始训练学习率设置为10-4, 采用指数调度优化方法降低学习率, 即每60个迭代周期递减10倍学习率, 避免模型训练发散或陷入局部最优解(Senior et al, 2013), 其余设置则为默认值。模型基于TensorFlow 2.6进行编译训练, 并使用NVIDIA Tesla V100S 32GB 图形处理器(GPU) 进行运算加速。
2.2.4 检验方法
当前温度实况有两种表现形式, 第一种是站点实时观测数据, 数据较准但覆盖面有限; 另一种是网格数据, CLDAS就是这种产品之一, 虽然覆盖面很广, 提供了一个很好的网格实况温度, 但在高海拔地区等复杂地形下存在一定的误差(韩帅等, 2018; 贺倩等, 2022; 杨富燕等, 2023)。文中采用双线性插值方法将研究区域内的CMA-SH3和MT-Cunet温度预报网格数据插值到219个国家气象观测站上(图1), 并与国家站整点实时的T2m观测进行对比, 计算预报与观测之间的偏差。避免了CLDAS的同化误差, 也会导致MT-Cunet误差略偏大。评估指标为平均误差(ME)、 平均绝对误差(MAE)和均方根误差(RMSE), 具体计算公式如下:
式中: 式中 为模式和客观产品预报值; 是与之对应的观测值。
3 结果检验分析
3.1 全年预报结果检验
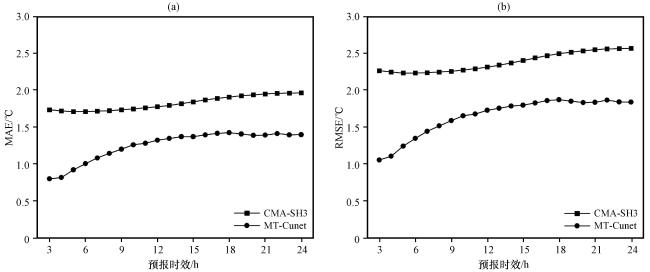
从2022年1 -12月CMA-SH3和MT-Cunet两种T2m预报产品的检验结果(图3)可以看到, CMA-SH3所有预报时效的MAE均超过1.7 ℃, RMSE均超过2.2 ℃, 最小值出现在6 h时效预报中, MAE和RMSE分别为1.71 ℃、 2.23 ℃; 最大值出现在24 h时效预报中, 分别为1.96 ℃和2.56 ℃, 预报误差呈现随预报时效增加而增加的趋势。MT-Cunet的误差在不同预报时效中有较大差异, 其中最小值出现在3 h时效预报中, MAE和RMSE为0.80 ℃、 1.05 ℃; 最大值出现在18 h时效预报中, 分别为1.42 ℃、 1.87 ℃。3~9 h时效的订正效果较好, 平均MAE和平均RMSE分别降低42.4%、 40.89%; 10~24 h时效的订正效果有所下降, 平均MAE和平均RMSE分别下降26.7%、 26.3%。
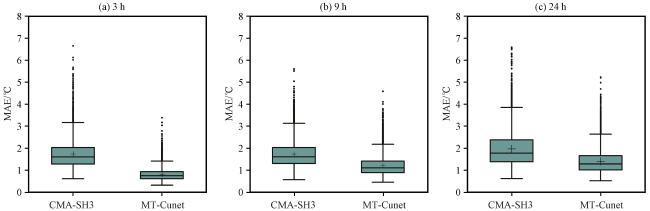
如果T2m预报产品的MAE整体相对较低, 但离散度较大, 也不利于业务应用, 因此有必要对产品的MAE分布范围进行统计。由于时效较多, 文中以3、 9、 24 h时效的分布情况举例说明。图4可以看出, MT-Cunet有效地降低了CMA-SH3的误差和离散度。从3 h时效的MAE分布来看[图4(a)], CMA-SH3的MAE中位值、 平均值分别为1.59 ℃和1.73 ℃, 误差和离散度均表现较大; MT-Cunet订正后的MAE中位值、 平均值分别为0.75 ℃和0.80 ℃, 误差和离散度较小。与3 h时效类似, 9 h时效[图4(b)] CMA-SH3的MAE中位数、 平均值为最大, 分别为1.60 ℃和1.73 ℃。MT-Cunet的中位数值、 平均值均比CMA-SH3要小, 但总体相较3 h略有上升, 表明MAE离散度有所增加。到24 h时效[图4(c)], CMA-SH3的MAE中位数和平均值达到最大, MT-Cunet与之类似, 但中位数、 平均值要明显小于CMA-SH3。
3.2 预报误差月变化特征
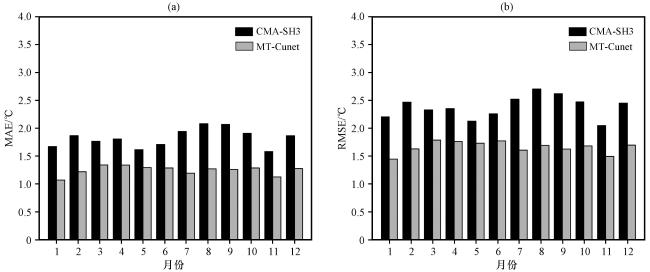
如图5所示, CMA-SH3在2022年各月的MAE和RMSE均明显偏高, 其中最大值分别为2.08 ℃、 2.71 ℃, 均出现在8月; 最小值分别为1.62 ℃、 2.13 ℃, 均出现在5月。MT-Cunet表现较好, MAE和RMSE最大值分别为1.34 ℃、 1.79 ℃, 均出现在3月; 最小值分别为1.07 ℃、 1.45 ℃, 均出现在1月。与CMA-SH3的逐月MAE相比, MT-Cunet的MAE和RMSE最大降幅月份出现在9月, 降幅分别为39.1%、 37.8%; 最低降幅月份出现在5月, 降幅分别为19.9%、 18.5%。
3.3 预报误差日变化特征
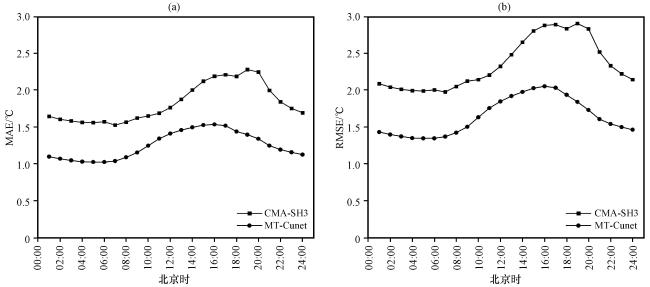
对每个时刻全年所有站点CMA-SH3和MT-Cunet的T2m预报产品进行检验评估, 结果表明两个T2m预报产品同观测温度之间的MAE、 RMSE均存在明显的单峰日变化特征(图6)。CMA-SH3的MAE、 RMSE最大值均出现在18:00, 分别为2.28 ℃和2.91 ℃; 最小值均出现在04:00, 分别为1.56 ℃和1.99 ℃; MT-Cune的MAE、 RMSE最大值均出现在15:00, 分别为1.53 ℃和2.06 ℃; 最小值均出现在05:00, 分别为1.02 ℃和1.35 ℃。
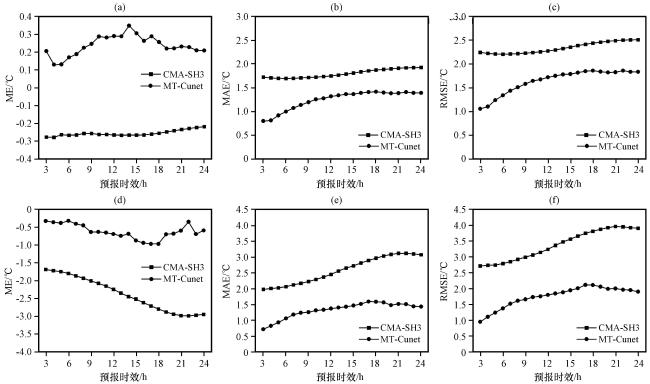
为判断CMA-SH3和MT-Cunet对低温(≤0 ℃)、 高温(≥35 ℃)事件的预报能力, 文中以ME、 MAE和RMSE等误差评价指标进行评估检验, 如图7所示。CMA-SH3在高温事件所有预报时效ME为-2.98~-1.68 ℃, 具有明显的负偏差, 对于高温预报偏低; MAE和RMSE最小值出现在3 h时效, 分别为1.98 ℃、 2.71 ℃, 最大值出现在21 h时效, 分别为3.12 ℃、 3.96 ℃, 预报误差随预报时效增加而上升的趋势。MT-Cunet在高温事件所有预报时效ME与CMA-SH3相反, 表现一致的正偏差, 高温存在预报偏高的现象; MAE和RMSE与CMA-SH3趋势一致, 其中MAE和RMSE最小值出现在3 h时效, 分别为0.72 ℃、 0.95 ℃, 最大值出现在17 h时效, 分别为1.59 ℃、 2.12 ℃。低温事件中, CMA-SH3和MT-Cunet均表现出明显的负偏差, 其中CMA-SH3偏差远大于MT-Cunet, 说明MT-Cunet模型对低温有较好的偏差订正作用, 但仍存在低温预报偏低的现象。CMA-SH3的MAE和RMSE最大值出现在24 h时效, 分别为1.93 ℃、 2.51 ℃; 最小值出现在6 h时效, 分别为1.70 ℃、 2.21 ℃; MT-Cunet的MAE和RMSE最小值均出现在3 h时效, 分别为0.80 ℃、 1.06 ℃; 最大值出现在18 h时效, 分别为1.42 ℃、 1.86 ℃。
3.4 预报误差空间分布特征
CMA-SH3的T2m预报误差空间分布有较明显的地形特征, 主要表现在平原、 河谷地区的误差较小, 丘陵、 山区的误差较大。CMA-SH3模式中, 江西北部鄱阳湖地区, 福建沿海平原地区、 湖北东部、 安徽南部的长江中下游部分站点的MAE为1.0~1.5 ℃, RMSE则为1.5~2.0 ℃; 而较高海拔山区站点的MAE和RMSE普遍超过了2.0 ℃, 安徽省黄山风景区站(118.15°E, 30.13°N)的MAE、 RMSE分别为3.8 ℃、 4.3 ℃, 预报效果较差。丘陵山区站点的MAE和RMSE也普遍在1.5~2.5 ℃[图8(a, c)]。
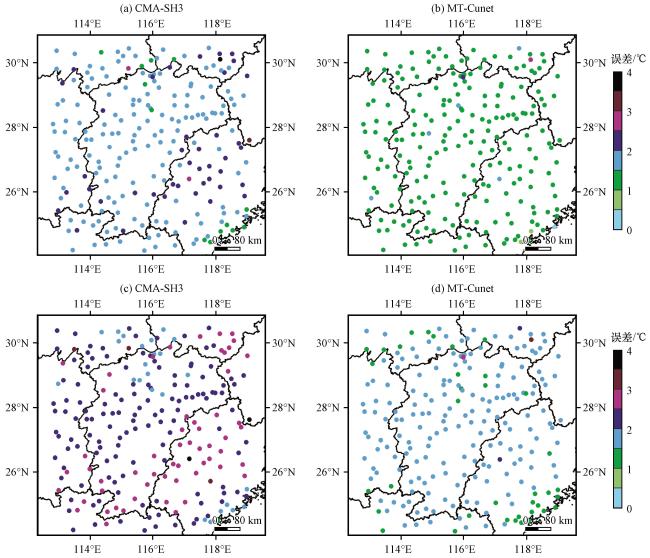
从MT-Cunet的误差空间分布特征可以看到[图8(b), (d)], 研究区域大部分站点的MAE为1.0~1.5 ℃, RMSE为1.5~2.0 ℃, 其中, 江西和安徽两省南部、 福建省、 广东省北部等地区的误差显著减小。这表明该模型能较大程度减少地形对T2m预报结果的影响, 使订正后的T2m预报性能有较大的提升。MT-Cunet的T2m预报效果明显好于CMA-SH3。
为更清晰地分析T2m预报误差与地形之间的联系, 文中以检验站点的海拔进行分区, 即200 m以下站点记为Ⅰ, 200~500 m为Ⅱ, 500~1000 m为Ⅲ, 1000 m以上为Ⅳ(表2)。可以看出CMA-SH3在Ⅰ、 Ⅱ和Ⅲ类站点的平均MAE、 平均RMSE变化较小, MT-Cunet与CMA-SH3类似, 但平均MAE和平均RMSE偏小, 较CMA-SH3原始预报数据分别降低30.6%和30.4%。Ⅳ类站点的CMA-SH3和MT-Cunet误差均偏高, 后者较前者的平均MAE和平均RMSE分别降低16.7%和11.4%。
表2 不同海拔分类区间的MAE和RMSETable 2 The MEA and RMSE for different altitude classification intervals |
| 模式 | 评估 指标 | <200 m (Ⅰ) | 200~500 m (Ⅱ) | 500~1000 m (Ⅲ) | >1000 m (Ⅳ) |
|---|---|---|---|---|---|
| CMA- SH3 | MAE/℃ | 1.7 | 2.0 | 1.8 | 3.0 |
| RMSE/℃ | 2.3 | 2.6 | 2.3 | 3.5 | |
| MT- Cunet | MAE/℃ | 1.2 | 1.3 | 1.3 | 2.5 |
| RMSE/℃ | 1.6 | 1.7 | 1.7 | 3.1 |
3.5 转折性天气过程检验
性能较好的客观方法不仅在整体评估上有较好的预报效果, 还需要能够在转折天气过程中有较出色的表现。2022年2月23 -25日和2022年3月16 -18日, 研究区域内分别出现了一次区域性增温天气过程和寒潮天气过程, 文中以这两次天气过程为例对CMA-SH3和MT-Cunet方法在T2m转折性天气过程中的预报效果进行检验评估。
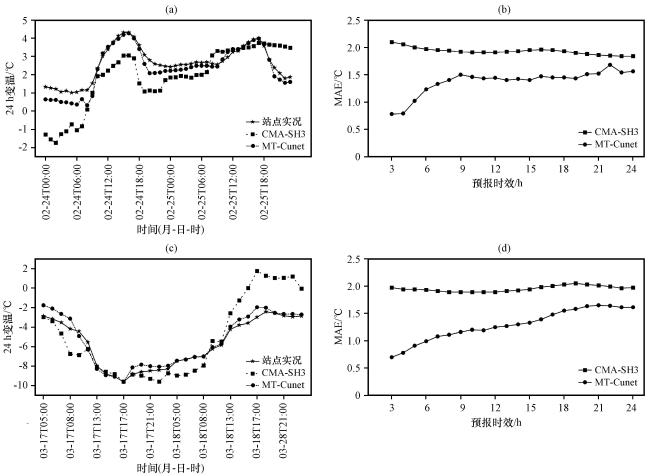
2022年2月16 -22日继续受冷空气影响, 研究区域内出现大范围连续阴雨(雪)天气。23 -25日全省受槽后偏北气流控制, 雨雪停转晴天, 研究区域24 -25日24 h变温(以下简称变温)以增温为主, 其中最大变温时间出现在24日15:00, 25日17:00其次, 变温分别为4.3 ℃和4.0 ℃[图9(a)]。在这次增温过程中, CMA-SH3均较好地预报了过程增温趋势, 过程最大变温时刻与实况一致, 时刻变温分别为3.1 ℃、 3.7 ℃, 较实况变温偏离1.2 ℃、 0.3 ℃。过程变温最大偏离时段为24日01:00 -08:00, 为2.2 ℃; 25日19:00 -23:00其次, 偏离1.4 ℃。MT-Cunet与实况最为接近, 较好地预报了过程变温趋势, 总体变温均值偏离0.2 ℃, 其中变温最大偏离时段也出现在24日01:00 -08:00, 时段变温均值偏离0.6 ℃。
图9 2022年2月24 -25日增暖过程(上)和3月17 -18日寒潮过程(下)CMA-SH3和MT-Cunet的24 h变温(a, c), 以及T2m预报的MAE(b, d)对比Fig.9 Comparison of 24 h temperature changes (a, c) of CMA-SH3 and MT-Cunet, and the MAE (b, d) of T2m forecasts during the warming process from 24 to 25 February (up) and cold wave process from 17 to 18 March (down) 2022 |
CMA-SH3所有时次的MAE均较大, 最大值为2.10 ℃, 出现在3 h时效; 最小值也达到了1.84 ℃, 出现在24 h时效; MT-Cunet的MAE比CMA-SH3有明显降低, 最大值为1.68 ℃, 出现在22 h时效; 最小值仅有0.78 ℃, 出现在3 h时效[图9(b)]。总体来说, MT-Cunet的平均MAE比CMA-SH3降低28.9%, 表明MT-Cunet在增温天气过程中有较好的订正能力。
2022年3月16 -18日, 受北方强冷空气南下影响, 湖北、 安徽、 湖南、 江西等省出现了一次寒潮天气过程[图9(c)], 其中3月17日05:00至18日23:00为主要降温时段, 过程变温均值为-5.7 ℃; 最大降温时刻出现在3月17日17:00, 变温为-9.6 ℃。在此次降温过程中, CMA-SH3和MT-Cunet均较好地预报了过程降温趋势, 过程最大变温和变温时刻与实况均一致。MT-Cunet表现较好, 过程变温均值为-5.4 ℃, 变温趋势与实况较为吻合; CMA-SH3表现较差, 过程变温均值为-5.1 ℃, 其中在3月18日15:00 -22:00, CMA-SH3表现出正变温(0.0~1.76 ℃), 与实况负变温(-3.6~-2.4 ℃)偏离较大, 时段变温均值偏离3.9 ℃。
在主要影响时段的T2m预报检验评估中, CMA-SH3所有时次的MAE仍然较大, 最大值为2.05 ℃, 出现在19 h时效, 最小值为1.89 ℃, 出现在6 h时效。与增温过程类似, MT-Cunet的MAE低于CMA-SH3, 最大值为1.65 ℃, 出现在21 h时效; 最小值为0.70 ℃, 出现在3 h时效[图9(d)]。总体来说, MT-Cunet的MAE比CMA-SH3降低33.8%, 表明MT-Cunet在强降温天气过程中也有较强的订正能力。
4 结论
利用2020 -2021年CMA-SH3等高分辨率数值模式预报和CLDAS数据, 基于CU-net构建多时间序列MT-Cunet 深度学习模型, 制作了2022年逐小时滚动更新的逐小时分辨率订正产品, 采用多种检验方法对CMA-SH3、 MT-Cunet与219个国家观测站点的T2m逐小时实况进行检验评估, 主要结论如下:
(1) 将CMA-SH3等逐小时滚动更新的数值模式产品加入深度学习模型中进行训练, 解决了常规数值预报产品因为可用样本较少导致深度学习训练结果较差的问题, 也给部分国产数值模式因内核更新较快导致深度学习训练结果不稳定的问题提供了一个解决思路。通过1年时间的业务运行和检验评估, MT-Cunet模型对CMA-SH3模式具有较强的订正效果, 提高了国产数值模式的可用性。
(2) 在逐时次预报中, MT-Cunet存在较明显的随预报时效增加, 订正能力下降的趋势。经MT-Cunet订正后的误差比CMA-SH3有较大幅度降低, 其中3~9 h时效的平均MAE比CMA-SH3下降42.4%, 10~24 h时效的平均MAE则下降26.7%; 在空间分布上, MT-Cunet能较大幅度减少地形对T2m预报结果的影响, 使订正后的T2m预报性能有较大的提升, 但局部高海拔山区仍存在误差偏高的现象。
(3) 经MT-Cunet模型订正后的T2m预报MAE离散度有较大幅度的下降。其中, 3 h时效MT-Cunet的MAE中位值和平均值均比CMA-SH3要低; 9 h时效的MT-Cunet的中位值和平均值仍然优于CMA-SH3; 24 h时效中位值和平均值优于CMA-SH3, 但离散程度加大。
(4) MT-Cunet和CMA-SH3在月尺度上没有明显的变化特征, 日尺度上均表现为明显的单峰日变化特征, 其中, MT-Cunet模型订正后的T2m预报质量均要优于CMA-SH3。低温和高温事件中CMA-SH3均表现一致负偏差; 相较CMA-SH3, MT-Cunet预报偏差较小, 但仍存在高温预报偏高, 而低温预报偏低。CMA-SH3和MT-Cunet均存在较明显的随预报时效增加, MAE和RMSE逐步升高的趋势。
(5) MT-Cunet模型在转折性天气过程中有较强的预报能力, 能较好地预报出增(降)温转折时间和增(降)温幅度。在2022年2月23 -25日的转暖天气过程中, MT-Cunet的平均MAE比CMA-SH3分别降低28.9%; 在3月16 -18日的强降温天气过程中, 平均MAE分别降低33.8%。在全部时效预报中, MT-Cunet的MAE均最低。
文中的MT-Cunet模型仅考虑了T2m的实况数据和CMA-SH3数值模式预报数据, 没有考虑地形分布和地面、 高空其他气象要素变化, 是一个较为简单的深度学习模型, 虽然也较好地预报出不同地形下的温度差异, 但实际上地面、 高空(尤其是边界层等低层大气)等相关气象要素对T2m都会有不同程度的影响。一般来说, 将相关气象要素融合进深度学习模式, 有助于提高深度学习模型的鲁棒性(张延彪等, 2022), 但融合过多观测数据, 有可能会让模型训练在增加计算资源消耗的同时, 又因为训练过拟合导致模型泛化性能下降。因此在实际业务当中需要动态平衡观测数据样本种类数量和深度学习模型之间的关系。下一步将会针对这个问题, 在MT-Cunet模型基础上, 通过融合地形和多元观测数据, 以进一步改善模型的订正能力, 尤其是10~24 h时效预报的订正能力, 拓展国产数值模式的可用性。