

1 引言
2 资料来源和方法介绍
2.1 资料简介
2.2 研究方法
3 结果分析
3.1 特征指数的评估
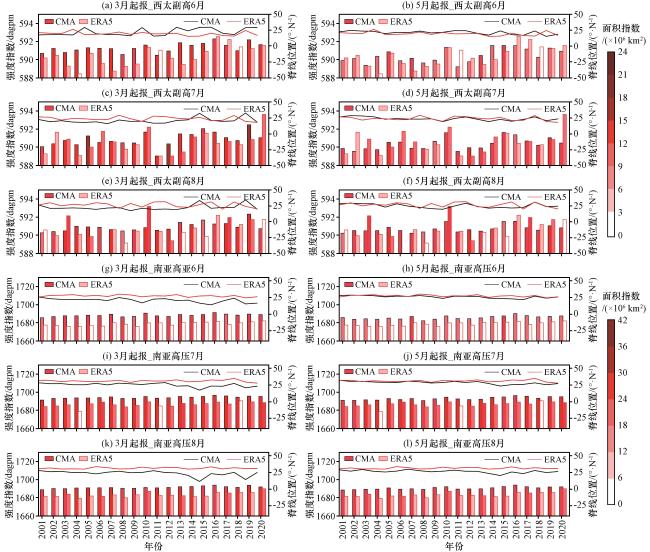
图1 3月、 5月起报预测的2001 -2020年6 -8月西太副高(a~f)和南亚高压(g~l)特征指数(a)、 (c)、 (e)分别为3月起报预测的6 -8月西太副高特征指数; (b)、 (d)、 (f)分别为5月起报预测的6 -8月西太副高特征指数; (g)、 (i)、 (k)分别为3月起报预测的6 -8月南亚高压特征指数; (h)、 (j)、 (l)分别为5月起报预测的6 -8月南亚高压特征指数Fig.1 Characteristic indices of the West Pacific Subtropical High (a~f) and the South Asia High (g~l) from June to August during 2001 -2020 forecasted by CMA-CPSv3 starting from March and May.InFig.1, (a), (c)and (e) characteristic indices of the West Pacific Subtropical High from June to August forecasted by CMA-CPSv3 starting from March; (b), (d) and (f) characteristic indices of the West Pacific Subtropical High from June to August forecasted by CMA-CPSv3 starting from May; (g), (i) and (k) characteristic indices of the South Asia High from June to August forecasted by CMA-CPSv3 starting from March; (h), (j) and (l) characteristic indices of the South Asia High from June to August forecasted by CMA-CPSv3 starting from May |
3.2 环流特征的预测能力分析
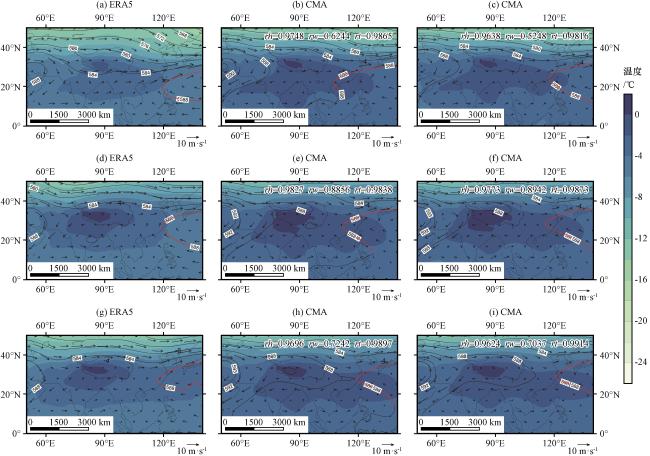
图2 ERA5再分析(左)和3月(中)、 5月(右)起报CMA-CPSv3预测的西太副高较好年合成的东亚地区500 hPa位势高度(等值线, 单位: dagpm)、 风场(矢量, 单位: m·s-1)和温度(彩色区, 单位: ℃)的分布(a)~(c) 6月, (d)~(f) 7月, (g)~(i) 8月, 部分图右上角标注为相应要素的空间相关系数Fig.2 Synthetic circulation of geopotential height (contour line, unit: dagpm), wind field (vector, unit: m·s-1), and temperature (color area, unit: ℃) on 500 hPa in East Asia as well predicted by CMA-CPSv3 model starting from March (middle) and May (right) and ERA5 reanalysis data (left).(a)~(c) June, (d)~(f) July, (g)~(i) August, the corresponding spatial correlation coefficients marked in the upper right corner of some graphs |
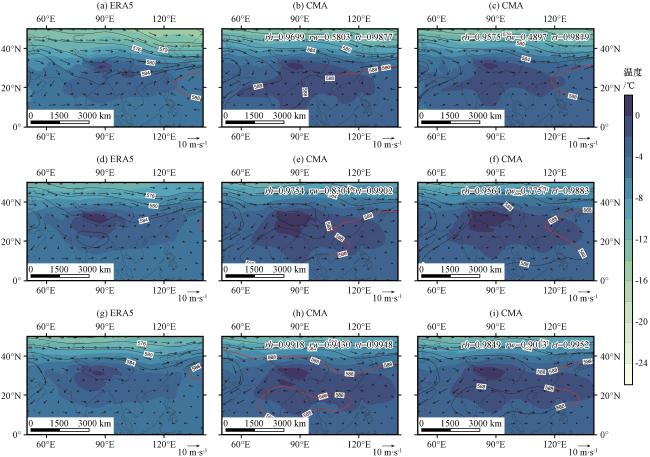
图3 ERA5再分析(左)和3月(中)、 5月(右)起报CMA-CPSv3预测的西太副高较差年合成的东亚地区500 hPa位势高度(等值线, 单位: dagpm)、 风场(矢量, 单位: m·s-1)和温度(彩色区, 单位: ℃)的分布(a)~(c)6月, (d)~(f)7月, (g)~(i)8月, 部分图右上角标注为相应要素的空间相关系数Fig.3 Synthetic circulation of geopotential height (contour line, unit: dagpm), wind field (vector, unit: m·s-1), and temperature (color area, unit: ℃) on 500 hPa in East Asia in bad predicted by CMA-CPSv3 model starting from March (middle) and May (right) and ERA5 reanalysis data (left).(a)~(c) June, (d)~(f) July, (g)~(i) August, the corresponding spatial correlation coefficients marked in the upper right corner of some graphs |
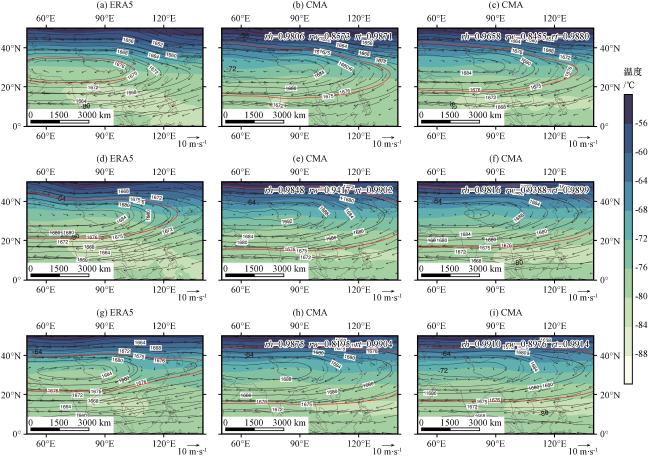
图4 ERA5再分析(左)和3月(中)、 5月(右)起报CMA-CPSv3预测的南亚高压较好年合成的东亚地区100 hPa位势高度(等值线, 单位: dagpm)、 风场(矢量, 单位: m·s-1)和温度(彩色区, 单位: ℃)的分布(a)~(c)6月, (d)~(f)7月, (g)~(i)8月, 部分图右上角标注为相应要素的空间相关系数Fig.4 Synthetic circulation of geopotential height (contour line, unit: dagpm), wind field (vector, unit: m·s-1), and temperature (color area, unit: ℃) on 100 hPa in East Asia as well predicted by CMA-CPSv3 model starting from March (middle) and May (right) and ERA5 reanalysis data (left).(a)~(c) June, (d)~(f) July, (g)~(i) August, the corresponding spatial correlation coefficients marked in the upper right corner of some graphs |
4 对比预测的两个高压系统同好年和同差年
4.1 要素场分析
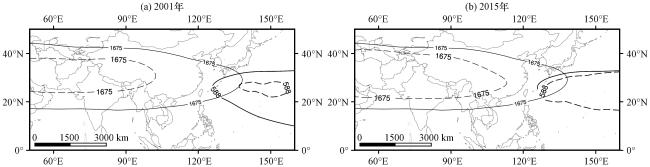
图5 2001年(a)和2015年(b)夏季南亚高压、 西太副高特征等高线(等值线, 单位: dagpm)的空间分布实线为CMA-CPSv3预测结果, 虚线为ERA5结果Fig.5 Spatial distribution of characteristic contour lines (contour, unit: dagpm) of the South Asian High and West Pacific Subtropical High during the summer of 2001 (a) and 2015 (b).Solid line represents the CMA-CPSv3 result and dashed line represents the ERA5 result |
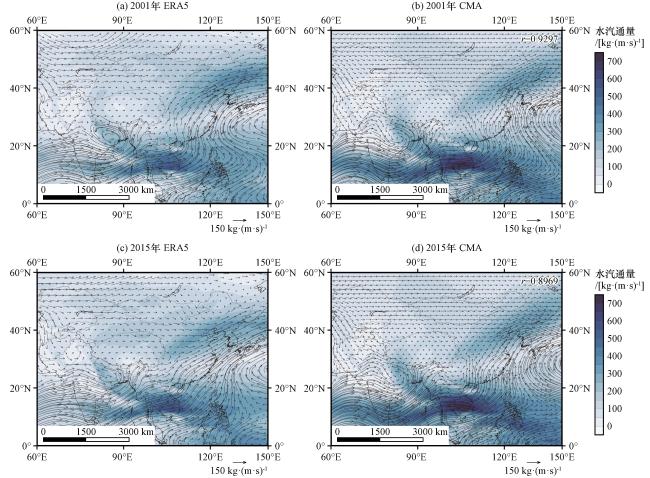
图6 2001年(a, b)和2015年(c, d)夏季东亚区域水汽通量[矢量, 单位: kg· (m·s)-1]的空间分布(a)、 (c) ERA5结果, (b)、 (d) CMA-CPSv3预测结果; 彩色区表示水汽通量数值大小[单位: kg· (m·s)-1]Fig.6 Spatial distribution of water vapor flux [vector, unit: kg· (m·s)-1] in the East Asian region during the summer of 2001 (a, b) and 2015 (c, d).In Fig.6, (a) and (c) denotes ERA5 results, (b) and (d) denotes CMA-CPSv3 results; The color area represents the magnitude of water vapor flux [unit: kg· (m·s)-1] |
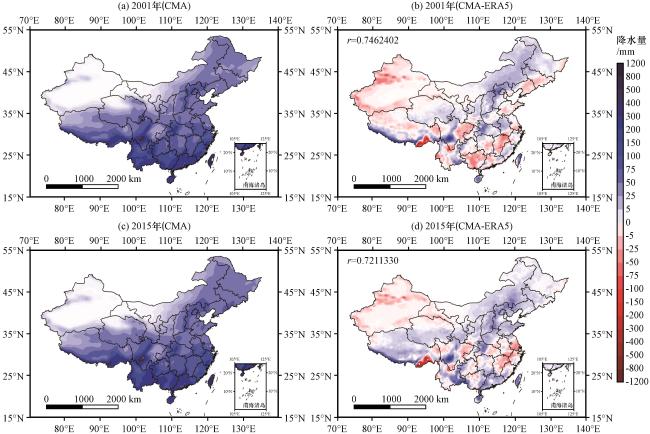
图7 2001年(a, b)和2015年(c, d)夏季中国地区降水量及其差值的空间分布(a)、 (c)CMA-CPSv3预测值, (b)、 (d) CMA-CPSv3预测值与ERA5差值Fig.7 Spatial distribution of precipitation and its difference in China in summer of 2001 (a, b) and 2015 (c, d).In Fig.7, (a) and (c) denotes CMA-CPSv3 results, (b) and (d) denotes difference between CMA-CPSv3 results and ERA5 results |
4.2 可能原因的讨论
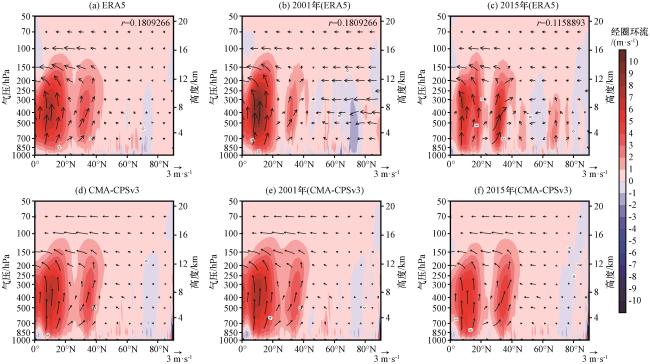
图8 气候态(左)、 2001年(中)和2015年(右)夏季沿120°E -150°E北半球平均经圈环流剖面(矢量和彩色区, 单位: m·s-1)(a)~(c)ERA5结果, (d)~(f)CMA-CPSv3结果Fig.8 Profile of mean meridional circulation (vector and color area, unit: m·s-1) along averaged 120°E -150°E in the northern hemisphere in summer in climate state (left), 2001 (middle) and 2015 (right).(a)~(c) ERA5 results, (d)~(f) CMA-CPSv3 results |
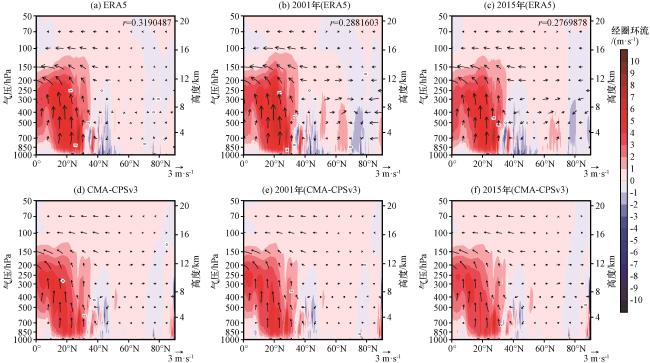


图9 气候态(左)、 2001年(中)和2015年(右)夏季沿60°E -120°E北半球平均经圈环流剖面(矢量和彩色区, 单位: m·s-1)(a)~(c)ERA5结果, (d)~(f)CMA-CPSv3结果Fig.9 Profile of mean meridional circulation (vector and color area, unit:m·s-1) along averaged 60°E -120°E in the northern hemisphere in summer in climate state (left), 2001 (middle) and 2015 (right).(a)~(c) ERA5 results, (d)~(f) CMA-CPSv3 results |