Spatiotemporal Patterns of Precipitation in Qaidam Basin from 2000 to 2019 Base on the ANUSPLIN Model

  • Wenqi ZHANG ,
  • Yuanyan ZHAO ,
  • Zongrui LAI ,
  • Bao CHAO ,
  • Le HAN
Expand
  • 1. Key Laboratory of National Forestry and Grassland Administration on Soil and Water Conservation,School of Soil and Water Conservation,Beijing Forestry University,Beijing 100083,China
    2. Yanchi Research Station,School of Soil and Water Conservation,Beijing Forestry University,Yanchi 751500,Ningxia,China

Received date: 2023-07-06

  Revised date: 2023-12-04

  Online published: 2023-12-04

Abstract

The Qaidam Basin is sensitive to the warming and humidification trend of climate change on the Qinghai-Xizang Plateau, and an ecologically vulnerable region.Evaluating its spatiotemporal patterns of precipitation is crucial for the rational utilization of water resources as well as ecological management.However, the scarcity and uneven distribution of meteorological stations within the basin poses a challenge to such analysis.This study was to explore an optimal method for precipitation interpolation in the basin in this context.Specifically, the Australian National University Spline (ANUSPLIN) model was used for the interpolation with different numbers of meteorological stations (9, 20, 40, 60, 80, 100, 120 140, 160 and 180 stations) within and around the basin and 9 kinds of thin disk smooth spline functions (various combinations of independent variables, covariates and spline times).We screened the optimal number of interpolation stations and the optimal function by accuracy assessments using the data in 2019.The spatiotemporal patterns of precipitation in this region from 2000 to 2019 were then analyzed.The results showed that: (1) The ANUSPLIN model achieved the highest accuracy with 120 meteorological stations and the function of trivariate local thin disk smooth spline (TVPTPS4).The root mean square error (RMSE), expected true mean square error (RTMSE) and signal-to-noise ratio (SNR) were less than 0.6 mm, 0.3 mm and 0.25, respectively, which was the lowest among all combinations.(2) Precipitation in the Qaidam Basin had substantial differences in regional distribution and seasonality.Both annual precipitation and seasonal precipitation were abundant in the east and scarce in the west, while the precipitation in summer was the highest, accounting for 62.13% of the annual total value.(3) From 2000 to 2019, both the annual precipitation and seasonal precipitation in the basin showed an increasing trend.The precipitation in summer showed a significant increasing trend, with a maximum growth rate of 5.85 mm·a-1P<0.05).The regions with significant trend accounted for approximately 42.36% of the total area of the basin.The results of this study demonstrate that the AUNSPLIN model can accurately reflect the distribution of precipitation in the Qaidam Basin, comparing with the ordinary Kriging and the inverse distance weighted methods.Obtaining an accurate precipitation patterns is of great theoretical and practical significance for the optimal management of water resources in the region.

Cite this article

Wenqi ZHANG , Yuanyan ZHAO , Zongrui LAI , Bao CHAO , Le HAN . Spatiotemporal Patterns of Precipitation in Qaidam Basin from 2000 to 2019 Base on the ANUSPLIN Model[J]. Plateau Meteorology, 2024 , 43(3) : 737 -748 . DOI: 10.7522/j.issn.1000-0534.2023.00094

1 引言

柴达木盆地是青藏高原东北部边缘的巨大山间断陷盆地, 受青藏高原暖湿化影响, 气候变化尤为剧烈(党学亚等, 2019张春雨等, 2023)。降水量作为响应气候变化最直接、 最敏感的气象要素之一, 是气象学、 水文学、 植被学和生态学等研究领域的基础(Zhang and Wang, 2016; Chen et al, 2020; 陈荣等, 2023)。降水量的空间化对于区域水资源优化配置、 管理以及生态环境治理具有重要意义(Lassegues, 2018; 马佳宁和高艳红, 2019)。目前降水数据的采集主要基于气象台站的长期定位和观测, 但现有气象台站分布不均, 数量少, 降低了空间降水数据的准确性(Hofstra et al, 2010贾洋和崔鹏, 2018)。因此, 如何利用来自气象台站有限的数据获得更精确的空间分布数据是一个重要的科学问题。
研究多采用空间插值法来实现气象台站数据的空间化(李月臣等, 2014Comber and Zeng, 2019)。针对气象数据常用的插值方法有普通克里金法(Ordinary Kriging, OK)、 反距离加权法(Inverse Distance Weighted, IDW)、 局部多项式插值法(Local Polynomial Interpolation, LPI)和样条函数法(Spline)等(Ozturk and Kilic, 2016王新宇和黄鹏程, 2020), 这些方法通常用于台站密度高、 地势平坦的地区(马诺等, 2020)。由于过度依赖气象台站的空间密度, 缺乏气象要素的演化机制, 对于气象台站稀少、 地形复杂的地区, 插值精度往往不足(李新等, 2003贾洋和崔鹏, 2018)。如在高海拔山区和地形起伏较大的丘陵地区, 气象台站稀少且分布不均, 传统的空间插值方法无法反映出由于地形变化引起的气象要素空间变化, 严重制约了复杂地形地貌区域的气象要素精细化研究(梅晓丹等, 2021陈金雨等, 2021)。
20世纪90年代以来, 由澳大利亚科学家Hutchinson采用薄盘光滑样条函数研发的专业气象插值软件ANUSPLIN(Australian National University Spline)模型在气候数据曲面拟合方面引起关注, 该模型可以允许多个影响因子作为协变量, 综合考虑地形、 气象台站的分布及数量对气象要素空间插值的影响, 在时空尺度上得到广泛应用。如多项研究表明ANUSPLIN对气象要素的插值结果优于其他插值方法(谭剑波等, 2016李任君等, 2019Guo et al, 2022)。张玮玮等(2020)采用ANUSPLIN、 反距离加权和普通克里金对复杂地形下浙江夏季气候要素进行空间插值, 结果显示ANUSPLIN更适合浙江复杂地形条件和气候背景下的气象要素空间插值。孟清等(2020)利用ANUSPLIN模型、 普通克里金插值和反距离加权对秦岭地区近50多年的降水进行空间插值, ANUSPLIN模型在复杂山地环境下对气象要素进行空间插值的精度最高。现有研究表明, 在实际应用时需要根据研究区的地理特征检验插值方法的适用性。
柴达木盆地地处内陆腹地, 气象台站分布稀疏, 全盆地仅有9个国家级气象台站, 且多数气象台站分布在绿洲内, 而在高山和低海拔区域上基本没有气象台站, 导致盆地降水量栅格数据难以获取。因此, 本文以柴达木盆地为研究对象, 以中国气象数据网提供的气象台站逐月降水资料为数据源, 利用ANUSPLIN空间插值模型, 研究参与插值的气象台站数、 样条函数的不同变量组合和样条次数对模型精度的影响, 得到适于柴达木盆地降水空间化的最优插值台站数和最优模型, 并讨论了其与普通克里金法(OK)和反距离加权法(IDW)的插值精度差异, 探究柴达木盆地降水时空格局, 从而为精细化研究柴达木盆地气象要素、 优化区域水资源配置和管理提供科学参考。

2 数据来源与方法介绍

2.1 研究区概况

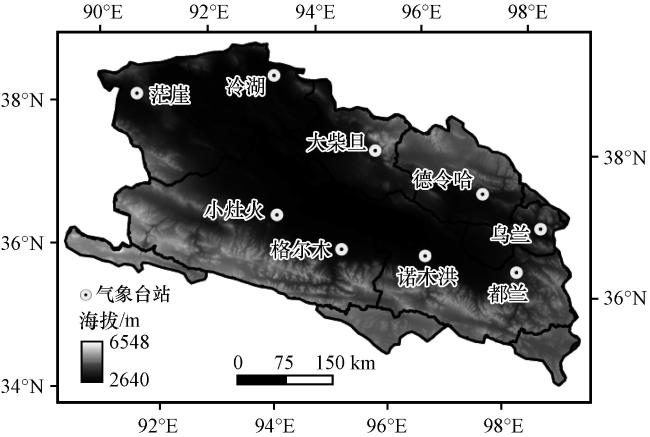
柴达木盆地是我国三大内陆盆地之一(35°00′N -39°20′N, 90°16′E -99°16′E), 区域面积约为27.5×10⁴ km2, 海拔2600~3300 m, 地貌类型多样, 地形从边缘至中心呈环状分布(图1)。盆地属高原大陆性气候, 冬季寒冷漫长, 夏季凉爽短促, 终年干燥少雨, 降水年际变化大(戴升等, 2012; 彭旺等, 2022王远征等, 2023)。文中涉及的地图是基于青海省标准地图服务网站下载的审图号为青S(2021)262的标准地图制作, 底图无修改。本文使用的柴达木盆地边界数据来源于杜玉娥等(2018)
图1 研究区气象台站分布

Fig.1 Distribution of meteorological stations in the study area

2.2 数据来源

本研究使用的2000 -2019年降水量月值数据来自中国气象数据网(http: //data.cma.cn), 取3 -5月为春季, 6 -8月为夏季, 9 -11月为秋季, 12月至次年2月为冬季。季降水量取3个月的降水总量。由于柴达木盆地内气象台站较少, 且分布稀疏, 选择的插值范围比柴达木盆地的实际范围大, 包括柴达木盆地内(9个)及其周边(171个)共180个气象台站(31°35′N -42°43′N, 84°18′E -105°31′E)(张仁平等, 2018邱美娟等, 2020)。依据ANUSPLIN模型的插值原理, 本研究选择了来自地理空间数据云(https: //www.gscloud.cn/), 精度为1 km的中国区高程(Digital Elevation Mode, DEM)数据。

2.3 研究方法

2.3.1  ANUSPLIN插值

ANUSPLIN模型编程使用FORTRAN语言, 包括8个程序板块, 本研究主要应用了SPLINA(薄盘光滑样条函数)和LAPGRD(生成拟合表面和贝叶斯标准误差表面)两个板块, 实现模型诊断、 统计分析和误差分析等功能(Hutchinson, 2004)。局部薄盘光滑样条通过允许引入协变量因子对薄盘光滑样条原型进行了扩展, 其理论统计模型如下:
Z i = f x i + b T y i + e i ( i = 1 , , N )
式中: Z i是位于空间 i处的未插值点的预估值; x i是周围已知点 i处的气象要素值; f x i x i的未知光滑函数; y i是独立协变量, 本研究为高程; b是独立协变量 y i的系数; T b的上标; e i是期望值为0的随机误差。
为提高插值结果的精度, ANUSPLIN模型根据不同的点数据集提供了多个可选模型。因此, 在进行柴达木盆地降水量插值前, 应首先选择适合柴达木盆地降水空间化的最优模型。本研究设计了9种独立变量、 协变量和样条次数组合模型(表1), 然后利用柴达木盆地2019年逐月降水量数据, 对9种薄盘光滑样条函数模型进行实验(2019年年降水量接近多年降水量的平均值)。结合ANUSPLIN模型提供的误差判别参数(Hutchinson, 2004)和刘志红等(2008)提出的最佳模型判断标准, 本研究以广义交叉验证(Generalized Cross Validation, GCV)为模型检验方法, 选取信噪比(Signal to Noise Ratio, SNR)最小, 信号自由度(Signal)小于参与插值台站数的一半, SPLINA生成的误差文件中无*号提示, 筛选适于柴达木盆地降水量插值的最优模型。
表1 9种薄盘光滑样条函数模型

Table 1 Nine thin plate smooth spline function models

模型序号 独立变量 协变量 样条次数/次 缩写 含义
1 经度, 纬度 - 2 BVTPS2 双变量薄盘光滑样条函数
2 经度, 纬度 - 3 BVTPS3 双变量薄盘光滑样条函数
3 经度, 纬度 - 4 BVTPS4 双变量薄盘光滑样条函数
4 经度, 纬度 高程 2 TVPTPS2 三变量局部薄盘光滑样条函数
5 经度, 纬度 高程 3 TVPTPS3 三变量局部薄盘光滑样条函数
6 经度, 纬度 高程 4 TVPTPS4 三变量局部薄盘光滑样条函数
7 经度, 纬度, 高程 - 2 TVTPS2 三变量薄盘光滑样条函数
8 经度, 纬度, 高程 - 3 TVTPS3 三变量薄盘光滑样条函数
9 经度, 纬度, 高程 - 4 TVTPS4 三变量薄盘光滑样条函数

2.3.2 气象台站数的选择

为明确气象台站数对降水量插值精度的影响, 本文以柴达木盆地为中心, 综合考虑我国气象台站分布不均等因素, 以20个气象台站为间隔数, 选用9、 20、 40、 60、 80、 100、 120、 140、 160和180个气象台站, 利用ANUSPLIN的9种薄盘光滑样条函数模型分别对柴达木盆地2019年年降水量数据进行空间插值。采用GCV作为评估方法, 以广义交叉验证的均方根误差(RTGCV)、 期望真实均方误差(RTMSE)和信噪比(SNR)作为评估指标, 选取参与插值的最优台站数。
R T M S E = i = 1 n ( Z i - Z i ' ) 2 n
S N R = S i g n a l E r r o r
式中: Z i为降水量在第 i台站实测值; Z i '为降水量在第 i台站预测值; n参与插值的实测台站数; S i g n a l为信号自由度; E r r o r为误差; RTGCV的具体计算公式见ANUSPLIN使用说明(Hutchinson, 1991)。

2.3.3 趋势分析

基于ANUSPLIN最优模型和最优插值台站数对柴达木盆地2000 -2019年季降水量进行空间插值, 利用一元线性回归方法分析柴达木盆地降水量的时空变化趋势。通过分析每个降水栅格的变化趋势可以确定其变化趋势的空间分布, 从而了解降水在研究区内不同区域的变化情况。公式如下:
S l o p e = n × i = 1 n i × V A R i - i = 1 n i i = 1 n V A R i n × i = 1 n i 2 - i = 1 n i 2
式中: n为研究时间段的年数, 本研究n取20; V A R i为栅格某年的降水数据; S l o p e反应了降水量随时间的变化趋势, 通过显著性检验的降水量有显著变化趋势, 相反则无显著变化趋势; S l o p e>0, 降水量呈增大趋势; S l o p e<0, 降水量呈减小趋势。

3 结果分析

3.1 模型结果验证

3.1.1 不同台站数的结果验证

采用120个气象台站对柴达木盆地降水量进行空间插值, 模型精度越高。如图2(已剔除无效的插值结果数据)所示: 基于9、 20和40个台站数进行插值的模型统计误差过大, 因此所选台站数不参与统计; 以RTGCV和RTMSE为评估指标, BVTPS模型误差最大, TVPTPS和TVTPS模型中基于120个台站数插值的取值最低, 分别小于0.6 mm和0.3 mm; 此外, 基于120个台站插值的SNR在TVPTPS4模型处达到了最小值(SNR≈0.23)。因此, 本文选取120个气象台站进行空间插值。
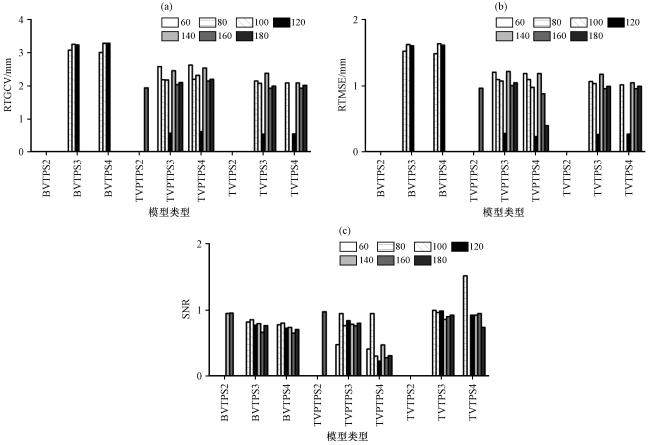
图2 不同模型不同台站数的RTGCV(a)、 RTMSE(b)和SNR(c)

Fig.2 RTGCV(a), RTMSE(b) and SNR(c) of different models with different number of stations

3.1.2 插值模型的选择

将2019年月降水量的9种模型插值结果进行对比分析发现, 最优模型是以高程为协变量的TVPTPS模型。如表2, 在12个月中有9个月份, 样条次数为4的局部样条函数产生了最小信噪比SNR, 另外一个月的样条次数为3。因此, TVPTPS4模型可在大部分月份提供精度最高的插值结果。
表2 2019年月降水量ANUSPLIN输出结果

Table 2 ANUSPLIN output results of monthly precipitation in 2019

月 份 模型

自由度

Signal

信噪比

SNR

均方根误差 RTGCV/mm 期望真实误差 RTMSE/mm
1 TVTPS4 45.8 0.593 2.600 1.230
2 TVPTPS4 31.1 0.338 0.698 0.304
3 TVPTPS4 18.1 0.173 0.814 0.288
4 TVPTPS4 22.3 0.221 1.110 0.428
5 TVPTPS3 44.3 0.563 1.200 0.574
6 TVPTPS4 42.3 0.524 1.510 0.717
7 BVTPS4 51.7 0.725 3.290 1.620
8 TVPTPS4 59.4 0.934 1.370 0.683
9 TVPTPS4 27.3 0.285 1.260 0.526
10 TVPTPS4 18.5 0.177 1.290 0.460
11 TVPTPS4 43.2 0.541 0.851 0.406
12 TVPTPS4 44.0 0.557 0.556 0.267

3.2 降水空间格局

2000 -2019年柴达木盆地年均降水量的空间格局自东向西呈“环状”的递减趋势分布, 西部地区全年降水量较低, 降水主要集中在东部地区(图3)。年均降水量最低值主要分布在茫崖市、 格尔木市东北部、 自治州直辖和都兰县西北部, 不超过50 mm, 约占盆地总面积的31%; 最高值分布在德令哈市北部、 都兰县的东北部和格尔木市的西南部, 近420 mm, 占盆地总面的6.19%; 盆地大部分地区降水量集中在50~400 mm, 约占盆地总面积的63%, 其中降水量在50~100 mm、 100~200 mm、 200~400 mm区域, 分别占盆地总面积的13.01%、 19.40%和30.70%。
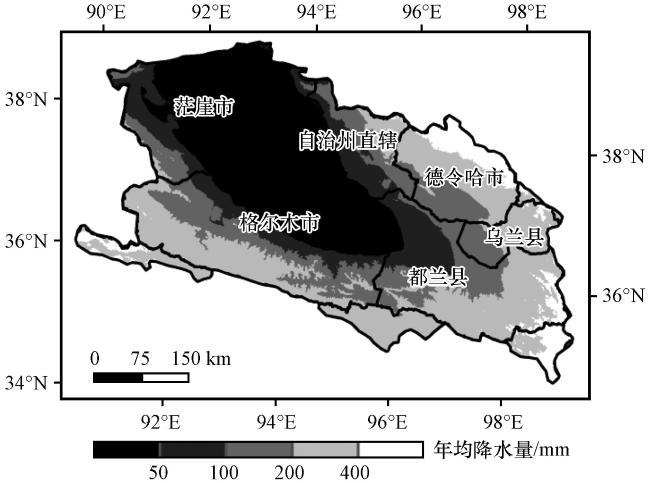
图3 2000 -2019年柴达木盆地年均降水量(单位: mm)空间分布

Fig.3 Spatial distribution of average annual precipitation (unit: mm)in Qaidam Basin from 2000 to 2019

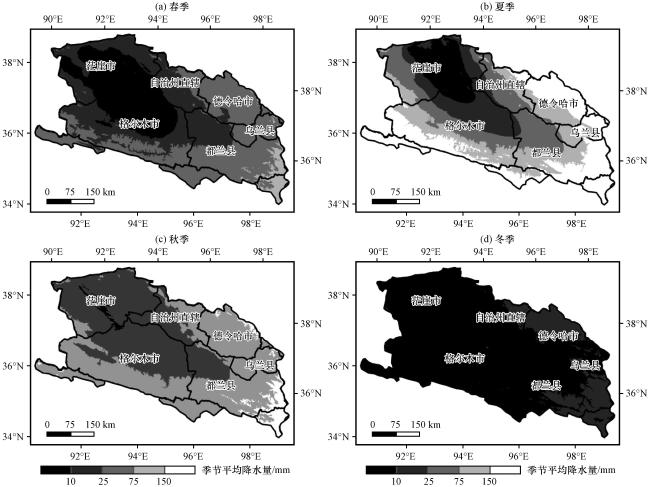
从季节尺度看(图4), 季节平均降水量空间格局东丰西少, 与年均降水量的空间格局类似, 从夏季开始降水逐渐增多, 冬季降水量最少。春季降水量多集中在盆地东部, 最低值主要分布在茫崖市、 格尔木市东北部, 不超过10 mm, 约占盆地总面积的28.77%; 最高值分布在都兰县东南部, 近110 mm, 占盆地总面的3.43%; 盆地大部分地区降水量集中在10~75 mm, 约占盆地总面积的63.8%[图4(a)]; 夏季盆地降水量最低值主要分布在茫崖市, 不超过10 mm, 约占盆地总面积的11.83%; 最高值分布在德令哈市、 乌兰县、 都兰县东南部和格尔木市南部, 近410 mm, 占盆地总面的29.43%; 盆地大部分地区降水量集中在10~150 mm, 约占盆地总面积的58.74%[图4(b)]; 秋季盆地降水量最低值主要分布在茫崖市, 不超过10 mm, 约占盆地面积的8.87%; 最高值分布在都兰县东南部和德令哈东北部, 近110 mm, 占盆地总面积的4.56%; 盆地大部分地区降水集中在10~75 mm, 约占盆地总面积的86.57%[图4(c)]; 冬季盆地降水量整体偏少, 大部分地区降水不超过10 mm, 主要分布在除德令哈市和都兰县东南部外的大部分区域, 约占盆地总面积的86.76%[图4(d)]。
图4 2000 -2019年柴达木盆地季节平均的降水量(单位: mm)空间分布

Fig.4 Spatial distribution of average seasonal precipitation (unit: mm) in the Qaidam Basin from 2000 to 2019

3.3  2000 -2019年区域降水变化

表3统计数据可知, 柴达木盆地2000 -2019年降水具有季节性特征, 夏季最大, 春秋次之, 冬季最小, 年均降水量为114.15 mm, 夏季为70.92 mm, 占全年的62.13%。盆地2010 -2019年年、 夏季、 冬季平均降水量年较2000 -2009年呈上升趋势, 分别增加了14.64 mm、 12.40 mm、 0.33 mm, 而春季和秋季呈减少趋势, 分别下降了0.69 mm、 0.33 mm, 年、 夏、 冬季降水演变过程为从“干-湿”, 而春季和秋季降水则经历了从“湿-干”的变化过程。
表3 2000 -2009年和2010 -2019年柴达木盆地年降水量及其差值

Table 3 Annual precipitation and its difference in the Qaidam Basin during 2000 -2009 and 2010 -2019

各季节 降水量/mm
2000 -2019年 2000 -2009年 2010 -2019年 差值
全年 114.15 106.83 121.47 14.64
春季 21.58 21.93 21.24 -0.69
夏季 70.92 62.04 74.44 12.4
秋季 17.21 18.38 16.03 -2.35
冬季 4.45 4.28 4.61 0.33
分析2000 -2019年柴达木盆地年、 季降水量变化趋势及降水量与年份相关系数表明(图5), 年、 季降水量变化趋势均为正值, 分别为20.65 mm·(10a)-1、 1.3 mm·(10a)-1、 18.4 mm·(10a)-1、 1.3 mm·(10a)-1、 0.7 mm·(10a)-1, 相关系数值分别为0.43、 0.01、 0.53、 0.10、 0.22, 其中只有夏季降水量相关系数通过了0.05显著性检验, 说明柴达木盆地夏季降水量发生了明显的变化, 降水显著增加。此外, 图5表明盆地夏季降水量呈明显上升趋势, 年和春、 秋、 冬季三季降水量上升趋势不显著。从年平均降水量看, 2002年、 2010年、 2012年、 2015年、 2018年较为湿润, 为多雨年份, 而2001年、 2013年较为干旱, 为少雨年份。
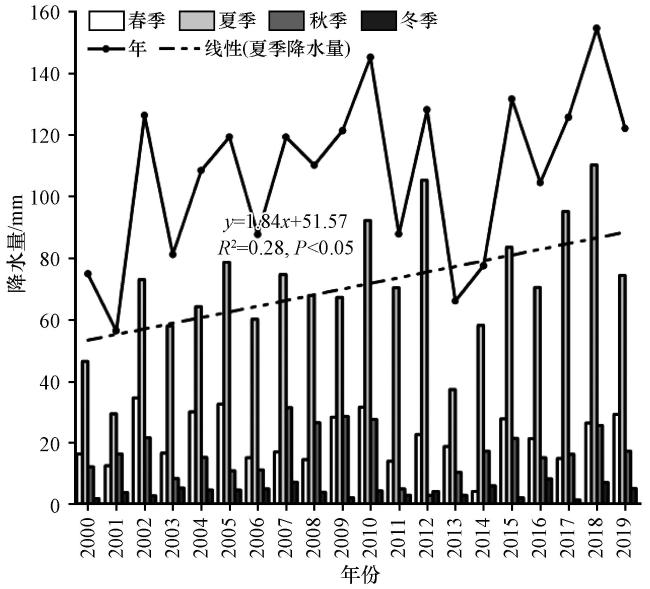
图5 2000 -2019年柴达木盆地年、 季降水量变化

Fig.5 Changes in annual and seasonal precipitation in the Qaidam Basin from 2000 to 2019

从2000 -2019年柴达木盆地年均降水量变化趋势空间分布图(图6)可以看出, 2000 -2019年, 柴达木盆地年均降水量变化趋势存在空间分布差异, 呈“东部快、 西部慢、 高海拔地区快、 低海拔地区慢”的空间变化特征。茫崖等西部地区降水量变化趋势不显著, 格尔木市等中部地区及东部地区降水量变化趋势通过了0.05显著性检验, 约占盆地总面积的47%。
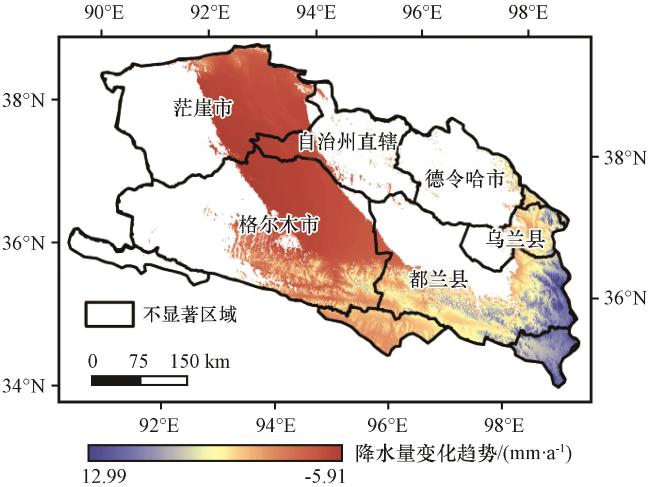
图6 2000 -2019年柴达木盆地年均降水量变化趋势(单位: mm·a-1)空间分布

Fig.6 Spatial distribution of annual average precipitation variation trend (unit: mm·a-1) in the Qaidam Basin from 2000 to 2019

对季节平均降水量变化趋势进行显著性检验表明, 季节平均降水量呈下降趋势的区域均未通过0.05水平的显著性检验(图7)。夏季降水量在自治州直辖区、 德令哈市、 乌兰县和都兰县北部变化最为显著, 最大增速达5.85 mm·a-1p<0.05), 变化显著区域约占盆地总面积的42.36%; 春季、 秋季和冬季近20年季节平均降水量变化幅度不显著。
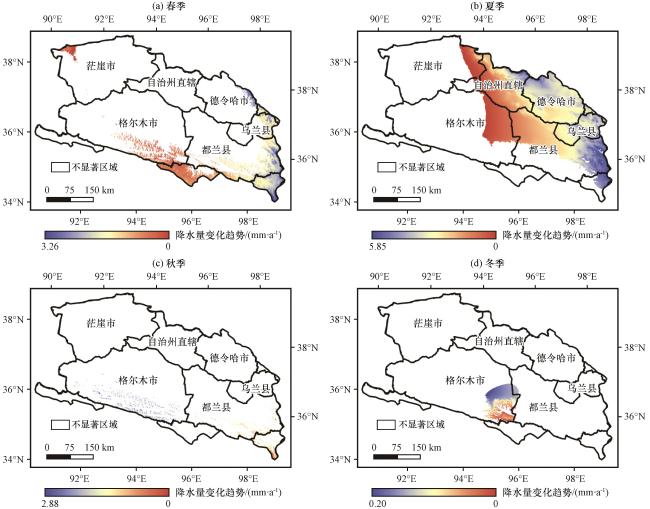
图7 2000 -2019年柴达木盆地季节平均降水量变化趋势(单位: mm·a-1)空间分布

Fig.7 Spatial distribution of seasonal average precipitation variation trend (单位: mm·a-1) in the Qaidam Basin from 2000 to 2019

4 讨论

4.1 基于降水数据的3种插值方法的比较

为进一步说明ANUSPLIN的插值精度, 选取普通克里金插值法(OK)和反距离加权法(IDW)这两种气象学常用的插值方法进行横向比较, 用120个气象台站2000 -2019年多年平均降水数据对柴达木盆地进行空间插值, 再分别对3种插值结果的9个气象台站(柴达木盆地内)实际观测的降水数据(实测值)和软件插值得到的降水数据(插值)进行相关分析。实验结果显示, 基于OK、 IDW和ANUSPLIN的降水插值结果精度具有差异性(图8)。ANUSPLIN的精度最优, 相关性为0.97; OK和IDW的相关性分别为0.79和0.78[图8(b)]。由图8(a)可知, 基于3种插值方法的柴达木盆地年均降水量空间分布东丰西少, 在空间格局的显示上ANUSPLIN方法明显比其他两种方法更加平滑、 细致地描绘出地形因素对降水量空间分布的影响, 清晰地表达出柴达木盆地降水的分布状况, 而其他两种方法的空间分布图均出现了“牛眼”。结合地理特征的适用性, ANUSPLIN模型更适合实现柴达木盆地气象台站降水数据的空间化。
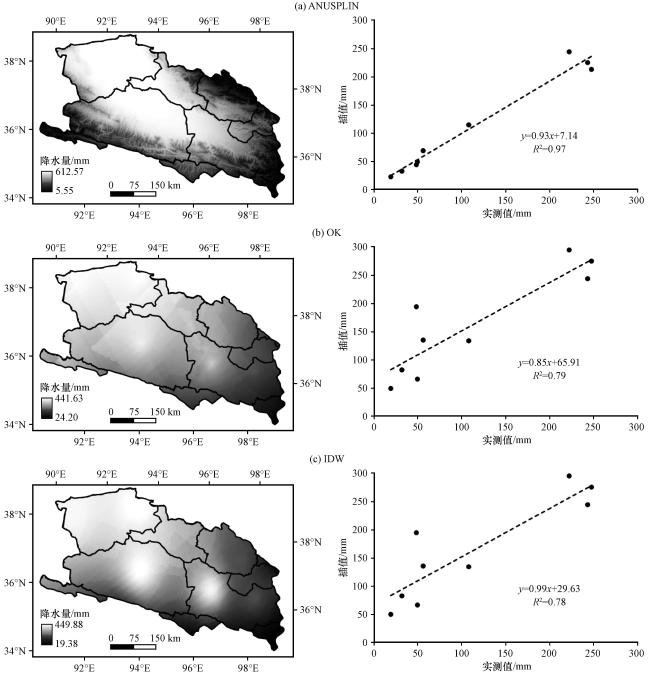
图8 基于ANUSPLIN(a)、 OK(b)和IDW(c)插值的年均降水量空间分布(左, 单位: mm)及实测值与插值散点图(右)

Fig.8 The spatial distribution of annual mean precipitation (left, unit: mm) and the scatter plots of measured and interpolated values (right) based on ANUSPLIN (a)、 OK (b) and IDW (c) interpolation

4.2 柴达木盆地降水变化特征

柴达木盆地位于我国青藏高原和西北地区的重叠地带, 两地气候暖湿化对盆地气候变化产生了较大影响(卢娜, 2014党学亚等, 2019王澄海等, 2021)。本研究发现2000 -2019年柴达木盆地降水量变化趋势经历了“干-湿-干-湿”的变化特征, 盆地整体降水量呈增加趋势, 其中夏季降水量显著增加, 与时兴合等(2005)葛根巴图等(2020)研究指出的中国西北地区气候由暖干向暖湿转型的趋势相吻合。同时柴达木盆地2000 -2019年年均降水量变化趋势通过0.05显著性检验的区域主要分布在格尔木市等中部地区及东部地区, 与李林等(2015)、 陈碧珊等(2010)和韩廷芳等(2019)基于气象台站数据研究柴达木盆地降水变化趋势空间分布特征为自西向东逐渐显著相同。这些与温度有关的气候因素加快了柴达木盆地气候由暖干向暖湿型转化的速度(傅小城等, 2011李林等, 2015)。因此本文对于气候转型事实还有待于从冰川变化、 河流径流量、 湖泊面积和水位变化、 植被覆盖等情况进一步深入探讨。

5 结论

本研究通过对ANUSPLIN的9种薄盘光滑样条函数模型和参与插值台站数的定量与定性分析, 获得了最优插值台站数和最优模型; 并结合柴达木盆地2000-2019年逐月降水资料分析了柴达木盆地年均降水量和季节平均降水量的时空格局, 得到以下主要结论:
(1) 参与插值的气象台站数会影响插值精度, 选择合适的台站数目, 插值结果的精度越高, 而不是台站越多, 插值精度越高, 本文选择120个气象台站的插值结果精度最高。最优模型是以高程为协变量的TVPTPS4模型。与OK和IDW的插值精度相比, ANUSPLIN更能精细地反映柴达木盆地区域降水量的空间格局。
(2) 在空间上, 降水具有地域分布差异和季节性特征。2000 -2019年柴达木盆地降水量空间分布不均匀, 自东向西呈“环状”的递减趋势分布, 其中降水量在200~400 mm的区域面积占盆地总面积的30.70%, 主要分布盆地中东部的德令哈市、 乌兰县、 都兰县东南部地区和格尔木市南部地区。季节平均降水量的空间格局与年均降水量的空间格局类似, 其中夏季降水量最多, 最高值近410 mm, 分布在德令哈市、 乌兰县、 都兰县东南部和格尔木市南部, 占盆地总面的29.43%; 春季和秋季次之, 大部分地区降水量集中在10~75 mm; 冬季降水量最少, 盆地86.76%地区降水不超过10 mm。
(3) 在时间上, 柴达木盆地2000 -2019年年均降水量和季节平均降水量呈上升趋势, 其中夏季降水量占全年的62.13%, 降水显著增加, 年和春、 秋、 冬三季降水上升趋势不明显。年均降水量变化趋势整体呈“东部快、 西部慢、 高海拔地区快、 低海拔地区慢”的变化特征, 其中通过0.05显著性检验的区域主要分布在格尔木市等中部地区及东部地区, 约占盆地总面积的47%。夏季降水量变化趋势通过0.05显著性检验的区域主要分布在自治州直辖区、 德令哈市、 乌兰县和都兰县北部, 约占盆地总面的42.36%, 春季、 秋季和冬季近20年季节平均降水量变化幅度不显著。

References

null
Che Z F Wang W G Fu J Y2020.Vegetation response to precipitation anomalies under different climatic and biogeographical conditions in China[J].Scientific Reports10 (1): 830.DOI: 10. 1038/s41598-020-57910-1 .
null
Comber A Zeng W2019.Spatial interpolation using areal features: a review of methods and opportunities using new forms of data with coded illustrations[J].Geography Compass13(10): 1-23.DOI: 10.1111/gec3.12465 .
null
Guo B B Zhang J Xu T B, et al, 2022.Assessment of multiple precipitation interpolation methods and uncertainty analysis of hydrological models in Chaohe River basin, China[J].Water SA48(3): 324-334.DOI: 10.17159/wsa/2022.v48.i3.3884 .
null
Hofstra N New M McSweeney C2010.The influence of interpolation and station network density on the distributions and trends of climate variables in gridded daily data[J].Climate Dynamics35(5): 841-858.DOI: 10.1007/s00382-009-0698-1 .
null
Hutchinson M F1991.The application of thin plate splines to continent-wide data assimilation, data assimilation systems, BMRC Research Report NO.27[M].Melbourne: Bureau of Meteorology.
null
Hutchinson M F2004.ANUSPLIN version 4.3 user guide[M].Canberra: The Australia National University, Center for Resource and Environment Studies.
null
Lassegues P2018.Daily and climatological fields of precipitation over the western Alps with a high density network for the period of 1990-2012[J].Theoretical and Applied Climatology131(1/2): 1-17.DOI: 10.1007/s00704-016-1954-z .
null
Ozturk D Kilic F2016.Geostatistical approach for spatial interpolation of meteorological data[J].Anais da Academia Brasileira de Ciências88(4): 2121-2136.DOI: 10.1590/0001-3765201620150103 .
null
Zhang M J Wang S J2016.A review of precipitation isotope studies in China: Basic pattern and hydrological process[J].Journal of Geographical Sciences26(7): 921-938.DOI: 10.1007/s11442-016-1307-y .
null
陈碧珊, 潘安定, 杨木壮, 2010. 近 50年柴达木盆地气候要素分布特征及变化趋势分析[J].干旱区资源与环境, 24(5): 117-123.DOI: 10.13448/j.cnki.jalre.2010.05.006.Chen B S
null
Pan A D Yang M Z2010.Spatial and temporal characteristics and change trend of climatic elements of Qaidam basin in recent 50 years[J].Journal of A rid Land Resources and Environment24(5): 117-123.DOI: 10.13448/j.cnki.jalre.2010.05.006 .
null
陈金雨, 陶辉, 刘金平, 等, 2021.中巴经济走廊极端降水时空变化[J].高原气象40(5): 1048-1056.DOI: 10.7522/j.issn.1000-0534.2020.00103.Chen J Y
null
Tao H Liu J P, et al, 2021.Temporal and spatial variations of extreme precipitation in China-Pakistan economic corridor[J].Plateau Meteorology40(5): 1048-1056.DOI: 10.7522/j.issn.1000-0534.2020.00103 .
null
陈荣, 段克勤, 尚溦, 等, 2023.基于CMIP6模式数据的1961-2099年青藏高原降水变化特征分析[J].高原气象42(2): 294-304.DOI: 10.7522/j.issn.1000-0534.2021.00084.Chen R
null
Duan K Q Shang W, et al, 2023.Characteristics of precipitation change over the Qinghai-Xizang Plateau from 1961 to 2099 based on CMIP6 models[J].Plateau Meteorology42(2): 294-304.DOI: 10.7522/j.issn.1000-0534.2021.00084 .
null
戴升, 申红艳, 李林, 等, 2013.柴达木盆地气候由暖干向暖湿转型的变化特征分析[J].高原气象32(1): 211-220.DOI: 10.7522/j.issn.1000-0534.2012.00021.Dai S
null
Shen H Y Li L, et al, 2013.Analysis on climatic transition characteristic from warm-dry to warm-wet in Tsaidam Basin[J].Plateau Meteorology32(1): 211-220.DOI: 10.7522/j.issn.1000-0534.2012.00021 .
null
党学亚, 常亮, 卢娜, 2019.青藏高原暖湿化对柴达木水资源与环境的影响[J].中国地质46(2): 359-368.
null
Dang X Y Chang L Lu N2019.The impact of climatic warm-wet situation of the Tibetan Plateau on the water resources and environment in Qaidam Basin[J].Geology In China46(2): 359-368.
null
杜玉娥, 刘宝康, 贺卫国, 等, 2018.1976-2017年柴达木盆地湖泊面积变化及其成因分析[J].冰川冻土40(6): 1275-1284.
null
Du Y E Liu B K He W G, et al, 2018.Analysis on the variation and cause of the lake area in Qaidam Basin from 1976 to 2017[J].Journal of Glaciology and Geocryology40(6): 1275-1284.
null
傅小城, 王芳, 王浩, 等, 2011.柴达木盆地气温降水的长序列变化及与水资源关系[J].资源科学33(3): 408-415.
null
Fu X C Wang F Wang H, et al, 2011.Analysis of long-term changes in temperature and precipitation and their relationships with water resources in the Qaidam Basin in China[J].Resources Science33(3): 408-415.
null
葛根巴图, 魏巍, 张晓, 等, 2020.柴达木盆地极端气候时空趋势及周期特征[J].干旱区研究37(2): 304-313.DOI: 10.13866/j.azr.2020.02.04.Gegen B T
null
Wei W Zhang X, et al, 2020.Spatiotemporal trends and periodic features of climate extremes over the Qaidam Basin, China during 1960-2014[J].Arid Zone Research37(2): 304-313.DOI: 10.13866/j.azr.2020.02.04 .
null
韩廷芳, 祁栋林, 陈宏松, 等, 2019.柴达木盆地降水的时空分布特征[J].沙漠与绿洲气象13(2): 69-75.
null
Han T F Qi D L Chen H S, et al, 2019.Spatial and temporal distribution of precipitation in Qaidam Basin[J].Desert and Oasis Meteorology13(2): 69-75.
null
贾洋, 崔鹏, 2018.高山区多时间尺度Anusplin气温插值精度对比分析[J].高原气象37(3): 757-766.DOI: 10.7522/j.issn.1000-0534.2017.00072.Jia Y
null
Cui P2018.Contrastive analysis of temperature interpolation at different time scales in the Alpine Region by Anusplin[J].Plateau Meteorology37(3): 757-766.DOI: 10.7522 / j.issn.1000-0534.2017.00072 .
null
李林, 申红艳, 李红梅, 等, 2015.柴达木盆地气候变化的区域显著性及其成因研究[J].自然资源学报30(4): 641-650.DOI: 10.11849/zrzyxb.2015.04.010.Li L
null
Shen H Y Li H M, et al, 2015.Regional differences of climate change in Qaidam Basin and its contributing factors[J].Journal of Natural Resources30(4): 641-650.DOI: 10.11849/zrzyxb.2015.04.010 .
null
李任君, 高懋芳, 李强, 等, 2019.基于ANUSPLIN的降水空间插值方法研究[J].中国农业信息31(1): 48-57.DOI: 10.12105/j.issn.1672-0423.20190105.Li R J
null
Gao M F Li Q, et al, 2019.Research on rainfall spatial interpolation method based on ANUSPLIN[J].China Agricultural Informatics31(1): 48-57.DOI: 10.12105/j.issn.1672-0423.20190105 .
null
李新, 程国栋, 卢玲, 2003.青藏高原气温分布的空间插值方法比较[J].高原气象22(6): 565-573.
null
Li X Cheng G D Lu L2003.Comparison study of spatial interpolation methods of air temperature over Qinghai-Xizang Plateau[J].Plateau Meteorology22(6): 565-573.
null
李月臣, 何志明, 刘春霞, 2014.基于台站观测数据的气温空间化方法评述[J].地理科学进展33(8): 1019-1028.DOI: 10.11820/dlkxjz.2014.08.002.Li Y C
null
He Z M Liu C X2014.Review on spatial interpolation methods of temperature data from meteorological stations[J].Progress in Geography33(8): 1019-1028.DOI: 10.11820/dlkxjz.2014.08.002 .
null
刘志红, Li L T McVicar T R, 等, 2008.专用气候数据空间插值软件ANUSPLIN及其应用[J].气象34(2): 92-100.
null
Liu Z H Li L T McVicar T R, et al, 2008.Introduction of the professional interpolation software for meteorology data: ANUSPLINN[J].Meteorological Monthly34(2): 92-100.
null
卢娜, 2014.柴达木盆地湖泊面积变化及影响因素分析[J].干旱区资源与环境28(8): 83-87.DOI: 10.13448/j.cnki.jalre. 2014.08.017.Lu N , 2014.Changes of lake area in Qaidam basin and the influence factors[J].Journal of Arid Land Resources and Environment, 28(8): 83-87.DOI: 10.13448/j.cnki.jalre. 2014.08.017 .
null
马佳宁, 高艳红, 2019. 近 50年黄河上游流域年均降水与极端降水变化分析[J].高原气象, 38(1): 124-135.DOI: 10.7522 / j.issn.1000-0534.2018.00126.Ma J N
null
Gao Y H2019.Analysis of annual precipitation and extreme precipitation change in the upper Yellow River basin in recent 50 years[J].Plateau Meteorology38(1): 124-135.DOI: 10.7522 / j.issn.1000-0534.2018.00126 .
null
马诺, 唐冶, 常存, 等, 2020.基于DEM的气温空间插值方法比较[J].干旱气象38(3): 465-471.DOI: 10.11755 / j.issn.1006-7639(2020)-03-0465.Ma N
null
Tang Y Chang C, et al, 2020.Comparation of spatial interpolation methods of temperature based on DEM data[J].Journal of Arid Meteorology38(3): 465-471.DOI: 10.11755 / j.issn.1006-7639(2020)-03-0465 .
null
梅晓丹, 李丹, 王强, 等, 2021.基于ANUSPLIN的小兴安岭地区降水格点数据空间插值[J].测绘与空间地理信息44(12): 6-10.
null
Mei X D Li D Wang Q, et al, 2021.Spatial interpolation of precipitation grid data in Xiaoxing'anling region based on ANUSPLIN[J].Geomatics & Spatial Information Technology44(12): 6-10.
null
孟清, 白红英, 郭少壮, 2020.基于Anusplin秦岭地区近50多年来的降水时空变化[J].水土保持研究27 (2): 206-212.DOI: 10.13869/j.cnki.rswc.20191018.001.Meng Q
null
Bai H Y Guo S Z2020.Spatial-temporal variation of precipitation in Qinling area in recent 50 Years based on Anusplin[J].Research of Soil and Water Conservation27(2): 206-212.DOI: 10.13869/j.cnki.rswc.20191018.001 .
null
彭旺, 李琼, 魏加华, 等, 2022.柴达木盆地东北缘山区和平原区雨滴谱特征对比研究[J].高原气象41(6): 1471-1480.DOI: 10.7522/j.issn.1000-0534.2021.00122.Peng W
null
Li Q Wei J H, et al, 2022.The mountainous and plain areas on the northeastern margin of the Qaidam Basin contrast study on raindrop spectrum characteristics[J].Plateau Meteorology41(6): 1471-1480.DOI: 10.7522/j.issn.1000-0534.2021.00122 .
null
邱美娟, 刘布春, 刘园, 等, 2020.中国北方苹果主产省降水分布特征分析[J].中国农业气象41(5): 263-274.DOI: 10.3969/j.issn.1000-6362.2020.05.001.Qiu M J
null
Liu B C Liu Y, et al, 2020.Analysis on distribution characteristics of precipitation in major production provinces of apple in northern China[J].Chinese Journal of Agrometeorology41(5): 263-274.DOI: 10.3969/j.issn.1000-6362.2020.05.001 .
null
时兴合, 赵燕宁, 戴升, 等, 2005.柴达木盆地40多年来的气候变化研究[J].中国沙漠25(1): 125-130.
null
Shi X H Zhao Y N Dai S, et al, 2005.Research on climatic change of Qaidam Basin since 1961[J].Journal of Desert Research25(1): 125-130.
null
谭剑波, 李爱农, 雷光斌, 2016.青藏高原东南缘气象要素Anusplin和Cokriging空间插值对比分析[J].高原气象35(4): 875-886.DOI: 10.7522/j.issn.1000-0534.2015.00037.Tan J B
null
Li A N Lei G B2016.Contrast on Anusplin and Cokriging meteorological spatial interpolation in southeastern margin of Qinghai-Xizang Plateau[J].Plateau Meteorology35(4): 875-886.DOI: 10.7522/j.issn.1000-0534.2015.00037 .
null
王澄海, 张晟宁, 张飞民, 等, 2021.论全球变暖背景下中国西北地区降水增加问题[J].地球科学进展36(9): 980-989.DOI: 10.11867/j.issn.1001-8166.2021.087.Wang C H
null
Zhang S N Zhang F M, et al, 2021.On the increase of precipitation in the northwestern China under the global warming[J].Advances in Earth Science36(9): 980-989.DOI: 10.11867/j.issn.1001-8166.2021.087 .
null
王新宇, 黄鹏程, 2020.基于GIS的气象要素插值方法比较研究[J].测绘与空间地理信息43(5): 167-170.
null
Wang X Y Huang P C2020.Comparative study of interpolation methods of meteorological factors based on GIS[J].Geomatics & Spatial Information Technology43(5): 167-170.
null
王远征, 马启民, 贾晓鹏, 2023.柴达木盆地灌木林地和高寒草甸蒸散发特征研究[J].高原气象42(3): 785-794.DOI: 10.7522/j.issn.1000-0534.2022.00055.Wang Y Z
null
Ma Q M Jia X P2023.Evapotranspiration characteristics of shrub land and alpine meadow in Qaidam Basin[J].Plateau Meteorology42(3): 785-794.DOI: 10.7522/j.issn.1000-0534.2022.00055 .
null
张春雨, 刘爱利, 吕嫣冉, 等, 2023.基于CMIP6青藏高原腹地气候模拟评估及时空分析[J].高原气象42(5): 1144-1159.DOI: 10.7522/j.issn.1000-0534.2022.00104.Zhang C Y
null
Liu A L Y R, et al, 2023.Spatial-temporal analysis and assessment of CMIP6 based climate simulation over the Qinghai-Xizang (Tibet) Plateau's hinterland[J].Plateau Meteorology42(5): 1144-1159.DOI: 10.7522/j.issn.1000-0534.2022.00104 .
null
张仁平, 张云玲, 郭靖, 等, 2018.新疆地区降水分布的空间插值方法比较[J].草业科学35(3): 521-529.DOI: 10.11829/j.issn.1001-0629.2016-0608.Zhang R P
null
Zhang Y L Guo J, et al, 2018.Comparison of spatial interpolation methods for precipitation distribution in Xinjiang region[J].Pratacultural Science35(3): 521-529.DOI: 10.11829/j.issn.1001-0629.2016-0608 .
null
张玮玮, 张眉, 吴杨, 等, 2020.复杂地形下浙江夏季气候要素空间插值方法评价[J].干旱气象38(4): 674-682.DOI: 10.11755/ j.issn.1006-7639(2020)-04-0674.Zhang W W
null
Zhang M Wu Y, et al, 2020.Evaluation of spatial interpolation method about climatic elements in summer in Zhejiang province under complex topography[J].Journal of Arid Meteorology38(4): 674-682.DOI: 10.11755/ j.issn.1006-7639(2020)-04-0674 .
Outlines

/