

1 引言
2 数据来源与方法介绍
2.1 研究区概况
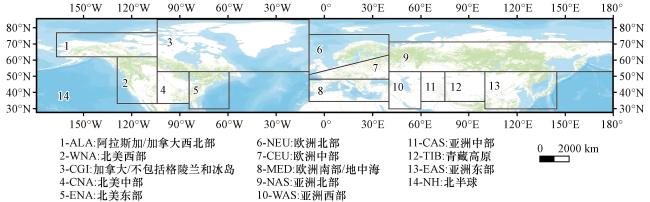
表1 研究区及子区域范围信息Table 1 Details on the study area and subregion boundaries |
| 序号 | 区域简称(全称) | 中文名称 | 纬度范围 | 经度范围 |
|---|---|---|---|---|
| 1 | ALA (Alaska/North West Canada) | 阿拉斯加/加拿大西北部 | 60°N -72.6°N | 168°W -105°W |
| 2 | WNA (West North America) | 北美西部 | 28.6°N -60°N | 130°W -105°W |
| 3 | CGI (Canada/not include Greenland/iceland) | 加拿大/不包括格陵兰和冰岛 | 50°N -85°N | 105°W -10°W |
| 4 | CAN (Central North America) | 北美中部 | 28.6°N -50°N | 105°W -85°W |
| 5 | ENA (East North America) | 北美东部 | 25°N -50°N | 85°W -60°W |
| 6 | NEU (North Europe) | 欧洲北部 | 48°N -75°N | 10°W -40°E |
| 7 | CEU (Central Europe) | 欧洲中部 | 45°N -61.3°N | 10°W -40°E |
| 8 | MED (South Europe/Mediterranean) | 欧洲南部/地中海 | 30°N -45°N | 10°W -40°E |
| 9 | NAS (North Asia) | 亚洲北部 | 50°N -70°N | 40°E -180°E |
| 10 | WAS (West Asia) | 亚洲西部 | 15°N -50°N | 40°E -60°E |
| 11 | CAS (Central Asia) | 亚洲中部 | 30°N -50°N | 60°E -75°E |
| 12 | TIB (Tibetan Plateau) | 青藏高原 | 30°N -50°N | 75°E -100°E |
| 13 | EAS (East Asia) | 亚洲东部 | 20°N -50°N | 100°E -145°E |
| 14 | NH (Northern Hemisphere) | 北半球 | 25°N -90°N | - |
2.2 观测数据
2.3 模式数据
表2 CMIP6中20个全球气候模式的基本信息Table 2 Essential information on the 20 global climate models used in CMIP6 |
| 研究机构 | 模式 | 分辨率(经向×纬向) | 历史时期 | 未来时期 |
|---|---|---|---|---|
| 国家(北京)气候中心(BCC) | BCC-CSM2-MR | 1.125°×1.12° | √ | √ |
| BCC-ESM1 | 2.81°×2.81° | √ | - | |
| 加拿大环境署(CCCma) | CanESM5 | 2.81°×2.81° | √ | √ |
| CanESM5-CanOE | 2.81°×2.81° | √ | √ | |
| 美国国家大气科学研究中心(NCAR) | CESM2 | 1.25°×0.9° | √ | √ |
| CESM2-FV2 | 2.5°×1.9° | √ | - | |
| CESM2-WACCM | 1.25°×0.9° | √ | √ | |
| CESM2-WACCM-FV2 | 2.5°×1.9° | √ | - | |
| 中国科学院大气物理研究所 CasESM 研发团队(CAS) | FGOALS-f3-L | 1.25°×1° | √ | √ |
| FGOALS-g3 | 2°×2.5° | √ | √ | |
| 美国宇航局戈德空间研究所(NASA-GISS) | GISS-E2-1-G | 2.5°×2° | √ | √ |
| GISS-E2-1-H | 2.5°×2° | √ | - | |
| 日本海洋地球科学与技术处(MIROC) | MIROC6 | 1.4°×1.4° | √ | √ |
| MIROC-ES2L | 2.81°×2.81° | √ | √ | |
| 马普气象研究所(MPI-M) | MPI-ESM-1-2-HAM | 1.875°×1.9° | √ | - |
| MPI-ESM1-2-HR | 0.9°×0.9° | √ | √ | |
| MPI-ESM1-2-LR | 1.875°×1.9° | √ | √ | |
| 日本气象局气象研究所(MRI) | MRI-ESM2-0 | 1.125°×1.125° | √ | √ |
| 挪威气候中心(NCC) | NorESM2-LM | 2.5°×1.9° | √ | √ |
| NorESM2-MM | 1.25°×0.9° | √ | √ |
符号“√”表示该模型在本文中被使用, 而符号“-”表示该模型在本文中未被使用; 未来时期包括SSP1-2.6、 SSP2-4.5和SSP5-8.5情景。(The symbol “√” indicates that the model was used in this paper, while the symbol “-” indicates that the model was not used in this paper.Future periods include the SSP1-2.6, SSP2-4.5 and SSP5-8.5 scenarios) |
2.4 气候数据
2.5 方法介绍
2.5.1 泰勒图和泰勒技巧评分
2.5.2 趋势分析和相对偏差
3 结果分析
3.1 北半球历史积雪时空变化
3.1.1 北半球积雪覆盖度的空间变化特征
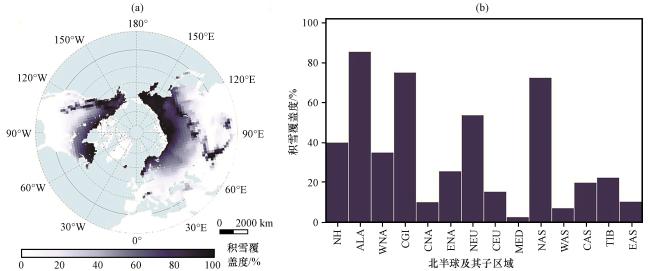
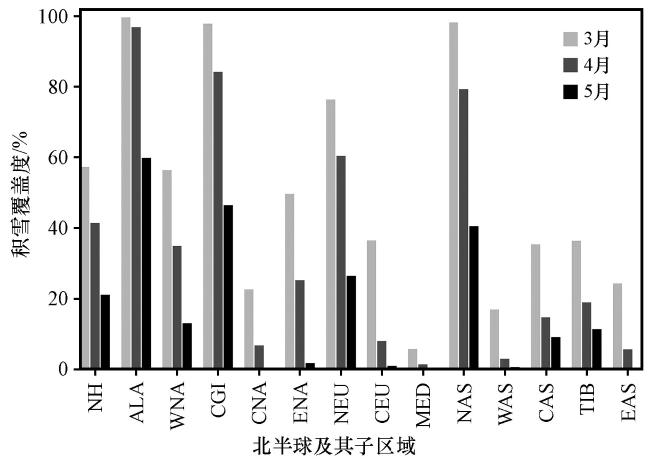
图2 观测数据1982 -2014年北半球春季(3 -5月)多年平均积雪覆盖度空间分布(单位: %)(a)观测数据多年平均积雪覆盖度空间分布示意图, (b)北半球及子区域多年平均积雪覆盖度的统计图 Fig.2 Visual representation of multi-year average snow cover extent during spring in the Northern Hemisphere based on observations from 1982 to 2014.Unit: %.(a) Spatial distribution diagram of annual mean snow cover of observed data, (b) Statistical map of annual mean snow cover in the Northern Hemisphere and subregions |
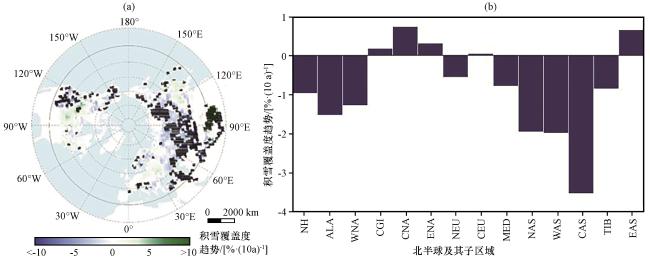
图3 观测数据1982 -2014年北半球春季(3 -5月)积雪覆盖度变化趋势空间分布[单位: %·(10a)-1](a)北半球积雪覆盖度变化趋势空间分布示意图, (b)北半球及子区域积雪覆盖度变化趋势; 图中黑色阴影表示该地区的趋势通过0.05显著性水平检验 Fig.3 Depiction of trends in snow cover extent changes during spring in the Northern Hemisphere from 1982 to 2014.Unit: %·(10a)-1.(a) Spatial distribution diagram of snow cover change trend in Northern hemisphere, (b) Variation trend of snow cover in Northern hemisphere and sub-regions.The black shadow in the figure indicates that the trend in this region passes the 0.05 significance level test |
表3 观测数据1982 -2014年北半球春季(3 -5月)积雪覆盖度变化趋势分类表Table 3 Classification table detailing trends in spring snow cover changes in the Northern Hemisphere from 1982 to 2014 based on observations |
| 变化趋势 | 检验标准(双尾, α=0.05) | 面积百分比/% |
|---|---|---|
| 显著增加 | SLOPE > 0, t > t α | 3.92 |
| 不显著增加 | SLOPE > 0, t ≤ t α | 27.71 |
| 显著减少 | SLOPE < 0, t > t α | 23.85 |
| 不显著减少 | SLOPE < 0, t ≤ t α | 44.52 |
3.1.2 北半球积雪覆盖度的时间变化特征
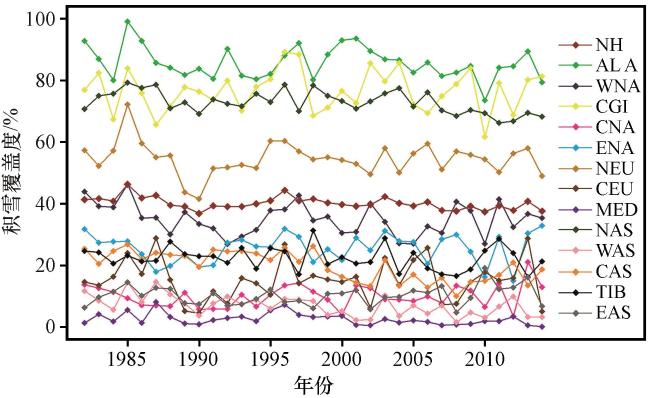
3.2 CMIP6模式模拟积雪覆盖度的能力评估
3.2.1 积雪覆盖度空间分布的评估
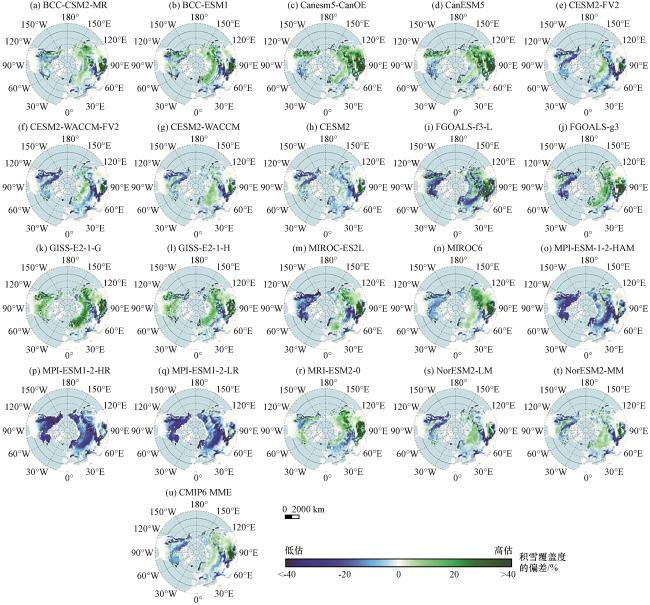
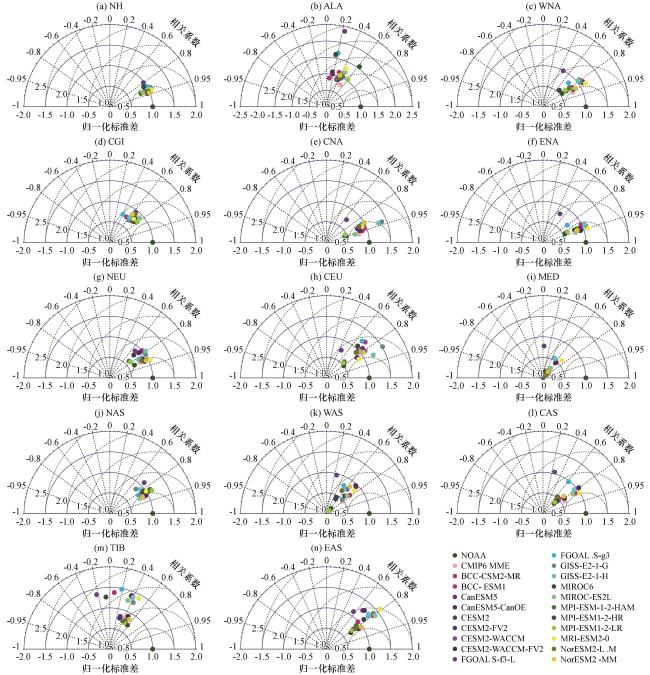
图7 CMIP6气候模式数据1982 -2014年春季北半球和13个子区域的空间泰勒图距原点的距离(即半径)表示归一化的标准差; 辐射线(即角度)表示相关系数; 距参考点的距离表示均方根误差 Fig.7 resents spatial Taylor diagrams depicting the performance of CMIP6 climate models for spring (1982 -2014) in the Northern Hemisphere and its 13 subregions.The distance from the origin (i.e.radius) represents the normalized standard deviation; The radiation (i.e., the Angle) represents the correlation coefficient; The distance from the reference point represents the root-mean-square error |
3.2.2 积雪覆盖度年际变化趋势的评估
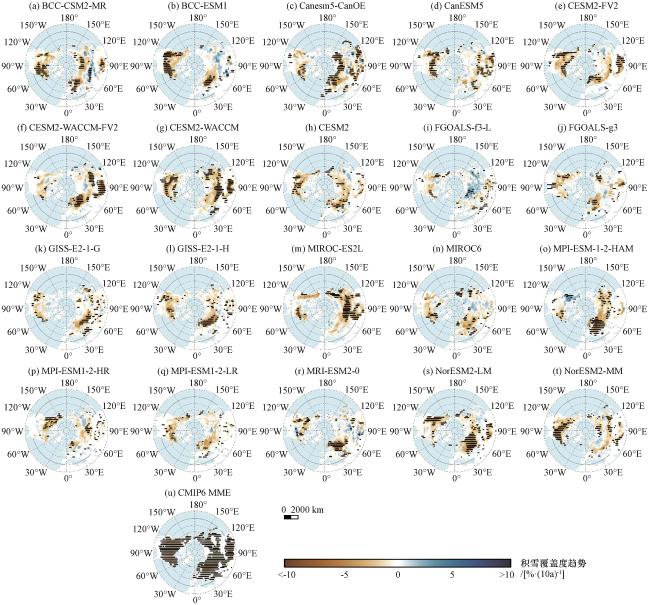
图9 CMIP6各模式及CMIP6 MME和NOAA观测的1982 -2014年春季积雪覆盖度变化趋势空间分布图中黑色阴影表示该地区的趋势通过0.05显著性水平检验 Fig.9 Depicts the spatial distribution of trends in spring snow cover changes (1982 -2014) for individual CMIP6 models, the ensemble, and NOAA observations.The black shaded areas indicate statistically significant trends at the 0.05 confidence level |
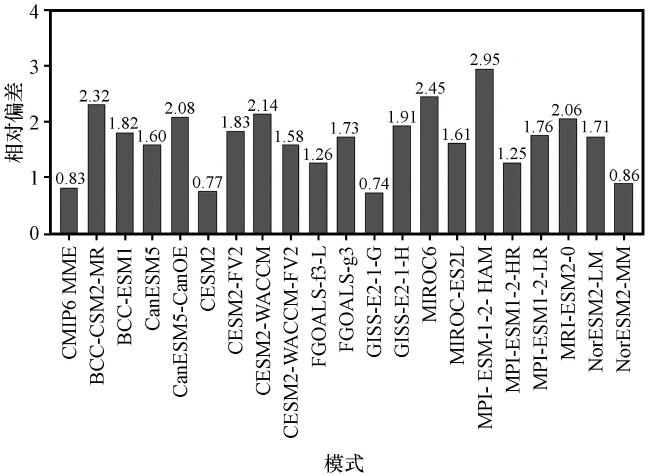
3.3 不同情景下未来北半球春季积雪覆盖度的预估
3.3.1 21 世纪末期较历史时期北半球春季积雪覆盖度的空间变化特征
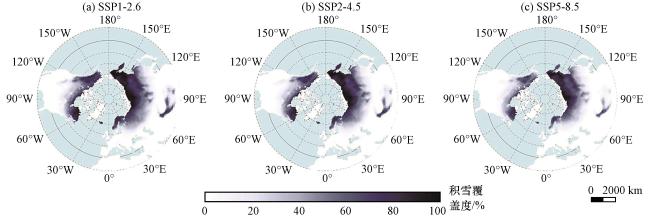
图11 与历史时期(1982 -2014年)相比, 不同排放情景下CMIP6 MME模拟的未来2067 -2099年北半球春季积雪覆盖度(单位: %)变化的空间格局Fig.11 Highlights spatial patterns of projected spring snow cover (unit: %) changes (2067 -2099) in the Northern Hemisphere under different emission scenarios, comparing to the historical period (1982 -2014) |
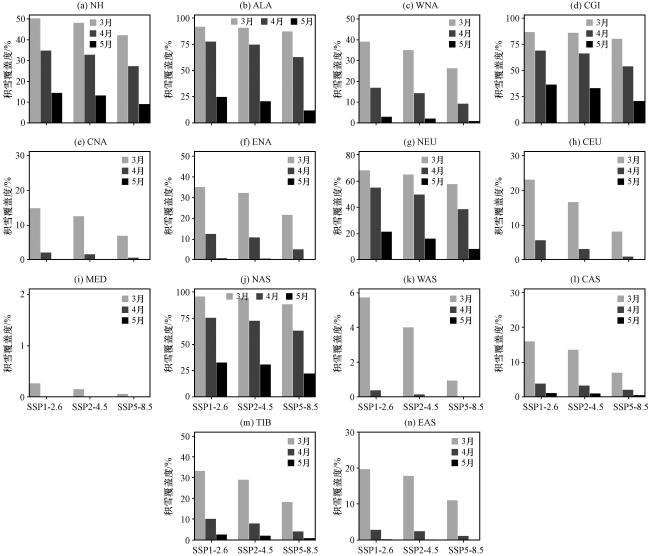
3.3.2 2015 -2099年北半球春季积雪覆盖度的时间变化特征
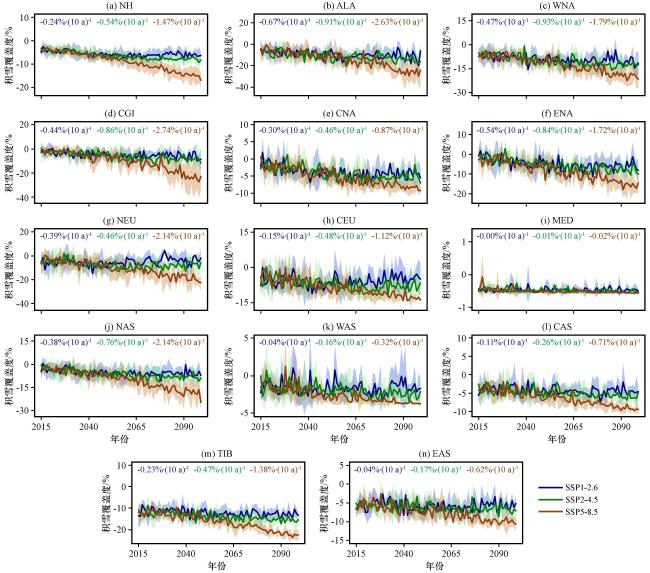
图13 与历史时期(1982 -2014年)相比, 不同情景下CMIP6 MME模拟的未来时期(2015 -2099年)北半球春季积雪覆盖度变化时间序列Fig.13 Presents time series data illustrating future changes in spring snow cover extent (2015 -2099) in the Northern Hemisphere simulated by the CMIP6 multi-model ensemble under different scenarios, compared to the historical period (1982 -2014) |
4 讨论
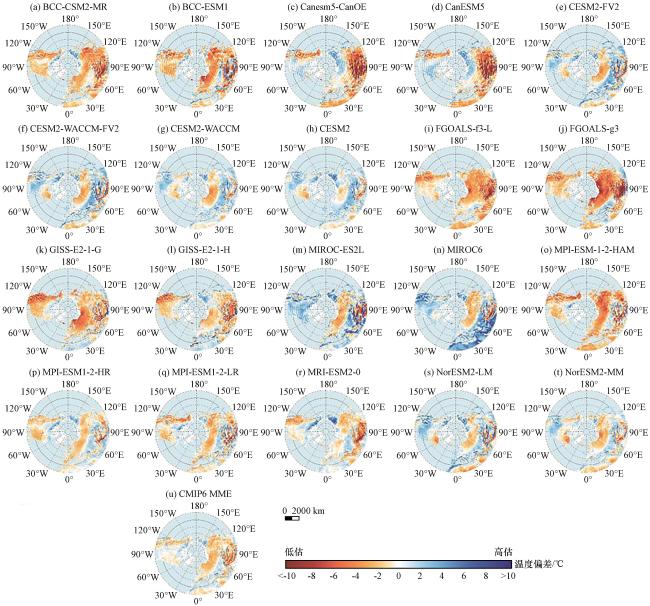
图14 1982-2014年北半球春季(3 -5月)CMIP6各模式和CMIP6 MME相对于CRU观测数据的温度偏差(单位: ℃)的空间分布Fig.14 Depicts spatial distribution of temperature deviations (unit: ℃) during spring (1982 -2014) in the Northern Hemisphere for individual CMIP6 models and the multi-model ensemble relative to CRU observations |
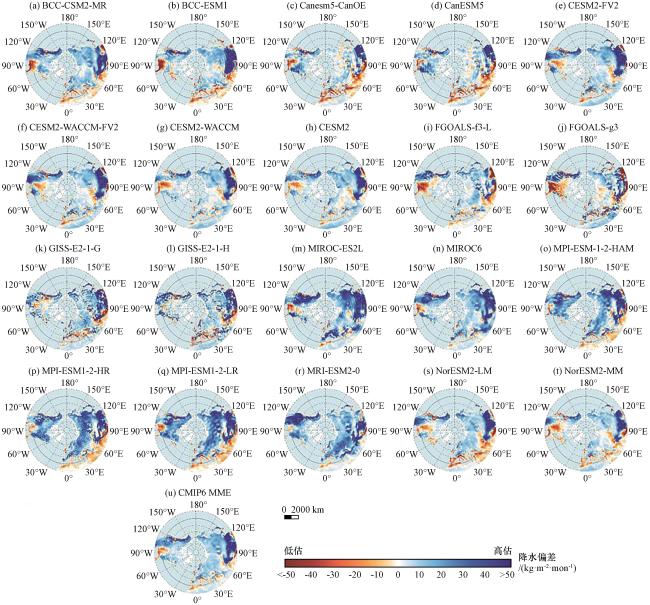


图15 1982 -2014年北半球春季(3 -5月)CMIP6各模式和CMIP6 MME相对于CRU观测数据的降水偏差(单位: kg·m-2·mon-1)的空间分布Fig.15 Presents spatial distribution of precipitation deviations (unit: kg·m-2·mon-1) during spring (1982 -2014) in the Northern Hemisphere for individual CMIP6 models and the multi-model ensemble relative to CRU observations |