
1 引言
2 资料来源和方法介绍
2.1 资料来源
2.2 理查孙数
2.3 锋生函数
3 过程概况
3.1 天气情况
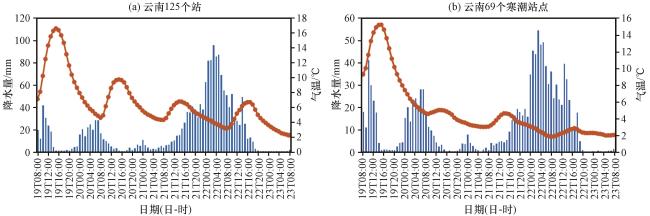
图1 2022年2月19日08:00至23日08:00云南(a)125个站和(b)其中69个寒潮站点累计逐时降水量和逐时平均气温变化Fig.1 The accumulated hourly precipitation and average temperature of 125 stations (a) and the 69 stations hit by cold surge (b) in Yunnan province from 08:00 on February 19 to 08:00 on February 23, 2022 |
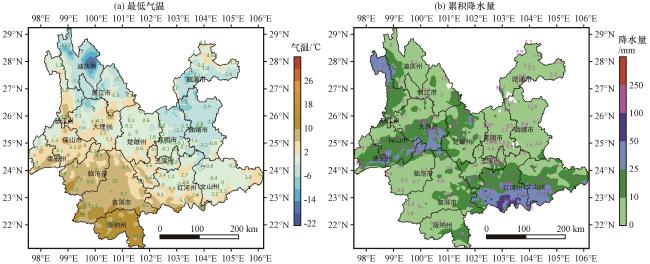
图2 云南省2022年2月19 -22日最低气温(a, 单位: ℃)及2022年2月19日08:00至22日08:00累积降水量(b, 单位: mm)分布Fig.2 The distribution of the minimum temperature during February 19 to 22, 2022 (a, unit: ℃) and the accumulated precipitation from 08:00 on February 19 to 08:00 on February 22, 2022 (b, unit: mm) |
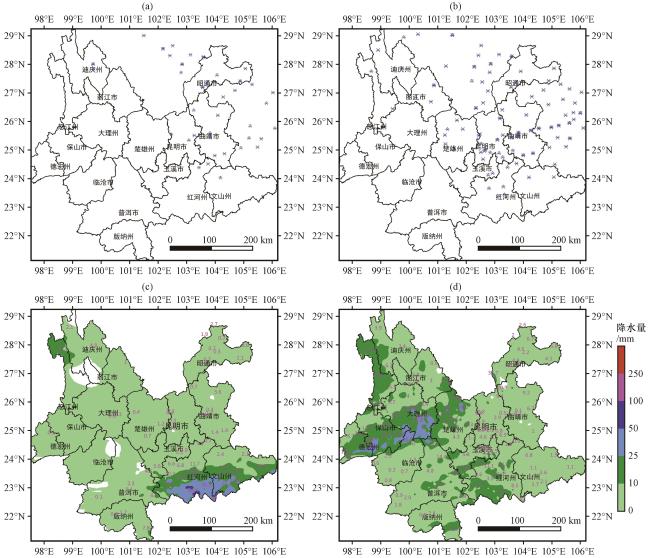
图3 云南省2022年2月19日08:00至21日08:00(a, c)和2月21日08:00至22日08:00(b, d)降雪站点(a, b, × - 为降雪, ×·- 为雨夹雪)和累积降水量(c, d, 单位: mm)分布粉色散点数字为云南125个国家站降水量 Fig.3 The distribution of snowfall stations (a, b, × - represents snowfall, ×·- sleet) and accumulative precipitation (c, d, unit: mm) in Yunnan province from 08:00 on February 19 to 08:00 on February 21, 2022 (a, c) and the period from 08:00 on February 21 to 08:00 on February 22, 2022 (b, d).In Fig.3 (c) and (d), the pink numbers show the accumulated precipitation amount at 125 stations |
3.2 对机场和航班的影响
表1 2022年2月18 -22日因天气原因造成云南机场航班异常情况Table 1 The impacts of adverse weather on aviation in Yunnan province from 18 to 22 February 2022 |
| 日期 | 延误 | 取消/备降 | 返航 | 颠簸/其他 |
|---|---|---|---|---|
| 18日 | 无 | 无 | 无 | 昆明机场收到2份航空器颠簸报告和1份低空风切变报告。 |
| 19日 | 无 | 无 | 无 | 昆明机场收到2份航空器中度颠簸报告, 预除冰100架次。 |
| 20日 | 无 | 无 | 无 | 昆明机场收到5份航空器颠簸报告。 |
| 21日 | 昆明机场多个航班因降雪天气起飞延误。 | 昭通机场因跑道积雪导致2个航班取消备降其他机场。 | 澜沧机场因低云影响导致1航班返航。 | 昆明机场收到2份颠簸报告、 1份轻度飞机积冰报告。 |
| 22日 | 文山机场因顺风、 低云延误航班2架次; 普洱机场因低云导致航班延误航班1架次。 | 因昆明机场降雪天气, 腾冲机场取消6个航班, 澜沧机场取消4个航班; 迪庆机场因降雪、 跑道结冰取消航班2架次。 | 芒市机场因航路雷雨天气导致1航班返航。 | 昆明机场收到4份颠簸报告和1份疑似雷击航空器报告。 |
4 过程环流特征
4.1 大尺度水平环流特征
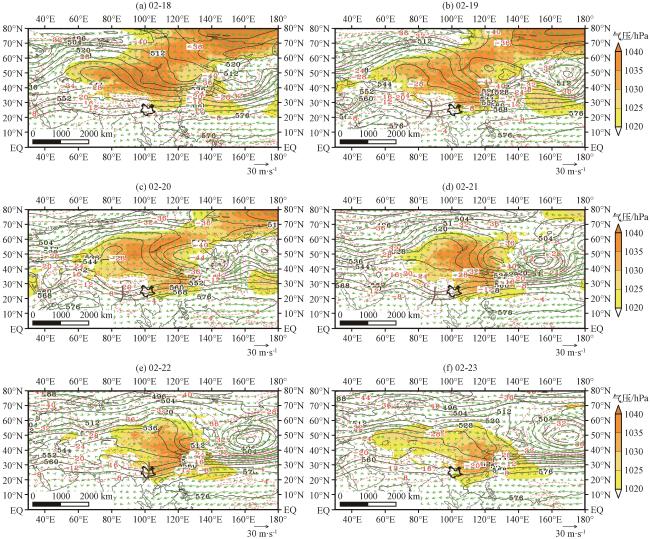
图4 2022年2月18 -23日环流形势彩色区为海平面气压超过1020 hPa的区域, 黑色等值线为500 hPa位势高度(单位: dagpm), 红色等值线为500 hPa温度场(单位: ℃), 矢量为850 hPa风矢量(单位: m·s-1), 棕色线段示意南支槽槽线 Fig.4 The daily atmospheric circulations from 18 to 23 February 2022.The color areas indicate the regions where sea level pressure exceeds 1020 hPa, black contours denote the geopotential height at 500 hPa (unit: dagpm), red isolines represent temperature field at 500 hPa (unit: ℃), vectors show wind fields at 850 hPa (unit: m·s-1), and the thick brown curves show the trough lines of the southern branch trough |
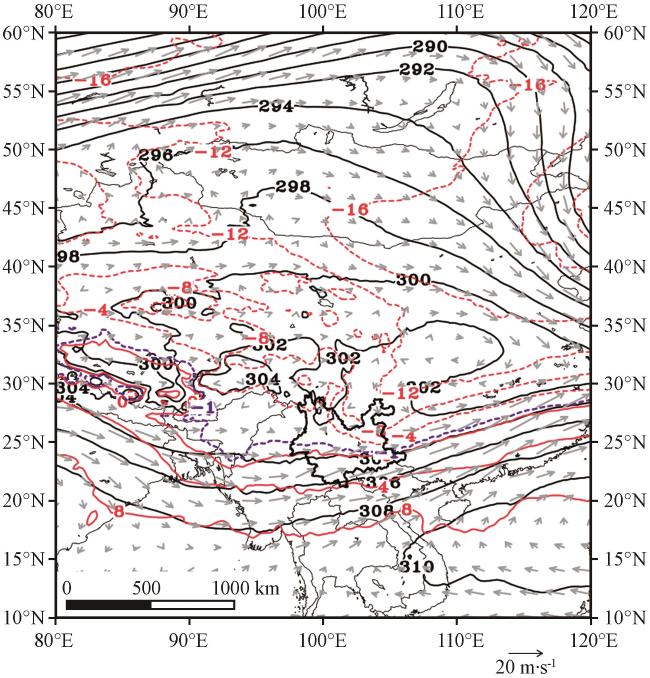
图5 2022年2月22日700 hPa环流场黑色等值线为位势高度, 矢量为风场, 红色等值线为气温, 其中紫色等值线为-1 ℃等温线 Fig.5 The atmospheric circulation at 700 hPa on 22 February 2022.The black contours denote geopotential height, vectors indicate wind, and red isolines represent temperature with the purple curves showing the -1 ℃ isotherm |
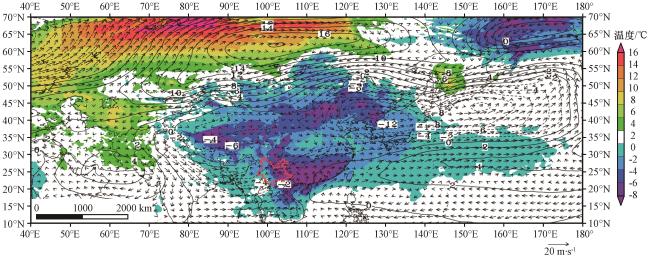
图6 2022年2月19 -22日环流距平形势分布彩色区域为地面温度距平, 黑色等值线为500 hPa位势高度距平, 黑色矢量为700 hPa风矢量距平 Fig.6 The circulation anomalies of the process from 19 to 22 February 2022.The color areas show surface temperature anomalies, black contour lines represent the geopotential height anomalies at 500 hPa, and the vectors denote wind anomalies at 700 hPa |
4.2 锋面活动分析
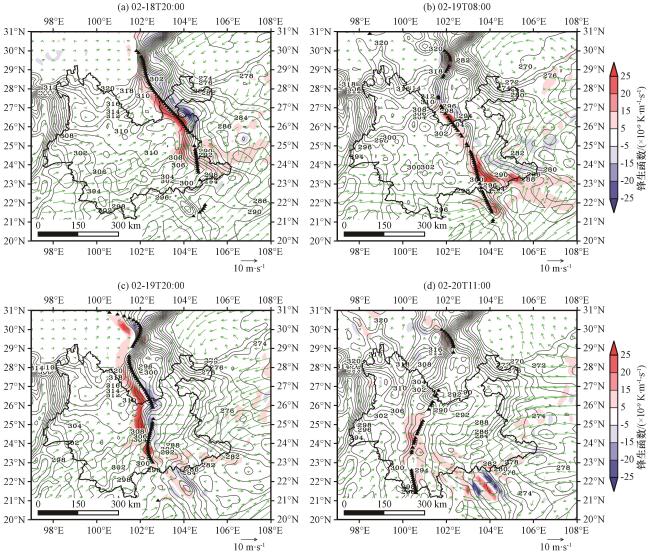
图7 2022年2月18日20:00(a), 19日08:00(b)、 19日20:00(c), 20日11:00(d) 800 hPa锋生函数(彩色区,单位:×10-9 K·m-1·s-1)、 位温(等值线,单位: K)、 水平风场(矢量,单位: m·s-1)和客观判识的锋线位置(黑色三角形所示,为切比雪夫5次拟合结果)Fig.7 The distributions of the frontogenesis function (color areas, unit: ×10-9 K·m-1·s-1), potential temperature (contour lines, unit: K), horizontal wind field (vector, unit: m·s-1) at 800 hPa and the frontal lines obtained by the objective technique (shown as the lines of black triangles, which are the results from 5-time Chebyshev fitting) at 20:00 on February 18 (a), 08:00 on February 19 (b), 20:00 on February 19 (c) and 11:00 on February 20 (d), 2022 |
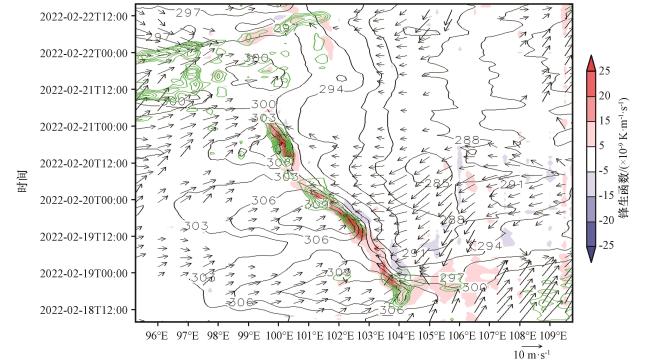
图8 过程期间800 hPa锋生函数(彩色区, 单位: ×10-9 K·m-1·s-1)、 位温(黑色等值线, 单位: K)、 水平风场(矢量, 单位: m·s-1, 图中仅显示纬向风速大于3 m·s-1的风矢量)和750 hPa垂直风场(绿色实线, 单位: Pa·s-1; 图中仅显示风速小于-0.5 Pa·s-1的等值线, 等值线间隔为0.2 Pa·s-1)沿24.5°N的经度-时间剖面Fig.8 The Longitude-time section along 24.5°N of the frontogenesis function (color areas, unit: ×10-9 K·m-1·s-1), potential temperature (black contour lines, unit: K), horizontal wind field (vector, unit: m·s-1, only showing those with zonal wind greater than 3 m·s-1) at 800 hPa, and the vertical velocity at 750 hPa (green solid line, unit: Pa·s-1, only showing those less than -0.5 hPa·s-1 with a 0.2 Pa·s-1 contour interval) during the process |
4.3 垂直环流特征
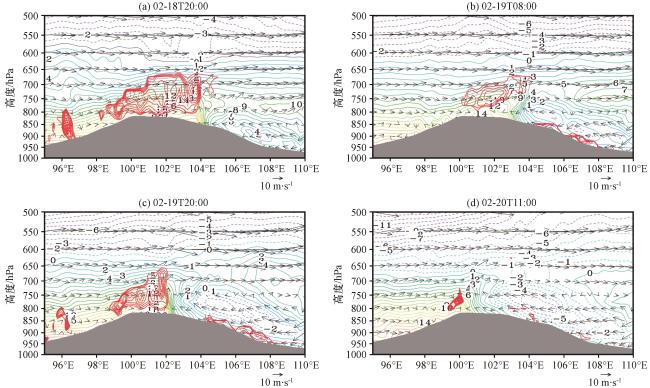
图9 2022年2月18日20:00(a), 19日08:00(b)、 19日20:00(c), 20日11:00 (d)气温(彩虹色等值线, 单位: ℃)、 风场(矢量, 单位: m·s-1, 垂直速度ω放大了10倍)和Ri (红色粗等值线, 图中Ri ≤5, 等值线间隔为1)沿24.5°N的经度-高度垂直剖面灰色阴影区为示意地形 Fig.9 The longitude-height sections of the temperature (contours in rainbow colors, unit: ℃), wind field (vector, unit: m·s-1, the vertical speed has been amplified by 10 times) and Ri (thick red isolines, the contour interal is 1) fields along 24.5°N at 20:00 on February 18 (a), 08:00 on February 19 (b), 20:00 on February 19 (c) and 11:00 on February 20 (d) 2022.The gray shaded areas indicate terrain |
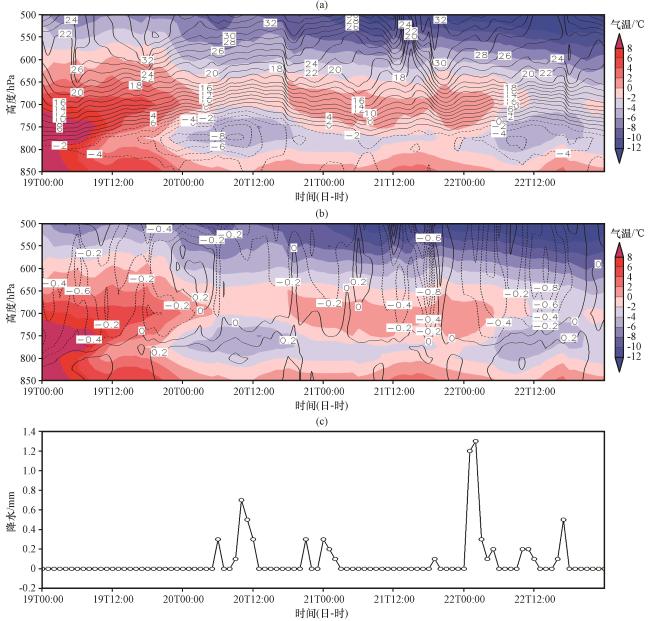
图10 2022年2月19日00:00至23日00:00弥勒基地附近(103.5°N, 24.5°E)上空气温(a~b, 彩色区, 单位: ℃)和纬向风速(a, 等值线, 单位: m·s-1)、 垂直速度(b, 等值线, 单位: Pa·s-1)的高度-时间剖面以及弥勒逐时降水量(c)Fig.10 The height-time sections of temperature (a~b, color area, unit: ℃) and zonal wind speed (a, contour line, unit: m·s-1), and vertical velocity (b, contour line, unit: Pa·s-1) near Mile station (103.5°N, 24.5°E), and the hourly precipitation at Mile station (c) from 00:00 on 19 to 00:00 on 23 February, 2022 |
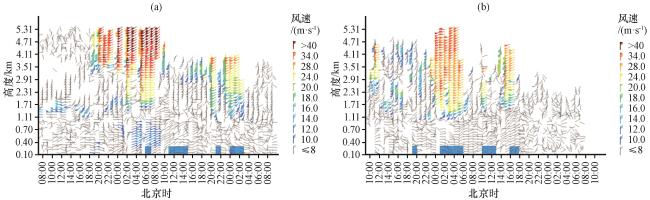
图11 2022年2月19日08:00至21日09:00(a)和21日10:00至23日07:00(b)弥勒基地风廓线雷达水平风观测结果横坐标上蓝色阴影区示意降水时段 Fig.11 The horizontal wind observation of the wind profile radar at Mile station (a) from 08:00 on February 19 to 09: 00 on February 21 (a) and the period from 10:00 on February 21 to 07:00 on February 23, 2022.The blue boxes on the horizontal axis indicate the precipitation spans |
5 结论

图12 寒潮过程第一阶段(a)和第二阶段(b)低空环流示意图蓝色和橙色虚线分别示意冷、 暖气团; 黑色箭头示意气流; 波纹示意Ri 小值区 Fig.12 Schematic diagrams of the low-level circulations in the first (a) and the second (b) stages.The areas enclosed by blue and orange dashed curves represent cold and warm air masses respectively; black arrows indicate airflow; waves show the areas where Ri numbers are small |