The Characteristics of Atmospheric Precipitable Water Vapor Distribution and Its Relationship with Precipitation over Tarim Basin and Its Surrounding Area

  • Jing LIU ,
  • Zhaoxu LIU ,
  • Lianmei YANG ,
  • Yushu ZHOU
Expand
  • 1. Institute of Desert Meteorology,China Meteorological Administration,Urumqi 830002,Xinjiang,China
    2. Xinjiang Cloud Precipitation Physics and Cloud Water Resources Development Laboratory,Urumqi 830002,Xinjiang,China
    3. Field Scientific Observation Base of Cloud Precipitation Physics in West Tianshan Mountains,Urumqi 830002,Xinjiang,China
    4. Center for Xinjiang lightning protection and disaster reduction,Urumqi 830002,Xinjiang,China
    5. Laboratory of Cloud-Precipitation Physics and Severe Storms,Institute of Atmospheric Physics,Chinese Academy of Science,Beijing 100029,China
    6. School of Earth and Planetary Sciences,University of Chinese Academy of Sciences,Beijing 100049,China

Received date: 2023-04-17

  Revised date: 2023-10-09

  Online published: 2023-10-09

Abstract

Using the precipitable atmospheric water vapor (PWV) data of 17 ground-based GPS remote sensing stations, hourly and daily precipitation data of 14 meteorological stations in Tarim Basin and its surrounding areas from July 2018 to June 2022, this study analyzed the PWV distribution characteristics and its relationship with precipitation in the western (region A) and the eastern (region B) part of Tarim basin.The results show that: (1) The average annual PWV is largest in the northern and southwestern plain areas of the basin, and the average annual PWV is inversely proportional to the altitude at stations with over 1300 m, while that concentrated on 10~12 mm at stations with altitude below 1300 m.The average PWV value in summer is twice than that in spring and autumn at all GPS stations.(2) The monthly distribution of PWV in region A and region B presents a unimodal type, with the peaks occurred in August and in July, respectively.On the rain-day and no-rain day in region A, the both peak value of PWV occurred at 23:00 (Beijing Time, after the same), While, the peak value of PWV occurred at 11:00 on rain-day and 17:00 on no-rain day in region B, respectively.(3) The peak of ΔPWV (PWV minus monhly mean PWV) at most stations occurred at 0~1 h before precipitation start time in region A, and within 1 h before and after precipitation in region B.In spring, the variation of PWV before the precipitation in region B is more severe than that in region A.In summer, there are more weather processes with σPWV (PWV divide monthly mean PWV) reached 1~1.8 times at 1 h and 5~6 h before the beginning of precipitation in region A and region B.In autumn and winter, The peak of σPWV are concentrated in 1.4~2.0 times and 1.6~2.4 times in region B, respectively.(4) At the end of precipitation in stations with altitude below 1400 m, the PWV value was concentrated in 10~20 mm during May to June and in 15~25 mm during July to August.In stations with altitude over 1400 m, the PWV value is increasing from 15~25 mm to 25~35 mm from May to August at the end of precipitation.

Cite this article

Jing LIU , Zhaoxu LIU , Lianmei YANG , Yushu ZHOU . The Characteristics of Atmospheric Precipitable Water Vapor Distribution and Its Relationship with Precipitation over Tarim Basin and Its Surrounding Area[J]. Plateau Meteorology, 2024 , 43(3) : 617 -634 . DOI: 10.7522/j.issn.1000-0534.2023.00083

1 引言

水汽是大气的重要组成部分, 也是降水产生的基本条件之一。大气中的水汽含量时空分布及其相变所产生的潜热, 对天气系统演变、 大气能量转换和区域水分平衡具有重要作用(李国平和黄丁发, 2004), 能影响着全球和局地区域天气气候系统的结构和演变。因而, 高精度、 高时空分辨率的水汽及其分析对于提高区域定量降水预报准确率、 加深对区域天气气候变化的研究具有重要意义。
在实际工作中, 通常用可降水量来表示单位截面大气柱中的水汽含量。大气可降水量直接无法测量, 常通过天基卫星反演或地基估算得出(苗运玲等, 2016李俊霞等, 2017)。目前常用的大气可降水量计算方法主要有探空资料比湿分层积分法、 GPS数据求解法、 地面经验关系式和再分析资料计算, 各种方法各有优劣势(杨青等, 2010陈宏等, 2014)。探空法的结果从理论上更可靠, 但探空站点个数和日探测次数都较少是其主要的缺点; 微波辐射计探测大气可降水量具有高时间分辨率的优势, 但仪器昂贵难以广泛应用(Liu et al, 2019)。卫星遥感技术具有较高时间和空间分辨率的特点(李光伟等, 2018), 但仅能获取探测晴空大气可降水量。地基GPS遥感大气水汽技术是20世纪90年代发展起来的一种大气观测手段, 具有全天候、 高精度等优点, 现已逐渐成为常规气象探测资料的有利补充(Duan et al, 1996)。应用GPS技术遥感大气水汽总量并分析其变化, 可为天气和气候模式提供重要的水汽信息(Rocken et al, 1995Baker et al, 2001李国平等, 2006), 能更好诊断分析暴雨期间水汽分布的精细变化。
在季风区地基GPS大气可降水量时空分布研究方面, 不同学者利用不同地区的地基GPS大气可降水量观测资料, 分析了GPS-PWV时空分布和变化特征(石小龙等, 2014潘卫华等, 2021), 给出了不同地区水汽的季节和日变化规律(程鹏等, 2022海云莎等, 2011付志康等, 2017), 指出PWV在有降水日和无降水日的变化差异(梁宏等, 2006)。这些研究提供了季风区GPS-PWV与降水关系, 可为空中云水资源评估、 短时强降水天气预报预警提供重要参考信息。在不同地形和天气环流影响下, 区域降水与水汽变化间的相互关系存在显著差异(万蓉和郑国光, 2008), 众多研究针对不同区域相继开展了大气可降水量(GPS-PWV)与降水关系的研究工作(曹云昌等, 2005楚艳丽等, 2007; 张端禹等, 2010), 指出大气可降水量(GPS-PWV)与降水关系密切, 降水量与GPS-PWV激增有较好关系, 且不同PWV阈值会影响到降水预报准确率(申乐琳等, 2010), 并利用地基GPS大气可降水量变化进行降水预报(Benevides et al, 2015)。
水汽含量是影响干旱区暴雨形成的关键因素之一(张家宝和邓子风, 1987史玉光, 2014; 刘晶等, 2019a), 近些年, 也有学者针对干旱区强降水过程进行过大气可降水量演变特征分析, 指出干旱区的PWV跃变过程与降水发生和结束也有较好对应关系(杨莲梅等, 2012), 给出强降水期间GPS-PWV水汽演变规律(刘晶和杨莲梅, 2017), 并揭示出暴雨期间大尺度水汽输送与局地水汽变化间具有密切联系(刘晶等, 2019a)。此外, 还有研究利用GPS-PWV资料研究了西天山伊犁河谷、 天山山区、 天山东段地区和塔中站大气可降水量变化特征, 给出了不同区域大气可降水量演变特征及其与降水的关系(刘晶等, 2019b; 苗运玲等, 2016), 指出了山区海拔对大气可降水量的影响(于晓晶等, 2019), 总结了局地水汽含量日变化规律(崔丽娜等, 2010), 为干旱区GPS-PWV研究和应用工作奠定了基础。
塔里木盆地西起帕米尔高原东麓, 东至罗布泊洼地, 与昆仑山北麓和天山南脉相接, 地势南高北低、 自西向东缓倾, 是我国最大的内陆盆地(金炯等, 1994)。塔里木盆地四周高山环绕, 盆地中央为塔克拉玛干沙漠, 拥有高山、 戈壁、 沙漠、 绿洲等陡峭地形和复杂下垫面, 由于深处大陆内部, 周围又有高山阻挡暖湿气流进入, 不受东亚夏季风的直接影响, 因而气候干燥、 雨量较少, 降水主要集中在夏季(杨莲梅等, 2006), 且降水季节性强, 是西北干旱区平均降水量最少的地区之一(姚俊强等, 2013)。高原季风和南亚季风均可直接和间接(Zhao et al, 2016)影响塔里木盆地夏季降水。当夏季高原季风偏强(弱), 南亚季风偏弱(强)时, 在二者共同作用下中亚对流层关键区中高层温度偏低(高), 其通过影响200 hPa纬向风、 500 hPa环流和整层水汽输送进一步影响塔里木盆地夏季降水(王天竺和赵勇, 2021)。由于暖湿气流受阻于天山山脉、 帕米尔高原、 昆仑山和喀喇昆仑山, 塔里木盆地大气水汽含量分布不均, 水汽的变化不仅影响着周边区域水资源系统的结构和演变, 更影响着干旱地区经济发展和人民生产生活。受观测资料时间序列短且观测站点少的影响, 以往的研究(崔丽娜等, 2010)仅针对塔里木盆地单站PWV日变化特征进行分析, 且高时空分辨率再分析资料的大气水汽含量产品在中昆仑山北坡地区适用性没有得到验证, 因而对于塔里木盆地及其周边地区大气可降水量分布特征及其与降水关系的研究相对较少。随着全球显著变暖及水循环加快, 干旱半干旱地区气候由暖干向暖湿转变(施雅风等, 2003), 要解决这一地区水资源和强降水分析预报问题, 需要厘清该地区大气可降水量时空分布特征及其与降水的关系。本文针对塔里木盆地及其周边地区17个地基GPS站点观测的2018年7月至2022年6月大气可降水量资料, 结合各站逐时及逐日降水实况观测, 分析极端干旱地区PWV时、 空分布和演变特征及其与降水关系, 为干旱区水分循环研究和降水分析预报奠定基础。

2 数据来源与方法介绍

2.1 数据来源和仪器介绍

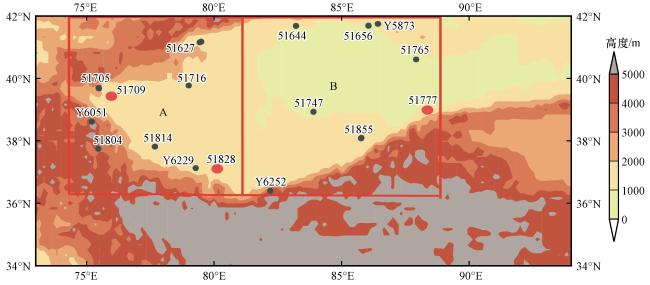
本研究所用资料包括2018年7月至2022年6月塔里木盆地及其周边区域等共17套(图1)GPS逐小时大气可降水量(GPS-PWV)资料、 和田、 喀什和若羌探空观测站每日08:00(北京时, 下同)和20:00高空探测资料、 ERA-5 0.25°×0.25°逐月再分析资料和新疆气象局整编的逐时与逐日(20:00至次日20:00)降水量观测数据。探空大气可降水量数据由美国怀俄明大学(University of Wyoming, UW)基于若羌站、 和田站和喀什站的探空观测资料计算得到RS-PWV, 下载地址http: //weather.uwyo.edu。和田站、 若羌站、 喀什站GPS站点和探空站同址(图1)。
图1 研究区地基GPS测站(黑点)和探空站(红点)分布

彩色区代表地形高度(单位: m), 红色点代表探空和地基GPS同址站点, A和B红色矩形区域分别为南疆西部地区和南疆东部区域水汽流入和流出计算区域

Fig.1 Distribution of ground-based GPS stations (black dots) and sounding stations (red dots) in study area.The colored area represents height (unit: m).The red dots denotes sounding and GPS stations with same location.The red rectangle A and B represent the calculation area of water vapor in and out for western and eastern part of southern Xinjiang area, respectively

地基GPS反演的大气可降水量的主要原理是通过大气延迟(ZTD)减去静力延迟项(ZHD)得到湿延迟项(ZWD)(李成才等, 1999), ZWD与大气可降水量之间可以建立严格的比例关系, 从而获得精确的大气可降水量。利用气压、 地理纬度、 海拔, 通过静力延迟模型可以得到精确的GPS静力延迟项(ZHD)。GPS湿项延迟转换为 PW 的精度主要是取决加权平均温度(Tm )的精度(李光伟等, 2022), 在实际工作中, Tm 主要通过两种途径来得到, 一是利用地面大气温度(Ts )等参量和Tm 的线性或非线性关系来估计, 二是利用大气模式数据或再分析资料的温湿数据采用数值积分法来计算, 两种方法计算的Tm 都具有不确定性, 进而也会影响GPS-PWV的反演结果(Wang et al, 2005)。此外, PW精度还受测定天顶湿延迟和转换模型本身的误差的影响(陈俊勇, 1998)。下文通过对比探空计算与地基GPS反演得到的PWV, 进而验证地基GPS-PWV在塔里木盆地的适用性。
为便于分析, 本文研究季节划分为春季(3 -5月), 夏季(6 -8月), 秋季(9 -11月), 冬季(12月至翌年2月); 另外, 为了进一步分析塔里木盆地及其周边区域GPS-PWV的时空变化特征, 将塔里木盆地及其周边区域地基GPS站点按照测站地形及气候分布特点划分为2个区域, 分别是南疆西部地区和南疆东部地区(李立, 1994), 其中南疆西部和东部分别有9个和8个地基GPS站点, 地基GPS仪器布设涵盖不同观测环境(高山、 绿洲、 戈壁和沙漠)、 不同海拔(海拔涵盖850~3300 m)的测站, 因而地基GPS遥感的大气可降水量在塔里木盆地具有较好的空间代表性, 站点经纬度和海拔见表1。在分析各个区域PWV变化特征的基础上, 根据新疆降水标准(肖开提·多莱特, 2005), 定义测站小时降水量≥0.1 mm为一有效降水时次, 并统计降水时次出现频率及出现时刻; 针对有降水(日降水量≥0.1 mm, 下同)的天气过程进行分析, 定义降水前后24 h内大气可降水量反演时次超过38 h(即观测小时数超过降水前后24 h观测总小时数80%)为一个有效降水观测日, 研究有、 无降水日PWV日变化的差异, 探寻降水前后PWV演变与降水的对应关系, 以期为降水预报提供参考。
表1 地基GPS站点信息

Table 1 The equipment information at ground-based GPS station

站名 站号 经度/(°E) 纬度/(°N) 海拔/m 站名 站号 经度/(°E) 纬度/(°N) 海拔/m
阿克陶县布伦口乡 Y6051 38.65 74.95 3320.4 库尔勒塔什店煤矿 Y5873 86.19 41.86 1129
塔什库尔干 51804 37.78 75.23 3093.7 于田皮什盖村 Y6252 82.05 36.51 2415
和田尕宗水库 Y6229 37.10 79.90 1393 铁干里克 51765 40.63 87.7 847.1
和田 51828 37.13 79.93 1374.7 若羌 51777 39.03 88.17 889.3
叶城 51814 37.92 77.4 1360 塔中 51747 39 83.66 1099
乌恰 51705 39.72 75.25 2177.5 且末 51855 38.15 85.55 1248.4
喀什 51709 39.47 75.98 1290.7 库尔勒 51656 41.75 86.13 932.7
巴楚 51716 39.8 78.57 1117.4 库车 51644 41.72 83.07 1082.9
乌什 51627 41.22 79.23 1396.7

2.2 相关性分析方法介绍

先通过计算探空大气可降水量(RS-PWV)和地基GPS大气可降水量(GPS-PWV)的平均偏差(Bias)、 拟合优度(R 2)、 均方根误差(RMS), 进而验证GPS-PWV 精确性。
R M S = 1 n i = 1 n ( X i - Y i ) 2
B i a s = 1 n i = 1 n ( X i - X ¯ )
R 2 ( X , Y ) = c o v ( X , Y ) σ X σ Y
式中: Xi 为GPS-PWV; X ¯为探空站计算得到的PWV平均值; Y i为RS-PWV; σ X σ Y分别为XY的标准偏差。

2.3 降水转化率计算方法介绍

将各站2018年7月至2022年6月逐小时大气可降水量数据累加, 再除以年数, 得到年平均大气可降水量(王娜等, 2021)。
降水转化率的计算公式为:
P = P s P w × 100 %
式中: P表示降水转化率(单位: %); Ps 表示气象站实测降水(单位: mm); Pw 表示大气可降水量(单位: mm)。

2.4 水汽收支方法介绍

基于2018年7月至2022年6月ERA-5 0.25°×0.25°逐月再分析资料, 利用箱体模型计算和分析研究区水汽收支月变化特征(苗秋菊等, 2005)。
(1) 根据式(5)计算从地面到100 hPa厚度整层纬向水汽输送Qx(x, y, p, t)和整层经向水汽输送Qy(x, y, p, t)
(2) 根据式(6)计算区域各边界水汽收支。
(3) 根据式(7)计算区域总体水汽收支。
Q x ( x , y , t ) = 1 g 100 p s q ( x , y , p , t ) u ( x , y , p , t ) d p Q y ( x , y , t ) = 1 g 100 p s q ( x , y , p , t ) v ( x , y , p , t ) d p
Q w = ϕ 1 ϕ 2 Q u ( λ 1 , y , t ) , Q E = ϕ 1 ϕ 2 Q u ( λ 2 , y , t ) Q S = λ 1 λ 2 Q v ( x , ϕ 1 , t ) , Q N = λ 1 λ 2 Q v ( x , ϕ 2 , t )
Q τ = Q w - Q E + Q S - Q N
式中: QWQEQSQN 分别为研究区西、 东、 南、 北四个边界水汽收支; Qτ 为区域边界总体水汽收支; ψ1, ψ2, λ1, λ2分别为各边界对应的纬度和经度。

2.5  GPS大气可降水量资料适用性分析

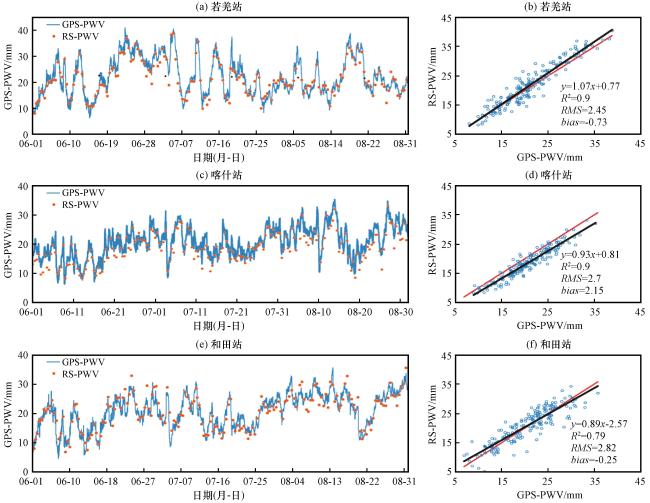
为了进一步验证研究区地基GPS-PWV的准确性, 分别选取区域A中的喀什站、 区域B中的和田站和若羌站(图2), 对比各站2019年6 -8月探空资料计算的可降水量与地基GPS-PWV时间变化差异, 发现GPS-PWV与探空观测计算的可降水量的变化趋势较为一致[图2(a), (c), (e)], 二者一元线性拟合的拟合优度R 2在若羌站、 喀什站、 和田站分别达到0.9[图2(b)]、 0.9[图2(d)]和0.79[图2(f)], 均方根误差分别为2.45 mm、 2.7 mm、 2.82 mm, 平均偏差分别为-0.73 mm、 2.15 mm、 -0.25 mm。这进一步证实GPS-PWV数据的可靠性, 也说明GPS-PWV可作为描述大气水汽变化的有效手段, 能补充常规探空观测在时间和空间密度上的不足(赵玲等, 2006Liu et al, 2020)。
图2 若羌站(a、 b)、 喀什站(c、 d)、 和田站(e、 f)2019年6 -8月08:00和20:00 GPS大气可降水量GPS-PWV(单位: mm)和探空计算大气可降水量RS-PWV(单位: mm)时间变化(左)和散点分布图(右)

右图中红色实线代表1∶1线, 黑色实线为线性回归拟合线

Fig.2 The time series (left) and scatter plots (right) of precipitable water vapor (unit: mm) from GPS (GPS-PWV) and sounding stations (RS-PWV) for Ruoqiang(a, b), Kashi (c, d) and Hetian station (e, f) at 08:00 and 20:00 from June to August 2019.The red solid line and the black solid line in right represent the 1∶1 line, and the linear regression fitting line, respectively

3 塔里木盆地及其周边地区大气可降水量分布特征

3.1 大气可降水量年、 季节空间和垂直分布特征
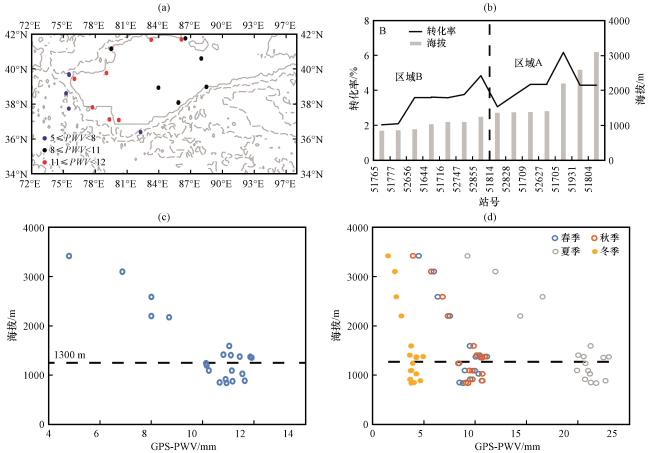
通过分析地基GPS-PWV年分布图发现[图3(a)], 塔里木盆地及其周边地区大气可降水量高值区主要集中于盆地北缘浅山区以及盆地西部海拔小于1600 m的沙漠与绿洲交界地区, GPS-PWV年平均值在11 mm, 海拔大于1600 m的山区站点GPS-PWV相对较小(5~8 mm), 其他区域GPS-PWV年平均值为10 mm。大气可降水量与海拔有密切关系(张沛等, 2020), 海拔决定了大气柱厚度, 直接影响大气含水量(程鹏等, 2021), 区域A海拔高于1300 m、 低于2500 m测站降水转化率随海拔逐渐增加[图3(b)], 区域B测站海拔低于1300 m, 测站降水转化率随海拔逐渐增加, 但区域B测站降水转化率低于区域A, 夜间受局地热力差异影响, 夜间区域A向山气流在山前辐合, 利于测站降水天气的发生。结合各站海拔对比分析发现[图3(c)], 测站海拔超过1300 m站点的GPS-PWV年平均值与海拔基本成反比, GPS-PWV年平均值在5~8 mm, 海拔低于1300 m测站GPS-PWV年平均值均在10~12 mm, 这与天山山区大气水汽含量随高度变化较为相似(姚俊强等, 2012)。此外, 区域测站春季、 夏季、 秋季和冬季PWV平均值随海拔也呈逐渐减小趋势[图3(d)], 冬季不同海拔站点的PWV平均值差异最小, GPS-PWV多集中在3~4 mm, 最大和最小GPS-PWV仅相差3.4 mm, 夏季不同海拔测站GPS-PWV相差最大, 最大和最小GPS-PWV相差13.8 mm, 春季和秋季同海拔站点PWV差异较小, 测站PWV随海拔变化趋势基本一致。
图3 研究区年平均大气可降水量空间分布(a, 单位: mm)、 测站海拔(单位: m)和测站降水转化率(单位: %)变化图(b), 测站海拔(单位: m)与年平均大气可降水量(c, 单位: mm)、 季节平均大气可降水量(d, 单位: mm)的散点分布

(a)中灰色实线和虚线分别为海拔1500 m和3000 m 的等高线

Fig.3 The spatial distribution of annual mean PWV (a, unit: mm), the variation of the altitude (unit: m) and precipitation conversion (unit: %) of the stations (b), the scatter of altitude (unit: m) and annual mean PWV (c, unit: mm) and seasonal mean PWV (d, unit: mm). The grey solid and dotted line in fig 3a for contour line of terrain height of 1500 m and 3000 m, respectively

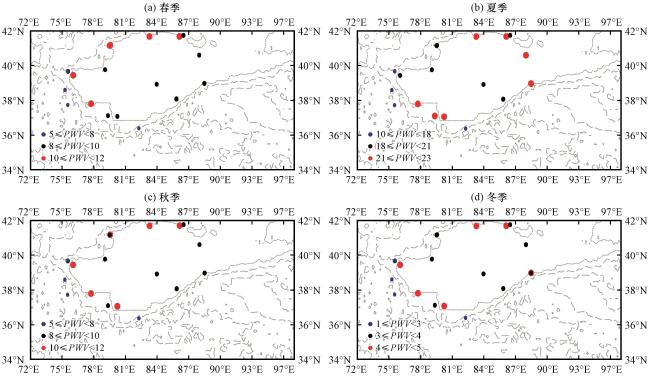
从研究区大气可降水量季节分布图可以看出(图4), 春季[图4(a)]和秋季[图4(c)]GPS-PWV高值区主要位于塔里木盆地北部和西南部平原地区, 盆地腹地次之, 西南部海拔超过1500 m的山区站点最小。夏季随着地表蒸发和降水的增多, 除山区站点外, 其余各地区GPS站点PWV增至18~23 mm[图4(b)], 夏季各站PWV是春、 秋季的2倍左右, 夏季盆地东部沙漠地区也为PWV高值区。冬季研究区各站PWV分布情况与春、 秋季较为相似[图4(d)], 但各站PWV相差不大, PWV平均值在3~5 mm。
图4 春季(a)、 夏季(b)、 秋季(c)、 冬季(d)大气可降水量(单位: mm)空间分布

灰色实线和虚线分别为海拔1500 m和3000 m的等高线

Fig.4 The spacial distribution of seasonal mean PWV (unit: mm) in spring (a), summer (b), autumn (c), winter (d).The grey solid and dotted line for contour line of terrain height of 1500 m and 3000 m, respectively

3.2 大气可降水量月变化和日变化特征

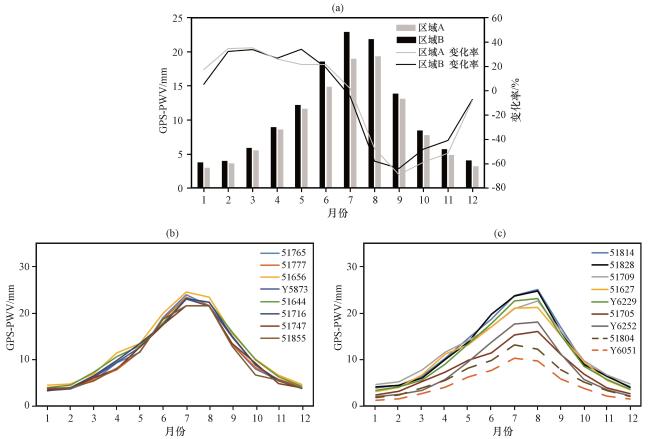
从研究区GPS-PWV的月平均时间演变图可以看出[图5(a)], 各区域测站平均PWV在月尺度上呈单峰型分布, 区域A和B测站平均GPS-PWV从5月开始缓慢上升, 其中区域A测站平均GPS-PWV在8月达到峰值19.63 mm, 区域B 7月达到峰值22.28 mm, 与季风区有所不同的是, 1 -6月是沿海地区大气可降水量的主要增长期, 7 -12月呈逐步减小趋势(潘卫华等, 2021), 而极端干旱区5 -8月是大气可降水量的主要增长期。各区域测站平均GPS-PWV 9月后迅速减小, 在11月降至5 mm附近, 隆冬期间(12月至次年2月)各区域测站平均GPS-PWV集中在5 mm内, 变幅不大。进一步分析发现, 区域A大多站点海拔超过1300 m, 区域B大多站点海拔低于1300 m, 海拔低于1300 m的测站大气可降水量均在7月达到峰值[图5(b)], 而海拔高于1300 m但低于3000 m的测站大气可降水量均在8月达到峰值[图5(c)], 海拔超过3000 m的测站均位于区域A, 且测站大气可降水量在7月达到峰值。
图5 区域A和区域B的地基GPS测站平均大气可降水量(柱状, 单位: mm)和变化率(折线, 单位: %)的月变化(a); 海拔低于1300 m(b)和高于1300 m(c)的地基GPS测站大气可降水量(单位: mm)月变化

Fig.5 Monthly variations of GPS-PWV (columnar, unit: mm) and rate of change (contour, unit: %) in region A and B (a); Monthly variations of GPS-PWV (unit: mm) in stations with altitude below 1300 m (b) and over 1300 m (c)

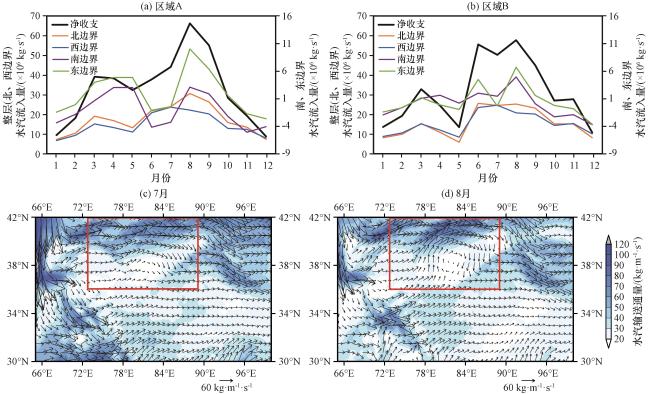
通过各区域月平均水汽收支变化分析发现[图6(a)], 7 -8月区域A整层水汽流入由44×106 kg·s-1迅速增至66×106 kg·s-1, 区域A除西边界外, 其余各边界水汽流入均明显增加, 结合研究区2018 - 2022年7 -8月整层大气水汽输送通量分布图发现[图6(c)、 (d)], 7 -8月, 随着青藏高原季风增强(王灏等, 2023), 高原西北部整层大气水汽输送通量明显增加, 且高值区逐渐向北移动, 区域A 7 -8月整层水汽输送通量由纬向逐渐转经向输送, 且偏南气流较7月明显增强。已有研究发现, 7月南疆西部(区域A)暴雨期间西边界水汽输送量远大于东边界和南边界(黄艳等, 2012赵克明等, 2017), 而8月南边界水汽输送是南疆西部(区域A)暴雨的重要水汽来源(努尔比亚·吐尼牙孜等, 2019)。受高原夏季风向北移动影响, 较低纬度暖湿气流经偏南气流输送至区域A, 南边界水汽流入由-3.2×10⁶ kg·s-1增至3.1×10⁶ kg·s-1, 是造成区域A 8月PWV峰值的可能原因。
图6 沿图1红色矩形计算的区域A(a)和区域B(b)2018 -2022年整层水汽流入(单位: ×106 kg·s-1)月变化;2018 -2022年7月(c)和8月(d)整层平均大气水汽输送通量(矢量和彩色区, 单位: kg·m-1·s-1)分布

(c)和(d)中红色矩形代表塔里木盆地

Fig.6 Monthly variations of integrated water vapor inflow (unit: ×106 kg·s-1) in regions A (a) and B (b) calculated along the red rectangle in figure 1; The distribution of monthly mean integrated water vapor flux (vector and shaded, unit: kg·m-1·s-1) in July (c) and August (d) from 2018 to 2022.The red rectangle in (c) and (d) represents the Tarim basin

与区域A水汽净收支有所不同, 5 -6月区域B整层水汽流入迅速增加[图6(b)], 7 -8月区域B整层水汽流入由50×106 kg·s-1增至57×106 kg·s-1。相较区域A, 区域B上空整层大气水汽输送通量相对较小[图6(c), (d)], 7 -8月区域B 40°N以北区域均由整层水汽输送通量高值区控制, 而40°N以南区域最大整层水汽输送通量由60 kg·(m·s)-1减少至50 kg·(m·s)-1图6(c), (d)]。区域B测站观测环境多戈壁和沙漠, 全年多晴朗天气, 地面蒸发量大, 已有学者利用卫星遥感影像资料分析发现(崔丽娜等, 2012), 夏季冰川融水为季节性河流提供了大量水源, 7月区域B存在一条与塔里木河流走向基本一致的水汽输送带, 与区域A有所不同的是, 除了大尺度水汽输送造成的整层水汽流入外, 河流水汽蒸发也是区域B大气水汽含量的重要来源。
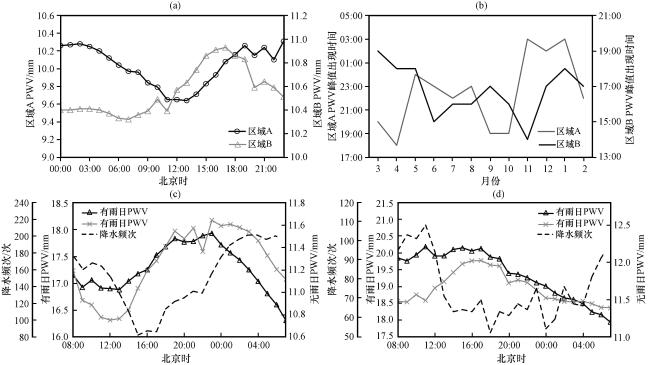
区域A和区域B 测站平均PWV日变化均呈单峰分布[图7(a)], PWV分别在11:00和07:00出现谷值9.69 mm和10.39 mm; 区域A PWV在23:00出现峰值10.31 mm, 区域B PWV在17:00达到峰值10.93 mm, 峰值出现时间早于区域A 6 h, 这可能与区域A春季、 夏季和秋季午后-傍晚多对流降水天气有关, 因而局地大气可降水量在凌晨前后出现峰值。此外, 分析发现沙漠地区测站无雨日的地面水汽压在午后为低值区, 而PWV为高值区(图略), 且区域B PWV各月份峰值出现时间均集中在16:00 -18:00[图7(b)], 其中夏季月份峰值出现时间较春季明显提前2 h, 干旱地区午后近地面蒸发强烈, 使得更多水汽进入大气中, 是造成塔里木盆地沙漠腹地在午后出现PWV峰值的可能原因。进一步分析有、 无降水日PWV日变化的差异发现, 区域A有降水日PWV日变化与无降水日PWV日变化的趋势基本一致[图7(c)], 均在23:00达到日峰值, 这可能与局地山谷风环流具有一定联系, 夜间在局地热力差异影响下, 低海拔绿洲地区气团向山一侧移动, 并在区域A浅山区附近堆积, 逐渐形成PWV高值区, 结合有效降水时次分布情况发现, 区域A测站降水多发生在02:00 -03:00, 降水频次峰值略晚于有降水日PWV峰值2~3 h, 说明PWV对降水有一定的指示意义。区域B有、 无降水日PWV日峰值出现时间相差5 h[图7(d)], 有降水日PWV日峰值出现在11:00, 且测站降水多发生在11:00, 无降水日PWV日峰值出现在17:00, 区域B有、 无降水日的PWV日变化差异可能是大尺度水汽输送和午后局地强烈蒸发造成的。
图7 区域A和区域B地基GPS测站平均大气可降水量(PWV, 单位: mm)日变化(a); (b)区域A和区域B地基GPS测站平均PWV日峰值出现时间月变化(b); 区域A(c)和区域B(d)测站有降水日、 无降水日平均PWV及降水频次日变化

Fig.7 The diurnal variations of average precipitable water vapor (PWV, unit: mm) in the regions A and B (a); the monthly variations of the occurred time of PWV peak value in the regions A and B (b); the diurnal variations of PWV (unit: mm) in rain days and no rain days and frequency of precipitation at stations in the region A(c)and region B(d)

4 大气可降水量与降水的关系

为更好地找出PWV与降水的关系, 本节将讨论PWV月距平峰值出现时间与降水开始时间的对应关系。定义GPS站点日降水量≥0.1 mm为一个降水日, 如出现连续降水日, 仅统计第一个降水日PWV演变情况(刘晶等, 2019b)。剔除降水时段PWV缺测数据, 并定义降水开始前、 后24 h内超过80%观测时次(即观测时次超过38次)为一降水有效的PWV演变过程。在此定义基础上, 获得2018年7月至2022年6月塔里木盆地及其周边地区14个气象观测站共871个降水天气个例样本(表2)。利用气象站点小时降水数据提取和计算降水天气过程开始时刻和对应前后24 h内PWV与月平均值差值(ΔPWV), 计算各站点春、 夏、 秋和冬季降水开始前后24 h内的ΔPWV的平均值, 得到区域站点ΔPWV与降水开始时刻的关系。
表2 塔里木盆地及周边地区气象观测站点数和天气过程样本数

Table 2 Number of meteorological observation stations and sample number of weather processes in Tarim basin and its surrounding area

季节 7站天气过程总样本数/个
区域A 区域B
春季 126 67
夏季 292 178
秋季 90 54
冬季 59 35

4.1 研究区测站ΔPWV峰值与降水开始时刻关系

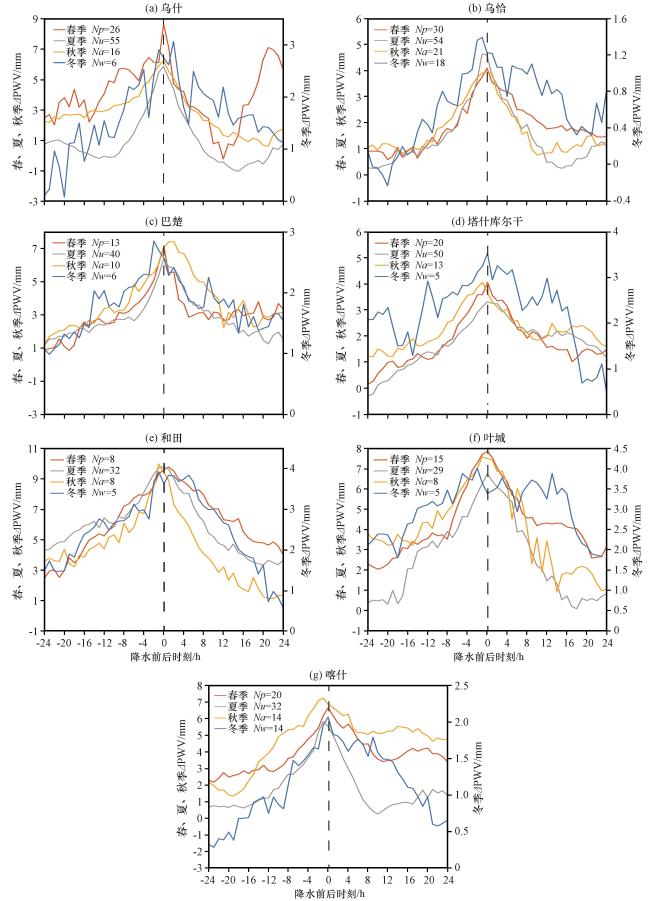
通过分析区域A降水开始前后24 h ΔPWV平均值变化图发现(图8), 春季各站ΔPWV峰值出现时间与降水开始时刻基本保持一致, 最大ΔPWV峰值出现在和田站为9.8 mm[图8(e)], 其余各站维持在4~7 mm。夏季各站ΔPWV峰值出现时间提前降水开始时刻0~1 h, 最大ΔPWV峰值出现在和田站为9.8 mm, 其余各站维持在3~6 mm。秋季最大ΔPWV峰值出现在和田站达10 mm, 其余各站ΔPWV峰值稳定在4~8 mm。除巴楚站外[图8(c)], 其余各站秋季降水期间ΔPWV峰值提前降水开始时刻0~1 h。冬季各站降水前ΔPWV均出现波动增长过程, ΔPWV最大峰值出现在叶城站为4 mm[图8(f)], 其余各站基本维持在1~3 mm附近。除乌什站外[图8(a)], 其余各站ΔPWV峰值出现时间提前降水开始时刻0~2 h。综合分析发现区域A春季-秋季测站ΔPWV最大峰值均出现在和田站, 各测站降水前6 h ΔPWV跃变程度最剧烈, 多数测站ΔPWV峰值出现时间提前降水开始时刻0~1 h, 其中春季、 秋季ΔPWV峰值较夏季更大, 这也说明南疆西部地区春、 秋季降水期间PWV变化程度更加剧烈。
图8 区域A 7个GPS测站降水开始时刻前后24 h ΔPWV(单位: mm)平均值变化

(a)乌什, (b)乌恰, (c)巴楚, (d)塔什库尔干, (e)和田, (f)叶城, (g)喀什, Np, Nu, Na, Nw分别代表春季、 夏季、 秋季和冬季降水天气过程样本数

Fig.8 The variations of mean ΔPWV diurnal cycle anomalies(unit: mm) during 24 h before and after the onset of precipitation at seven stations in region A.(a) Wushi, (b) Wuqia, (c) Bachu, (d) Tashikuergan, (e) Hetian, (f) Yecheng, (g) Kashi.Np, Nu, Na, Nw for the samples number of precipitation weather processes in spring, summer, autumn and winter

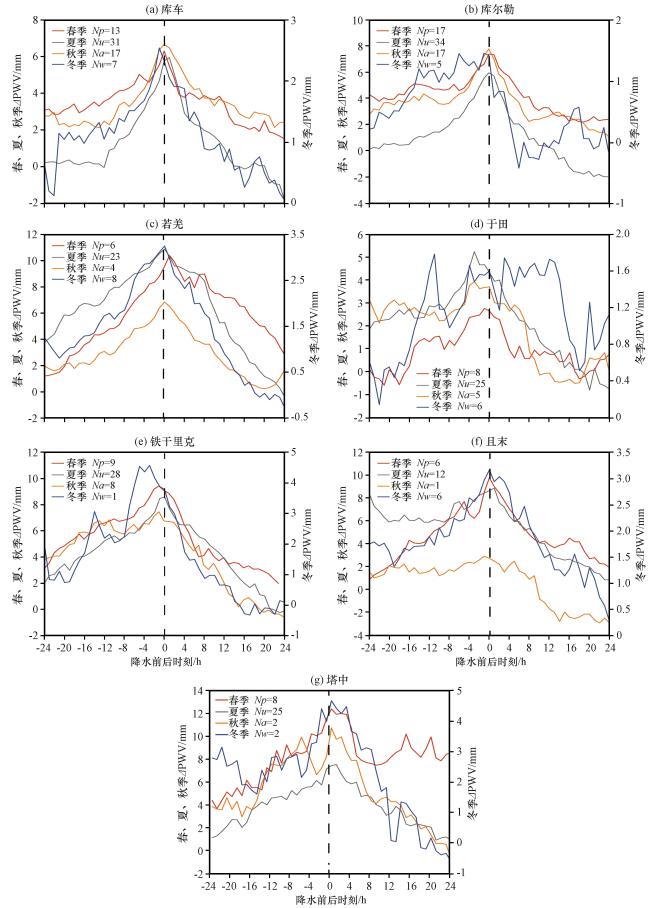
塔里木盆地腹地常年处于青藏高原大地形背风坡下沉气流控制, 是世界极端干旱地区之一。春季各站ΔPWV峰值在降水开始时刻前后1 h出现(图9), 最大ΔPWV峰值出现在塔中站12.4 mm[图9(g)], 夏季除于田站外[图9(d)], 其余各站ΔPWV峰值在降水开始时刻0~1 h后出现, 最大ΔPWV峰值出现在若羌站10.8 mm[图9(c)]; 秋季最大ΔPWV峰值出现在塔中站为10.7 mm, 与春季相比, 秋季塔中站以东的沙漠腹地测站ΔPWV峰值明显偏小, 而其余测站秋季ΔPWV峰值与春季相当, 这可能是由于8 -9月区域B整层水汽流入迅速减小, 因而造成大气可降水量偏小。冬季多数测站ΔPWV峰值在降水开始时刻前0~1 h出现, 最大ΔPWV峰值也出现在塔中站为4.7 mm, 其余各站ΔPWV峰值相差不大。综合分析发现区域B各季节测站ΔPWV最大峰值均出现在沙漠腹地塔中站和若羌站, 这可能与沙漠地区PWV平均值较低, 强降水天气过程中PWV跃变程度较其他地区更强有关。与区域A相似的是, 区域B各测站降水前6 h ΔPWV跃变程度最剧烈, 但区域A各站春、 秋季ΔPWV峰值相差不大, 而区域B沙漠腹地秋季ΔPWV峰值较春季明显偏小。
图9 区域B 7个GPS测站降水开始时刻前后24 h ΔPWV(单位: mm)平均值变化

(a)库车, (b)库尔勒, (c)若羌, (d)于田, (e)铁干里克, (f)且末, (g)塔中, Np, Nu, Na, Nw分别代表春季、 夏季、 秋季和冬季降水天气过程样本数

Fig.9 The variations of mean ΔPWV diurnal cycle anomalies(unit: mm) during 24 h before and after the onset of precipitation at seven stations in region B.(a) Kuche, (b) Kuerle, (c) Ruoqiang, (d) Yutian, (e) Tieganlike, (f) Qiemo, (g) Tazhong.Np, Nu, Na, Nw for the samples number of precipitation weather processes in spring, summer, autumn and winter

4.2 降水前 6 h 研究区测站大气水汽含量与月平均值倍数分布

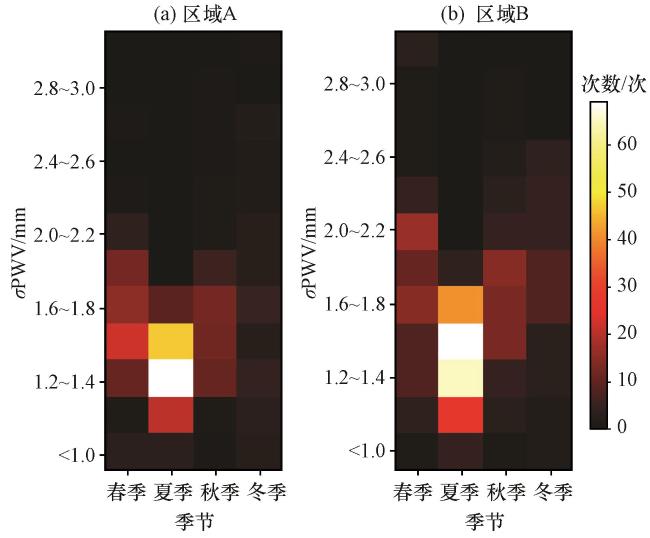
由上述研究结果可以看出, 测站降水前6 h PWV跃变程度最剧烈, 为了进一步找出PWV与降水开始时刻的关系, 通过计算和分析测站降水前6 h PWV与月平均值的倍数(σPWV)分布情况发现, 测站不同季节降水前6 h σPWV分布有所差异。区域A春季和秋季降水前6 h σPWV峰值集中在1.2~2.0倍[图10(a)], 夏季较小, σPWV峰值集中在1~1.8倍, 冬季降水前6 h σPWV分布较为分散, 春、 秋季区域A测站PWV变化较其他季节更为剧烈。区域B冬季降水前6 h σPWV峰值集中在1.6~2.4倍[图10(b)], 春季降水前6 h σPWV峰值集中在1.6~2.2倍, 秋季次之, σPWV峰值集中在1.4~2.0倍, 夏季最小, σPWV峰值集中在1~1.8倍。对比发现区域B较区域A春季降水前6 h σPWV峰值偏大, 而夏季区域B和区域A降水前6 h σPWV峰值分布基本一致。
图10 降水前6 h内区域A(a)和区域B(b)测站达到σPWV峰值次数(单位: 次)的季节分布

Fig.10 The frequency (unit: time) seasonal distribution when the peak value of σPWV appeared within 6 hours before precipitation in region A (a) and region B (b)

此外, 通过降水前σPWV峰值出现时间分布情况分析发现(表3), 春季区域A σPWV提前降水开始时刻5~6 h达到1.2~2.0倍的降水过程偏多, 而夏季σPWV提前降水开始时刻1 h和5~6 h达到1~1.8倍的天气过程较其余提前时次偏多。夏季区域B和春季区域A降水前6 h σPWV峰值基本一致, 与区域A相似的是, 区域B σPWV提前降水开始时刻1 h和5~6 h达到1~1.8倍的天气过程较其余提前时次偏多(表4)。对比分析发现, 区域B较区域A春季降水前6 h测站最大σPWV更大, 其余季节最大σPWV与区域A基本一致, 说明沙漠腹地春季降水PWV跃变程度较沙漠西部绿洲地区更加剧烈, 这可能与春季区域A冰川融水, 且整层大气水汽流入量达到峰值, 一定程度上补充了大气可降水量, 因而降水期间较区域B空中水汽含量更加充足, 相应的PWV跃变程度较区域B偏小。
表3 春季区域A测站降水前6 hσPWV峰值提前降水开始时间的天气过程次数分布

Table 3 The sample number of precipitation weather processes when the peak value of σPWV appeared within 6 hours before precipitation in spring in region A

σPWV峰值提前 降水开始时间/h 降水前6 h内σPWV峰值
<1 1~1.2 1.2~1.4 1.4~1.6 1.6~1.8 1.8~2.0 2.0~2.2 2.2~2.4 2.4~2.6 2.6~2.8 2.8~3.0 >3
-1 3 0 3 4 2 1 1 0 0 0 0 0
-2 1 0 4 2 1 4 1 1 0 0 0 0
-3 0 0 3 4 1 4 0 0 0 0 0 0
-4 0 0 3 6 3 1 1 0 0 1 0 0
-5 2 0 3 8 8 5 3 0 0 0 0 0
-6 0 2 3 15 12 7 1 0 0 0 0 0
表4 夏季区域A和区域B测站降水前6 hσPWV峰值提前降水开始时间的天气过程次数分布

Table 4 The sample number of precipitation weather processes when the peak value of σPWV appeared within 6 hours before precipitation in summer in region A and region B

σPWV峰值 提前降水 开始时间/h 降水前6 h内σPWV峰值
区域 A 区域 B
<1 1~1.2 1.2~1.4 1.4~1.6 1.6~1.8 1.8~2.0 >2 <1 1~1.2 1.2~1.4 1.4~1.6 1.6~1.8 1.8~2.0 >2
-1 3 11 25 9 0 0 0 2 7 14 9 11 0 0
-2 1 2 13 4 1 0 0 0 4 7 4 2 0 0
-3 0 1 11 6 0 0 0 2 4 11 8 5 1 0
-4 0 5 10 10 1 0 0 0 2 12 6 3 2 0
-5 1 6 26 16 6 0 0 1 3 12 12 7 0 0
-6 1 11 35 37 8 0 0 0 7 9 30 13 1 0

4.3 研究区测站降水结束时刻PWV分布

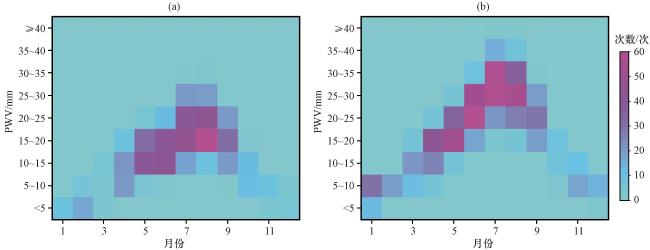
上述分析发现测站降水开始时刻与PWV跃变程度有较好的对应关系, 进一步研究发现塔里木盆地不同海拔测站降水结束时刻与PWV也有较好的关系。塔里盆地降水主要集中在5 -9月, 其中在海拔高于1400 m测站的5 -6月降水天气过程中[图11(a)], PWV集中在10~20 mm时测站降水结束的过程共163次, 占5 -6月总降水过程的86%; 7 -8月测站PWV值相对其他月份明显偏大, 降水结束时刻PWV集中在15~25 mm的过程共196次, 占7 -8月总降水过程的72.3%。对比发现[图11(b)]), 海拔低于1400 m测站5月降水结束时刻PWV值高于高海拔测站降水结束时刻PWV值, 当PWV达15~25 mm测站降水结束的过程占5月总降水过程的86.3%。6月测站降水期间PWV值较5月进一步增加, 降水结束时刻PWV达20~30 mm的过程占6月总降水过程的79%。随着高原夏季风向北移动影响塔里木盆地, 7 -8月测站降水期间PWV值明显高于其他季节, 降水结束时刻PWV集中在25~35 mm的过程共207次, 占7 -8月总降水过程的71%。
图 11 降水结束时刻达到PWV不同区间值次数(单位: 次)的月分布

(a)海拔高于1400 m测站; (b)海拔低于1400 m测站

Fig.11 The monthly frequency (unit: time) distribution of PWV appeared at end of precipitation for stations with altitude over 1400 m (a) and below 1400 m (b)

5 结论

通过对塔里木盆地及其周边地区地基GPS测站大气可降水量变化特征及其与降水关系的分析, 明确了极端干旱地区PWV年、 季、 月及日演变特征, 给出了不同测站ΔPWV、 σPWV与降水开始时刻的关系, 并得出以下结论:
(1) 研究区年平均PWV高值区主要集中于盆地北部和盆地西南部平原地区, 春季、 秋季和冬季平均PWV高值区分布与PWV年分布较为一致, 夏季PWV高值区逐渐向东伸展并控制盆地东部沙漠腹地, 且夏季测站PWV平均值是春、 秋季节的2倍。研究区测站海拔超过1300 m站点的PWV年平均值与海拔基本成反比, 海拔低于1300 m测站PWV年平均值集中在10~12 mm。
(2) 各区域PWV月变化呈单峰型分布, PWV 5月开始缓慢上升, 9月后迅速减小, 其中区域A 8月PWV达到峰值, 7 -8月高原季风增强, 大尺度水汽输送造成的整层水汽流入是造成区域A 8月PWV峰值的可能原因。区域B于7月达到峰值, 这可能与局地蒸发和外界水汽流入迅速增强有关。夜间区域A局地热力差异导致的向山气流利于水汽在山前辐合, 区域A有、 无降水日PWVave均在23:00达到日峰值。区域B有、 无降水日PWVave日峰值出现时间相差5 h, 分别出现在11:00和17:00, 可能是大尺度水汽输送和午后局地强烈蒸发造成的。
(3) 区域A春季-冬季测站ΔPWV最大峰值均出现在叶城站, 区域B各季节测站ΔPWV最大峰值均出现在沙漠腹地塔中站和若羌站, 这可能与沙漠地区PWV平均值较低, 强降水天气过程中PWV跃变程度较其他地区更强有关。区域A和区域B各测站降水前6 h ΔPWV跃变程度最剧烈, 区域A多数测站ΔPWV峰值出现时间提前降水开始时刻0~1 h, 春季和秋季ΔPWV峰值相差不大, 较夏季ΔPWV峰值更大, 而区域B多数测站ΔPWV峰值在降水开始时刻前后1 h出现, 且秋季区域B沙漠腹地ΔPWV峰值较春季明显偏小。
(4) 区域B较区域A春季降水前6 h测站最大σPWV更大, 说明沙漠腹地春季降水PWV跃变程度较沙漠西部绿洲地区更加剧烈。夏季区域A和区域B σPWV提前降水开始时刻1 h、 5~6 h达到1~1.8倍的降水过程较其余提前时次偏多。秋季区域A降水前6 h σPWV峰值集中在1.2~2.0倍, 冬季区域B降水前6 h σPWV峰值较秋季偏大, 秋季和冬季分别集中在1.4~2.0倍和1.6~2.4倍。
(5) 不同海拔测站降水结束时刻与PWV有较好的关系。海拔高于1400 m测站的5 -6月、 7 -8月降水结束时刻PWV值分别集中在10~20 mm和15~25 mm。海拔低于1400 m测站5 -8月降水结束时刻PWV值逐渐由15~25 mm增至25~35 mm。
以上研究基于地基GPS大气可降水量分析了塔里木盆地及其周边地区PWV时空演变特征及其与测站降水的关系, 总结了干旱区大气可降水量演变规律, 发现了沙漠、 戈壁地区测站降水期间ΔPWV较绿洲地区更大, 找出了PWV与降水开始时刻的关系, 但水汽局地变化与大尺度水汽输送、 局地汇聚密切相关, 且沙漠地区较其他区域水汽来源有何差异, 不同下垫面和海拔地区降水天气对水汽依赖程度有何不同, 这些都是我们今后需要解决的问题, 因而在今后的研究工作中还应更关注大气可降水含量的局地变化与大尺度水汽输送、 局地汇聚的联系, 重点研究不同强度降水天气过程中大尺度水汽输送强度和大气可降水量跃变程度的差异, 从而更好地理解该地区暴雨的发生、 发展机制, 为暴雨定时、 定量预报提供一定参考依据。

References

null
Baker H C Dodson A H Penna N T, et al, 2001.Ground-based GPS water vapor estimate: potential for meteorological forecasting[J].Journal of atmospheric and solar terrestrial Physics, 63: 1305-1314.DOI: 10.1016/S1364-6826(00)00249-2 .
null
Benevides P Catalao J Miranda P M2015.On the inclusion of GPS precipitable water vapor in the nowcasting of rainfall[J].Natural Hazards & Earth System Science15(12): 2605-2616.DOI: 10.5194/nhess-15-2605-2015 .
null
Duan J Bevis M Fang P, et al, 1996.GPS meteorology: direct-estimation of the absolute value of precipitable water[J].Journal of Applied Meteorology35(6): 830-838.DOI: 10.1175/1520-0450(1996)035<0830: GMDEOT>2.0.CO; 2
null
Liu J Liu F, Dilinuer, et al, 2020.Analysis of the water vapor transport and accumulation mechanism during “7.31” extreme rainstorm event in the south-eastern Hami area, China[J].Meteorological Application27(4): e1933.DOI: 10.1002/met.1933
null
Liu Y Zhao Q Z Yao W Q, et al, 2019.Short-term rainfall forecast model based on the improved BP-NN algorithm[J].Scientific Reports, 9: 19751.DOI: 10.1038/s41598-019-56452-5
null
Rocken C VanHove T Johmson J, et al, 1995.GPS/Storm-GPS sensing of atmospheric water vapor foremeteorology[J].Journal of Atmospheric and Oceanic Technology, 12: 468-478.DOI: 10.1175/1520-0426(1995)012<0468: GSOAWV>2.0.CO; 2
null
Wang J H Zhang L Y Dai A G2005.Global estimates of water-vapor-weighted mean temperature of the atmosphere for GPS applications [J].Journal of Geophysical Research, 110, D21101.DOI: 1029/2005JD006215 .
null
Zhao Y Huang A N Zhou Y, et al, 2016.The impacts of the summer plateau monsoon over the Tibetan Plateau on the rainfall in the Tarim Basin, China [J].Theoretical And Applied Climatology126(1/2): 265-272.DOI: 10.1007/s00704-015-1576-x .
null
曹云昌, 方宗义, 夏青, 2005.GPS遥感的大气可降水量与局地降水关系的初步分析[J].应用气象学报16(1): 54-59.DOI: 10.3969/j.issn.1001-7313.2005.01.006.Cao Y C
null
Fang Z Y Xia Q2005.Relationship between GPS precipitable water vapor and precipitation [J].Journal of Applied Meteorological Science16(1): 54-59.DOI: 10.3969/j.issn.1001-7313.2005.01.006 .
null
陈宏, 林炳章, 张叶辉, 2014.PMP估算中大气可降水量计算方法的探讨[J].水文34(3): 1-5.DOI: 10.3969/j.issn.1000-0852.2014.03.001.Chen H
null
Lin B Z Zhang Y H2014.Comparison of calculation methods for estimating atmospheric precipitable water in estimation of PMP [J].Journal of China Hydrology34(3): 1-5.DOI: 10.3969/j.issn.1000-0852.2014.03.001 .
null
陈俊勇, 1998.地基GPS遥感大气水汽含量的误差分析[J].测绘学报27(2): 113-118.DOI: 10.3321/j.issn: 1001-1595. 1998.02.004.Chen J Y , 1998.On the error analysis for the remote sensing of atmospheric water vapor by ground based GPS [J].Acta Geodaetica et Cartographica Sinica, 27(2): 113-118.DOI: 10.3321/j.issn: 1001-1595.1998.02.004 .
null
程鹏, 罗汉, 刘琴, 等, 2021.基于地基GPS的祁连山大气可降水量特征[J].气象47(9): 1135-1145.DOI: 10.7519/j.issn.1000-0526.2021.09.009.Cheng P
null
Luo H Liu Q, et al, 2021.Characteristics of precipitable water vapor in Qilian mountains based on ground-based GPS data [J].Meteorological Monthly47(9): 1135-1145.DOI: 10.7519/j.issn.1000-0526.2021.09.009 .
null
程鹏, 王研峰, 罗汉, 等, 2022.基于GPS的河西走廊干旱区大气可降水量特征[J].高原气象41(5): 1281-1290.DOI: 10.7522/j.issn.1000-0534.2021.0005.Cheng P
null
Wang Y F Luo H, et al, 2022.Characteristics of precipitable water vapor in Arid areas of the Hexi corridor based on GPS measurements [J].Plateau Meteorology41(5): 1281-1290.DOI: 10.7522/j.issn.1000-0534.2021.0005 .
null
楚艳丽, 郭英华, 张朝林, 等, 2007.地基GPS水汽资料在北京“7·10”暴雨过程研究中的应用[J].气象33(12): 16-22.DOI: 10.3969/j.issn.1000-0526.2007.12.003.Chu Y L
null
Guo Y H Zhang C L, et al, 2007.Application of the ground based GPS/PW data to investigate the "7·10" heavy rainfall event in Beijing [J].Meteorological Monthly33(12): 16-22.DOI: 10.3969/j.issn.1000-0526.2007.12.003 .
null
崔丽娜, 崔彩霞, 李春华, 等, 2012.塔克拉玛干沙漠及其周边山区水汽时空分布特征[J].安徽农业科学40(35): 17244-17248.DOI: 10.13989/j.cnki.0517-6611.2012.35.017.Cui L N
null
Cui C C Li C H, et al, 2012.The temporal and spatial distribution characteristics of precipitable water in Taklimakan desert and the surrounding mountains [J].Journal of Anhui Agricultural Sciences40(35): 17244-17248.DOI: 10.13989/j.cnki.0517-6611.2012.35.017 .
null
崔丽娜, 史玉光, 崔彩霞, 等, 2010.塔克拉玛干沙漠腹地2009年大气水汽含量的日变化特征[J].干旱气象28(4): 407-410.DOI: 10.3969/j.issn.1006-7639.2010.04.006.Cui L N
null
Shi Y G Cui C X, et al, 2010.Diurnal variation of atmospheric water vapor content in 2009 over Taklimakan desert [J].Journal of Arid Meteorology28(4): 407-410.DOI: 10.3969/j.issn.1006-7639.2010.04.006 .
null
付志康, 万蓉, 于胜杰, 等, 2017.湖北地基GPS大气可降水量变化特征分析及应用[J].气象科学37(4): 553-560.DOI: 10.3969/2016jms.0047.Fu Z K
null
Wan R Yu S J, et al, 2017.Analysis and application of ground-based GPS precipitable water vapor characteristics[J].Journal of The Meteorological Sciences37(4): 553-560.DOI: 10.3969/2016jms.0047 .
null
海云莎, 孙绩华, 陈新梅, 2011.2007-2010年云南GPS观测大气可降水量特征分析[J].云南地理环境研究23(2): 78-84.DOI: 10.3969/j.issn.1001-7852.2011.02.014.Hai Y S
null
Sun J H Chen X M2011.The analysis of GPS-retrieved PWV characteristic in Yunan from 2007-2010[J].Yunnan Geographic Environment Research23(2): 78-84.DOI: 10.3969/j.issn.1001-7852.2011.02.014 .
null
黄艳, 刘涛, 张云惠, 2012.2010年盛夏南疆西部一次区域性暴雨天气特征[J].干旱气象30(4): 615-622.DOI: 10.11755/j.issn.1006-7639(2012)-04-0615-08.Huang Y
null
Liu T Zhang Y H2012.Features of a regional rainstorm in midsummer of 2010 in western Xinjiang[J].Journal of Arid Meteorology30(4): 615-622.DOI: 10.11755/j.issn.1006-7639(2012)-04-0615-08 .
null
金炯, 董光荣, 申建友, 1994.新疆塔里木盆地的现代气候状况[J].干旱区资源与环境8(3): 12-21.
null
Jin J Dong G R Shen J Y1994.The contemporary climate of Tarim basin, Xinjiang [J].Journal of Arid Land Resources and Environment8(3): 12-21.
null
李成才, 毛节泰, 李建国, 等, 1999.全球定位系统遥感水汽总量[J].科学通报44(3): 333-336.
null
Li C C Mao J T Li J G, et al, 1999.Global Positioning system remote sensing of total water vapor [J].Scientific Bulletin44 (3): 333-336.
null
李光伟, 黄光瑞, 邢峰华, 等, 2022.海口地区GPS反演大气可降水量中加权平均温度模型构建及其应用[J].干旱气象40(6): 1081-1091.DOI: 10.11755/j.issn.1006-7639(2022)-06-1081.Li G W
null
Huang G R Xin F H, et al, 2022.Construction of weighted mean temperature model in retrieval of atmospheric precipitable water from GPS in Haikou and its application[J].Journal of Arid Meteorology40(6): 1081-1091.DOI: 10.11755/j.issn.1006-7639(2022)-06-1081
null
李光伟, 黄彦彬, 敖杰, 等, 2018.GPS探测与FY-2反演大气可降水量对比分析[J].气象44(8): 1082-1093.DOI: 10.7519/j.issn.1000-0526.2018.08.010.Li G W
null
Huang Y B Ao J, et al, 2018.Comparison of precipitable water retrieved by FY-2 satellite and GPS observations[J].Meteorological Monthly44(8): 1082-1093.DOI: 10.7519/j.issn.1000-0526.2018.08.010 .
null
李国平, 黄丁发, 2004.GPS遥感区域大气水汽总量研究回顾与展望[J].气象科技32(4): 201-205. DOI: 10.3969/j.issn.1671-6345.2004.04.001.Li G P
null
Huang D F2004.Reviews and prospects of researches on remote sensing of regional atmospheric water vapor using ground-based GPS[J].Meteorological Science and Technology32(4): 201-205.DOI: 10.3969/j.issn.1671-6345.2004.04.001 .
null
李国平, 黄丁发, 刘碧全, 2006.地基GPS遥感的成都地区夏季可降水量的日循环合成分析[J].水科学进展17(2): 160-163.DOI: 10.3321/j.issn: 1001-6791.2006.02.002.Li G P
null
Huang D F Liu B Q2006.Composite study of diurnal cycle of precipitable water vapor derived from ground-based GPS in Chengdu Plain during the warm season[J].Advances in Water Science17(2): 160-163.DOI: 10.3321/j.issn: 1001-6791.2006.02.002 .
null
李俊霞, 李培仁, 晋立军, 等, 2017.地基微波辐射计在遥感大气水汽特征及降水分析中的应用[J].干旱气象35(5): 767-775.DOI: 10.11755/j.issn.1006-7639(2017)-05-076.Li J X
null
Li P R Jin L J, et al, 2017.Remote sensing of precipitable water vapor features and application in precipitation analysis by using ground-based microwave radiometer[J].Journal of Arid Meteorology35(5): 767-775.DOI: 10.11755/j.issn.1006-7639(2017)-05-076 .
null
李立, 1994.新疆夏季降水的水汽特征[J].新疆气象17(3): 16-20.
null
Li L1994.Water vapor characteristics of summer precipitation in Xinjiang[J].Bimonthly of Xinjiang Meteorology17(3): 16-20.
null
梁宏, 刘晶淼, 李世奎, 2006.青藏高原及周边地区大气水汽资源分布和季节变化特征分析[J].自然资源学报, 4: 526-534.DOI: 10.3321/j.issn: 1000-3037.2006.04.004.Liang H
null
Liu J M Li S K2006.Analysis of precipitable water vapor source distribution and its seasonal variation characteristics over Tibetan plateau and its surroundings[J].Journal of Natural Resources, 4: 526-534.DOI: 10.3321/j.issn: 1000-3037.2006.04.004 .
null
刘晶, 杨莲梅, 2017.一次中亚低涡造成的天山北坡暴雨GPS大气水汽总量演变特征[J].气象43(6): 724-734.DOI: 10.7519/j.issn.1000-0526.2017.06.009.Liu J
null
Yang L M2017.Development features of GPS atmospheric precipitable water vapor in heavy rainfall caused by central Asia vortex on the north slope of Tianshan mountain[J].Meteorological Monthly43(6): 724-734.DOI: 10.7519/j.issn.1000-0526.2017.06.009 .
null
刘晶, 周雅蔓, 杨莲梅, 等 , 2019b.2016年伊犁河谷大气可降水量变化特征及其与降水的关系[J].干旱气象37(4): 565-576.DOI: 10.11755/j.issn.1006-7639(2019)-04-0565.Liu J , ZhouYM, YangLM, et al, 2019b.Temporal variation characteristics of precipitable water vapor based on GPS data and its relation with precipitation at Yili River Valley in 2016[J].Journal of Arid Meteorology, 37(4): 565-576.DOI: 10.11755/j.issn. 1006-7639(2019)-04-0565 .
null
刘晶, 周玉淑, 杨莲梅, 等 , 2019a.伊犁河谷一次极端强降水事件水汽特征分析[J].大气科学43(5): 959-974.DOI: 10.3878/j.issn.1006-9895.1901.18114.Liu J , ZhouY S, YangL M, et al, 2019a.A diagnostic study of water vapor during an extreme precipitation event in the Yili river valley[J].Chinese Journal of Atmospheric Sciences, 43(5): 959-974.DOI: 10.3878/j.issn.1006-9895.1901.18114 .
null
苗秋菊, 徐祥德, 张胜军, 2005.长江流域水汽收支与高原水汽输送分量“转换”特征[J].气象学报63(1): 93-99.DOI: 10.3321/j.issn: 0577-6619.2005.01.010.Miao Q J
null
Xu X D Zhang S J2005.Whole layer water vapor budget of Yangtze river valley and moisture flux components transform in the key areas of the plateau [J].Acta Meteorologica Sinica63(1): 93-99.DOI: 10.11676/qxxb2005.010 .
null
苗运玲, 李如琦, 卓世新, 2016.天山北坡东段GPS反演的大气可降水量变化特征及其与降水的关系[J].干旱气象34(6): 989-994.DOI: 10.11755/j.issn.1006-7639(2016)-06-0989.Miao Y L
null
Li R Q Zhuo S X2016.Temporal variation characteristics of precipitable water vapor based on GPS and their relation with precipitation in eastern section of the northern slope of Tianshan mountains [J].Journal of Arid Meteorology34(6): 989-994.DOI: 10.11755/j.issn.1006-7639(2016)-06-0989 .
null
努尔比亚·吐尼牙孜, 张超, 李泽巍, 等, 2019.南疆西部 2016年8月4次暴雨过程特征分析[J].干旱气象37(2): 301-311.DOI: 10.11755 /j.issn.1006-7639(2019)-02-0301.Nurbiye T
null
Zhang C Li Z W, et al, 2019.Characteristics of four rainstorm processes in the west of Southern Xinjiang in August 2016 [J].Journal of Arid Meteorology37(2): 301-311.DOI: 10.11755 /j.issn.1006-7639(2019)-02-0301 .
null
潘卫华, 余永江, 罗艳艳, 等, 2021.基于地基GPS大气可降水量的福建水汽资源时空分布特征分析[J].干旱气象39(4): 577-584.DOI: 10.11755/j.issn.1006-7639(2021)-04-0577.Pan W H
null
Yu Y J Luo Y Y, et al, 2021.Analysis of spatio-temporal distribution characteristics of atmospheric precipitable resources over Fujian based on ground-based GPS data[J].Journal of Arid Meteorology39(4): 577-584.DOI: 10.11755/j.issn.1006-7639(2021)-04-0577 .
null
申乐琳, 何金海, 周秀骥, 等, 2010.近50 年来中国夏季降水及水汽输送特征研究[J].气象学报68(6): 918-931.DOI: 10.11676/qxxb2010.087.Shen L L
null
He J H Zhou X J, et al, 2010.The regional variabilities of the summer rainfall in China and its relation with anomalous moisture transport during the recent 50 years[J].ACTA Meteorologica Sinica68(6): 918-931.DOI: 10.11676/qxxb2010.087 .
null
施雅风, 沈永平, 李栋梁, 等, 2003.中国西北气候由暖干向暖湿转型的特征和趋势探讨[J].第四纪研究23(2): 152-164.DOI: 10.3321/j.issn: 1001-7410.2003.02.005.Shi Y F
null
Shen Y P Li L D, et al, 2003.Discussion on the present climate change from warm-dry to warm-wet in northwest China[J].Quaternary Sciences23(2): 152-164.DOI: 10.3321/j.issn: 1001-7410.2003.02.005 .
null
石小龙, 尚伦宇, 尹远渊, 等, 2014.大连地区GPS反演大气可降水量的变化特征[J].高原气象33(6): 1648-1653.DOI: 10.7522/j.issn.1000-0534.2014.00080.Shi X L
null
Shang L Y Yin Y Y, et al, 2014.Variation characteristics of precipitable water vapor inversed by GPS in Dalian[J].Plateau Meteorology33(6): 1648-1653.DOI: 10.7522/j.issn.1000-0534.2014.00080 .
null
史玉光, 2014.新疆降水与水汽的时空分布及变化研究[M].北京: 气象出版社, 79-81.
null
Shi Y G2014.The space time distribution of precipitation and water vapor and change in Xinjiang[M].Beijing: China Meteorological Press, 79-81.
null
万蓉, 郑国光, 2008.地基GPS在暴雨预报中的应用进展[J].气象科学28(6): 697-702.DOI: 10.3969/j.issn.1009-0827.2008.06.019.Wan R
null
Zheng G G2008.Advances in the application of ground based GPS data to rainstorm forecast and nowcasting [J].Journal of the Meteorological Sciences28(6): 697-702.DOI: 10.3969/j.issn.1009-0827.2008.06.019 .
null
王灏, 胡泽勇, 杨耀先, 等, 2023.近60 年青藏高原季风期降水的南北变化特征及机理研究[J].高原气象42(4): 848-857.DOI: 10.7522/j.issn.1000-0534.2023.00034.Wang H
null
Hu Z Y Yang Y X, et al, 2023.The changing features and the mechanism of the precipitation in southern-northern Qinghai-Xizang Plateau during monsoon period in last 60 Years[J].Plateau Meteorology42(4): 848-857.DOI: 10.7522/j.issn.1000-0534.2023.00034 .
null
王娜, 顾伟宗, 邱粲, 等, 2021.山东夏季空中水汽分布和水汽输送特征[J].高原气象40(1): 159-168.DOI: 10.7522/j.issn.1000-0534.2019.00119.Wang N
null
Gu W Z Qiu C, et al, 2021.Characteristics of atmospheric water vapor distribution and transport during summer over Shandong Province[J].Plateau Meteorology40(1): 159-168.DOI: 10.7522/j.issn.1000-0534.2019.00119 .
null
王天竺, 赵勇, 2021.夏季青藏高原和热带印度洋热力异常对塔里木盆地夏季降水的影响[J].气候与环境研究26(3): 275-288.DOI: 10.3878/j.issn.1006-9585.2021.20092.Wang T Z
null
Zhao Y2021.Influences of summer thermal anomalies over the Tibetan Plateau and the Tropical Indian Ocean on summer rainfall in the Tarim Basin[J].Climatic and Environmental Research26(3): 275-288.DOI: 10.3878/j.issn.1006-9585.2021.20092 .
null
肖开提·多莱特, 2005.新疆降水量级标准的划分[J].新疆气象28(3): 7-8.
null
Xiaokaiti D2005.Formulation of Precipitation Intensity Standard of Xinjiang[J].Bimonthly of Xinjiang Meteorology28(3): 7-8.
null
杨莲梅, 王世杰, 史玉光, 等, 2012.乌鲁木齐夏季强降水过程GPS-PWV的演变特征[J].高原气象31(5): 1348-1355.DOI: 10.7522/j.issn.1000-0534(2012)05-1348-08.Yang L M
null
Wang S J Shi Y G, et al, 2012.Evolution feature of precipitable water vapor derived from ground-based GPS during summer heavy precipitation in Urumqi[J].Plateau Meteorology31(5): 1348-1355.DOI: 10.7522/j.issn.1000-0534(2012)05-1348-08 .
null
杨莲梅, 张广兴, 崔彩霞, 2006.塔里木盆地气候变化的季节差异[J].气候变化研究进展2(4): 168-172.DOI: 10.3969/j.issn.1673-1719.2006.04.004.Yang L M
null
Zhang G X Cui C X2006.Seasonal difference of climate change in Tarim Basin, Xinjiang [J].Climate Change Research2(4): 168-172.DOI: 10.3969/j.issn.1673-1719.2006.04.004 .
null
杨青, 刘晓阳, 崔彩霞, 等, 2010.塔里木盆地水汽含量的计算与特征分析[J].地理学报65(7): 853-862.
null
Yang Q Liu X Y Cui C X, et al, 2010.The computation and characteristics analysis of water vapor contents in the Tarim Basin, China[J].Acta Geographica Sinica65(7): 853-862.
null
姚俊强, 杨青, 陈亚宁, 等, 2013.西北干旱区气候变化及其对生态环境影响[J].生态学杂志32(5): 1283-1291.DOI: 10.13292/j.1000-4890.2013.0221.Yao J Q
null
Yang Q Chen Y N, et al, 2013.Climate change in arid areas of Northwest China in past 50 years and its effects on the local ecological environment [J].Chinese Journal of Ecology32(5): 1283-1291.DOI: 10.13292/j.1000-4890.2013.0221 .
null
姚俊强, 杨青, 黄俊利, 等, 2012.天山山区及周边地区大气水汽含量的计算与特征分析[J].干旱区研究29(4): 567-573.DOI: 10.13866/j.azr.2012.04.018.Yao J Q
null
Yang Q Huang J L, et al, 2012.Computation and analysis of water vapor content in the Tianshan mountains and peripheral regions, China [J].Arid Zone Research29(4): 567-573.DOI: 10.13866/j.azr.2012.04.018 .
null
于晓晶, 唐永兰, 于志翔, 等, 2019.基于地基GPS资料的天山山区夏季大气可降水量特征[J].气象45(12): 1691-1699.DOI: 10.7519/j.issn.1000-0526.2019.12.006.Yu X J
null
Tang Y L Yu Z X, et al, 2019.Characteristics of precipitable water vapor over the Tianshan mountains based on GPS observations [J].Meteorological Monthly45(12): 1691-1699.DOI: 10.7519/j.issn.1000-0526.2019.12.006 .
null
张端禹, 王明欢, 陈波, 2010.2008年8月末湖北连续大暴雨的水汽输送特征[J].气象36(2): 48-53.DOI: 10.7519/j.issn.1000-0526.2010.2.007.Zhang D Y , WangM H, ChenB, 2010.Features of moisture transportation in a continuous torrential rain in Hubei province at the end of August 2008[J].Meteorological Monthly, 36(2): 48-53.DOI: 10.7519/j.issn.1000-0526. 2010.2.007 .
null
张家宝, 邓子风, 1987.新疆降水概论[M].北京: 气象出版社.Zhang J B, Deng Z F, 1987.Introduction to precipitation in Xinjiang [M].Beijing: China Meteorological Press.
null
赵克明, 黄艳, 于碧馨, 2017.2013年南疆西部暴雨天气的水汽特征[J].气象科技45(1): 121-129.DOI: 10.19517/j.1671-6345.20160026.Zhao K M
null
Huang Y Yu B X2017.Water vapor characteristics of rainstorm weather processes over Western South Xingjiang in 2013 [J].Meteorological Science and Technology45(1): 121-129.DOI: 10.19517/j.1671-6345.20160026 .
null
赵玲, 梁宏, 崔彩霞, 2006.乌鲁木齐地基GPS数据的解算和应用[J].干旱区研究23(4): 654-65.DOI: 10.13866/j.azr.2006.04.025.Zhao L
null
Liang H Cui C X2006.Solution and application of the ground-based GPS data in Urumqi, Xinjiang[J].Arid Zone Research23(4): 654-657.DOI: 10.13866/j.azr.2006.04.025 .
Outlines

/