Relationship between Spring Dust Activity and the Position Change of Westerly Jet in Taklimakan Desert

  • Shanjuan HE ,
  • Tianhe WANG ,
  • Ruiqi TAN ,
  • Xinyi ZHANG ,
  • Yuanzhu DONG ,
  • Jingyi TANG
Expand
  • 1. College of Atmospheric Sciences,Lanzhou University,Lanzhou 730000,Gansu,China
    2. Collaborative Innovation Center for Western Ecological Safety,Lanzhou University,Lanzhou 730000,Gansu,China

Received date: 2023-12-29

  Revised date: 2024-03-23

  Online published: 2024-03-23

Abstract

Based on MERRA-2 reanalysis data and the dust records at meteorological stations from 1980 to 2020, we have defined the Westerly Jet stream Position Index (JPI) and provided preliminary insights into the impact of north-south movement of westerly jet stream on dust activity in the Taklamakan Desert (TD).By conducting a comparative analysis of the dust mixing ratio, frequency of dust events, and the atmospheric circulation fields during periods characterized by northward and southward shifts in the jet stream, we have derived the following conclusions: (1) The position of the westerly jet stream in spring exhibits obvious fluctuation between different years, and the interannual variation trend between different months is also different.The meridional movement is mainly caused by the changes of the north-south temperature gradient over the TD.When the temperature decreases in the southern regions and increases in the northern regions, the north-south temperature gradient decreases, causing the jet stream to shift northward.(2) The spring dust activity in the TD exhibits a significant correlation with the positional changes of the westerly jet stream.The dust mixing ratio within the atmospheric column experiences substantial increases (decreases) as the jet stream shifts towards the north (south).The difference in dust mixing ratio is greater in the lower layers than in the middle to upper layers.(3) The frequency of dust events in the TD during spring is closely correlated with the north-south movement of the jet stream.The northward shift of the jet stream leads to an elevation in the average occurrence of floating dust, blowing sand, and dust storms throughout each month in spring.The difference in the number of dust weather days caused by the positional shift of the jet stream is more significant in March and May compared to April.Especially episodes of floating dust, there is an average difference of up to 3 days between northward and southward shifts of the jet stream in May.(4) The northward migration of the westerly jet stream during spring alters the atmospheric circulation fields and exerts a profound influence on the emission and transportation of dust in the hinterland of TD.The abnormal anticyclone dominates the middle and upper atmosphere of the Tibetan Plateau and TD, intensifying the westerly jet stream over the desert and augmenting downward momentum transfer.Additionally, abnormal easterly winds manifest in the lower atmosphere, leading to an increase in the surface wind speed.These new findings will be helpful for understanding the formation mechanisms of spring dust activities in the TD and provide scientific basis and reference for climate change in the arid regions of Northwest China.

Cite this article

Shanjuan HE , Tianhe WANG , Ruiqi TAN , Xinyi ZHANG , Yuanzhu DONG , Jingyi TANG . Relationship between Spring Dust Activity and the Position Change of Westerly Jet in Taklimakan Desert[J]. Plateau Meteorology, 2024 , 43(6) : 1573 -1585 . DOI: 10.7522/j.issn.1000-0534.2024.00042

1 引言

沙尘气溶胶是大气气溶胶的重要组成部分, 在大气热力结构中起着至关重要的作用, 可通过散射和吸收太阳短波辐射以及地球长波辐射, 造成地-气系统在大气层顶和地表处的长/短波净辐射通量发生改变, 从而影响地球和大气圈的辐射收支平衡, 被称为沙尘的直接效应(Wang et al, 2013; Huang et al, 2014; Wang et al, 2020; 牛瑞佳等, 2023); 此外, 沙尘作为冰核或云的凝结核, 改变云的微物理结构, 从而影响云的辐射特性和降水, 影响全球水循环与气候变化(Yin et al, 2002; McGraw et al, 2020); 悬浮在大气中的沙尘粒子可以沉降到大西洋、 太平洋等海域, 改变海洋碳收支, 引起海洋的肥料效应(van der Does et al, 2021; Ridame et al, 2014)。塔克拉玛干沙漠位于中国新疆的塔里木盆地中央, 是中国最大、 世界第二大的流动性沙漠。由于其独特的地形条件, 近地表偏东风可将地表丰富的沙尘释放到空中。春季塔克拉玛干沙漠沙尘排放量可达70.54 Tg·a-1, 占东亚地区沙尘排放总量的42%(Chen et al, 2017)。此外, 塔克拉玛干沙漠沙尘还可能被抬升至数千米的高空, 与来自中亚地区和戈壁沙漠的沙尘气溶胶共同构成了一条强沙尘输送带(Han et al, 2022a, 2022b; Yang et al, 2022), 并伴随西风急流远距离输送到太平洋, 甚至到达北美西部(Huang et al, 2008; Sun et al, 2001)。因此, 揭示春季塔克拉玛干沙漠沙尘的排放和输送机制具有重要意义。
目前, 对于塔克拉玛干沙漠沙尘的研究主要侧重于其内部的沙尘暴过程分析、 引起沙尘暴的各种气象因子、 沙尘暴的形成机制、 环流分析以及沙尘污染的防治。大多数研究发现, 尘源区沙尘暴的发生与地表风速、 降水量和地表温度等气象要素有关(Wu et al, 2021; Kurosaki and Mikami, 2005), 降水量和植被指数的增加会降低沙尘暴频率, 而风速的增加会增加沙尘暴频率(Aili et al, 2021), 基于地面气象观测资料的研究表明, 在3、 4月地表风速是导致沙尘暴发生的主要原因(Kurosaki and Mikami, 2005)。另外通过对塔克拉玛干沙漠和戈壁沙漠春季沙尘暴的特征差异对比分析得出, 东西向的地面冷锋系统是塔克拉玛干沙漠沙尘暴的主要影响系统(李亚云等, 2023)。
除了地面气象要素以外, 各种大、 中尺度的环流系统对塔克拉玛干沙漠沙尘的排放和输送的影响也不容忽视, 环流不仅为沙尘事件的发生提供条件, 还能调节尘源区沙尘输送的大小和方向, 从而影响沙尘天气的强度和覆盖范围(曼吾拉·卡德尔等, 2023)。在这些环流系统中, 高低空急流在北半球沙尘活动中扮演重要角色, 能够影响南亚沙尘向青藏高原及下游地区的输送(Wang et al, 2021)。在塔克拉玛干沙漠低空急流常出现于夜间, 通过动量下传增加地表风速, 驱动沙尘排放(Ge et al, 2016; 张建涛等, 2020), 促进沙尘的远程输送。相对于低空急流, 高空西风急流在整个北半球任何时期都存在, 对北半球天气和气候的影响更为持久。北半球沙尘源地和下游区域的沙尘活动与西风急流的强度和位置的变化存在密切的联系(Fan and Wang, 2006; Han et al, 2008; 钟海玲和李栋梁, 2005), 陈晓光等(2006)发现宁夏强和特强沙尘暴天气过程发生时, 一般有高空急流存在。许多研究通过对沙尘暴发生的多少年的环流场对比研究发现, 当200 hPa高空西风急流轴位置较正常年偏南时, 关键区高空西风减弱, 动量下传减弱, 从而削弱沙尘暴产生的条件(李雪和刘晓东, 2015); 而高层西风急流强度增加, 容易因动量下传引起地面大风, 产生沙尘暴(刘生元等, 2015)。此外, 北极涛动、 南亚高压的东西振荡也通过改变副热带西风急流的强度, 导致塔克拉玛干沙漠沙尘暴频率的变化(Mao et al, 2011; Wang et al, 2023)。春季, 塔克拉玛干沙漠沙尘在地形和弱感热的作用下抬升到几千米的高空, 甚至是对流层中(Tanaka, 2012), 绝大部分沙尘在西风急流的控制下向东输送到中国东部以及太平洋(Yang et al, 2021), 只有小部分被输送到青藏高原北部和天山(Yuan et al, 2019; 李本涛等, 2023)。
综上所述, 无论是尘源地沙尘的排放还是高层沙尘的东向输送, 都与西风急流密切相关, 然而目前的一些研究着重于从一次沙尘暴事件或者沙尘暴活动的强弱年等沙尘活动角度去对比环流特征, 理解环流变化对沙尘活动的影响, 比如直接研究春季或冬季季节平均的环流场来解释沙尘变化的原因, 忽略了环流场的月变化特征。其次, 关于急流位置变化与沙尘排放和输送的影响机制尚未完善, 由此, 本文将从急流的角度出发, 揭示春季各月急流的南北位置变化对塔克拉玛干沙漠沙尘的影响, 并推测西风急流对沙尘活动的可能影响机制。

2 数据来源与方法介绍

2.1 沙尘天气站点数据与日数统计方法

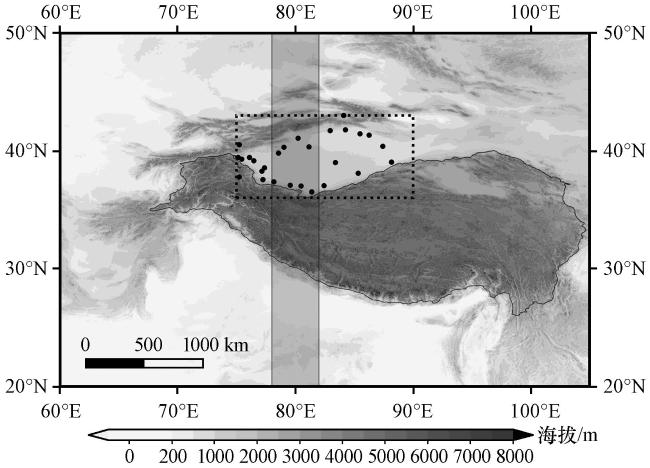
本文使用1980 -2020年塔克拉玛干沙漠上27个气象站点沙尘天气日数资料, 该数据记录了各站点发生各类沙尘天气的日期, 站点位置如图1中的黑点所示。沙尘事件主要根据能见度和风速分为三种类型(即: 沙尘暴、 扬沙和浮尘)(Wang et al, 2005)。沙尘暴伴随着大风, 大风可以有效地抬升和输送沙尘气溶胶, 水平能见度低于1 km。与沙尘暴相比, 扬沙较弱, 能见度通常在1~10 km, 而浮尘通常发生在风小、 能见度小于10 km的静风天气条件下(Kang et al, 2016)。本文统计沙尘天气日数的方法如下: 当某日发生某类沙尘天气的站点超过三个, 就记该类沙尘天气在该日发生一次, 统计每一年春季各月发生浮尘、 扬沙和沙尘暴的平均日数用于之后的分析。
图1 研究区域及站点位置

黑色虚线框为塔克拉玛干沙漠, 黑点为站点位置, 浅灰色带为计算急流位置指数的范围

Fig.1 The study area and station location.The black box is the Taklimakan Desert, the black dot is the station location, and the light gray belt is the range for calculating the jet position index

2.2  MERRA-2再分析数据与急流位置指数的定义

本文使用的数据来自美国宇航局全球模式和同化办公室(GMAO)制作的现代卫星时代的最新大气再分析数据——现代研究与应用回顾分析第2版(MERRA-2), 该数据集提供自1980年以来的再分析数据, 将戈达德化学气溶胶辐射传输模式(GOCART)的气溶胶模块与GEOS-5模式耦合, 可以较好地呈现全球范围内气溶胶光学特性的垂直结构(Buchard et al, 2017)。选取了1980 -2020年春季的MERRA-2逐月风场气压层数据, 垂直方向共有42层, 用于分析气象场的特征; 逐3 h风场、 垂直速度数据、 逐3 h沙尘混合比模式层数据, 垂直方向共有72层, 被用于分析沙尘的垂直运动和分布特征。为了便于研究, 将所有逐3 h数据处理成月数据, 并将所有数据插值在1°×1°网格。
为了表示西风急流的位置变化, 采用与Sun et al(2020)相同的方法定义了一个西风急流位置指数(Jet Position Index, JPI), 用于表征西风急流的南北移动, 该指数为区域上每个经度风速最大值的位置所在纬度的平均值, 其中风速由200 hPa经向风和纬向风合成。青藏高原作为世界上海拔最高的高原, 由于其独特地形的阻挡作用(Xie et al, 2023), 上空西风急流经过时会受到高耸地形的影响而发生绕流, 出现不同程度的弯曲。考虑到西风位置随纬度的变化(Schiemann et al, 2009), 较大区域内纬度的平均值可能会影响急流位置指数的代表性。因此, 使用78°E -82°E范围内(图1中的浅灰色带)标准化后的月平均急流轴纬度平均值来代替塔克拉玛干沙漠上空的西风急流位置指数, 避免了西风急流位置指数的客观定义, 以此来反映研究时段内急流相对于气候态的南北移动。当急流位置指数为正值时, 表示急流偏北; 当指数为负值时, 表示急流偏南。

3 结果分析

3.1 春季塔克拉玛干沙漠上空西风急流的变化特征

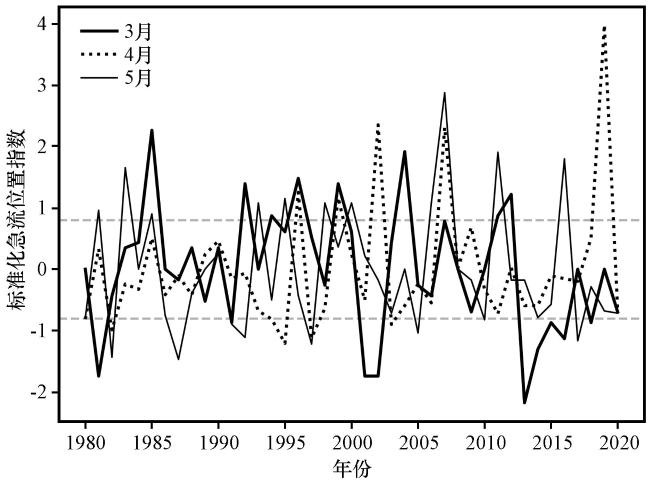
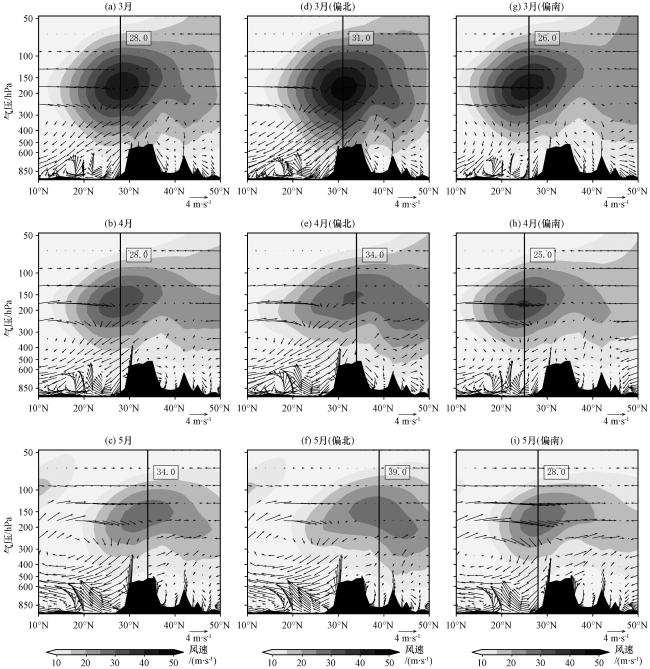
春季塔克拉玛干沙漠上空西风急流标准化后的位置指数年际变化如图2所示, 各月均呈现波动式的变化。3、 4月急流平均位于青藏高原南部28°N左右, 而5月则是整体北移至青藏高原北部35°N(图3)。在20世纪90年代之前, 3月西风急流的位置变化不大, 在20世纪90年代之后, 有逐渐北移的趋势, 但在21世纪西风急流显著南移。4月西风急流的位置变化自1995年之后较为剧烈, 总体上有北移的趋势。相比之下, 从1980 -2020年, 5月西风急流位置指数的波动性非常大, 相邻两年之间位置指数的差值较大, 从总体来看, 5月西风急流的位置指数的年际变化趋势并不明显。
图2 各月标准化急流位置指数(JPI)的年际变化

灰色虚线表示JPI值为0.8和-0.8, 用于挑选各月急流偏南年和偏北年

Fig.2 The interannual variation of the monthly standardized jet position index (JPI).The gray dotted line indicates that the JPI is 0.8 and -0.8, used to select the selection of the southern and northern years of the monthly jet

图3 春季各月平均态、 偏北年、 偏南年80°E风场垂直剖面

(a) 3月, (b) 4月, (c) 5月, (d) 3月偏北, (e) 4月偏北, (f) 5月偏北, (g) 3月偏南, (h) 4月偏南, (i) 5月偏南; 灰色填色为风速大小(单位: m·s-1), 矢量为v和ω合成风速(单位: m·s-1), 黑色实线为急流中心所在纬度, 数值为纬度大小, 黑色填色为地形

Fig.3 Vertical profile of 80°E wind field in monthly mean state, north year and south year in spring.(a) March, (b) April, (c)May, (d) March (North), (e) April (North), (f) May (North), (g) March(South), (h) May (South), (i) May (South); The gray color is the wind speed (unit: m·s-1), the vectors are v, ω synthetic wind speed (unit: m·s-1), the black solid line is the latitude of the jet center, the value is the latitude, and the black color is the topography

根据图2, 分别选取各月标准化后的急流位置指数大于0.8的年份作为急流偏北年, 小于-0.8的年份作为急流偏南年, 挑选结果如表1所示。我们对春季各月偏北, 偏南年的风场进行比较, 各月急流的位置和强度明显不同。3月气候态的急流中心位于28°N附近[图3(a)], 偏北年则位于31°N [图3(d)], 偏南年位于26°N [图3(g)], 偏北年急流中心风速大于偏南年, 中心风速达45 m·s-1以上。相比于3月, 4月急流强度明显减弱[图3(b)], 中心风速在35 m·s-1以下, 但急流位置变化不明显, 其气候态急流中心仍位于28°N, 偏北年急流中心位于34°N [图3(e)], 偏南年位于25°N [图3(h)], 偏北年急流强度小于偏南年。到了5月, 急流整体继续北移至34°N [图3(c)], 且强度持续减弱, 急流中心风速甚至小于30 m·s-1, 此时偏北年急流位于39°N [图3(f)], 偏南年位于28°N [图3(i)]。相比于3月, 4、 5月急流的南北移动幅度更大, 偏北偏南年急流中心纬度相差达到10°。急流的平均态位置的变化与Schiemann et al(2009)的研究结论一致。
表1 春季各月对应的急流偏北和偏南的年份

Table 1 The northerly and southerly years of the jet corresponding to each month in spring

月份 偏北年 偏南年
3月 1985, 1992, 1994, 1996, 1999, 2004, 2011, 2012 1981, 1991, 2001, 2002, 2013, 2014, 2015, 2016, 2018
4月 1996, 1999, 2002, 2007, 2019 1980, 1982, 1994, 1995, 1997, 2003
5月 1981, 1983, 1985, 1993, 1995, 1998, 2000, 2006, 2007, 2011, 2016 1982, 1987, 1991, 1992, 1997, 2005, 2010, 2017
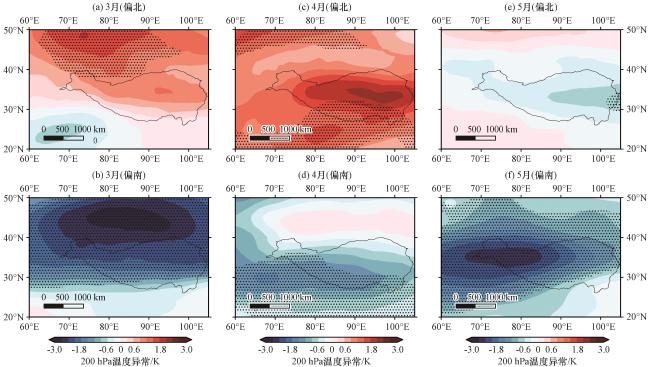
西风带是由于太阳辐射加热在南北方向上的差异和地球的自转形成的。我们也探讨了春季各月急流南北移动的原因。图4展示了各月急流偏南和偏北年的200 hPa温度的异常分布。当3月急流偏北时, 北侧有温度正异常, 南侧为温度负异常, 南北温度梯度减小; 而当急流偏南时, 北侧出现较大的温度负异常, 南北温度梯度增加; 5月情况与3月类似[图4(c)], 因此3、 5月急流的南北移动与南北温度梯度的变化有关, 南北温度梯度的减小导致急流的北移, 与况雪源和张耀存(2006)研究结果一致。4月情况与其他月份不一致, 急流偏南时, 青藏高原上空的大气温度比平均态低, 急流偏北时整个青藏高原上空温度升高[图4(c), (d)]。这种升温现象导致其高原上的上升运动和向外的辐散运动增强, 使得高原北侧西风急流增强, 高原上空西风急流减弱, 引起西风急流的北移(董敏等, 2001)。
图4 春季各月急流偏北、 偏南时200 hPa温度异常的空间分布(单位: K)

(a)3月(偏北), (b) 3月(偏南), (c) 4月(偏北), (d) 4月(偏南), (e) 5月(偏北), (f) 5月(偏南); 打点区域通过90%显著性检验

Fig.4 The spatial distribution of 200 hPa temperature anomaly in the north and south of the jet in each month in spring.Unit: K.(a) March (North), (b) March (South), (c) April (North), (d) April (South), (e) May (North), (f) May (South).The management area passed the 90% significance test

3.2 春季塔克拉玛干沙漠急流偏北、 偏南年沙尘活动的差异

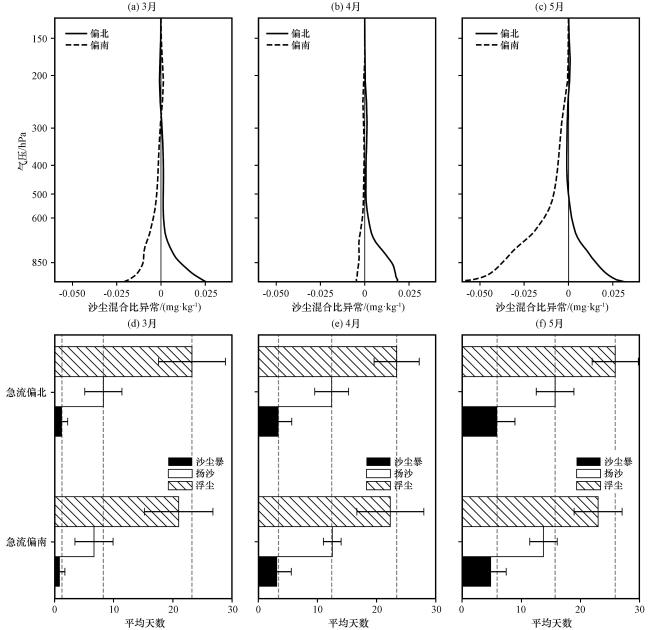
为探究春季急流位置的南北变化与塔克拉玛干沙漠沙尘活动的联系, 我们分别绘制各月急流偏北年和偏南年塔克拉玛干沙漠沙尘混合比异常的垂直廓线与塔克拉玛干区域站点上的浮尘、 扬沙、 沙尘平均日数分布(图5)。从各月沙尘混合比异常的垂直廓线来看[图5(a)~(c)], 整体上急流偏北对应塔克拉玛干沙漠沙尘混合比的正异常, 急流偏南对应沙尘混合比的负异常。3月, 正负沙尘混合比的异常从地面持续至300 hPa, 在300 hPa以上, 特别是200 hPa高度处, 急流偏南反而对该高度上的沙尘输送有增强作用, 但增强作用极弱。4月沙尘混合比的正负异常与急流的偏北偏南有很好的对应关系, 且这种正负异常从地面一直延伸至高空, 但急流偏南导致的沙尘混合比异常较弱, 在低层不超过-0.01 mg·kg-1。5月急流偏南时, 对应塔克拉玛干沙漠沙尘混合比从地面到高空的较大的负异常, 在985 hPa可达到-0.06 mg·kg-1, 然而, 当急流偏北时, 从地面到500 hPa沙尘混合比为正异常, 500~200 hPa转为极弱的负异常, 这种情况可能与5月急流偏北时, 急流强度的减小有关。
图5 春季各月塔克拉玛干沙漠区域急流偏北、 偏南时沙尘混合比异常的垂直廓线(a~c)以及浮尘、 扬沙和沙尘暴平均日数(d~f)差异

(a, d) 3月, (b, e) 4月, (c, f) 5月

Fig.5 Vertical profile of abnormal dust mixing ratio (a~c) and difference of average days (d~f) of floating dust, blowing sand and sandstorm in the north and south of the jet stream in the Taklimakan Desert in spring.(a, d) March, (b, e) April, (c, f) May

从急流各月急流偏北偏南时塔克拉玛干区域站点记录的月平均沙尘日数的变化[图5(d), (e), (f)]来看, 浮尘、 扬沙、 沙尘暴的月平均日数在春季逐月增加。各月浮尘平均日数均超过20天, 远多于其他两种沙尘天气类型, 塔克拉玛干沙漠几乎每天都有站点显示浮尘天气的发生, 浮尘天气在塔克拉玛干沙漠占主导地位(Huang et al, 2008), 5月, 各类沙尘事件较为频繁地出现在塔克拉玛干沙漠, 浮尘、 扬沙、 沙尘暴的平均日数都多于其余月份, 导致5月沙尘浓度远高于其他月份(潘诗娴等, 2022)。研究发现, 急流的位置变化与各类沙尘事件的平均日数呈现正相关, 除了4月扬沙日数在偏南偏北时几乎一致外, 其余各月沙尘事件平均日数在急流偏北时均多于急流偏南时。3月急流偏北引起的浮尘、 扬沙天气平均日数比偏南时多2天左右, 但沙尘暴平均日数的差别不大, 这也与3月沙尘暴发生频率较少有关。4月, 急流南北移动对各类沙尘事件发生日数的影响均没有3、 5月显著, 各类沙尘事件在5月增加, 急流的南北移动对5月各类沙尘事件的发生日数影响更为明显, 尤其是浮尘天气, 在急流偏北偏南时的平均日数相差达到3天。

3.3 春季塔克拉玛干沙漠急流偏北和偏南年的环流场差异

已有研究表明, 塔克拉玛干沙漠沙尘活动的频率和强度与该区域的近地表气象因子和大气环流有关, 其中, 风速是导致沙尘暴发生最直接的气象因子(Xiao et al, 2008; 杨显玉等, 2023; 邱玉珺等, 2008)。因此, 本文对影响塔克拉玛干沙漠风场的高低空环流场进行了分析。
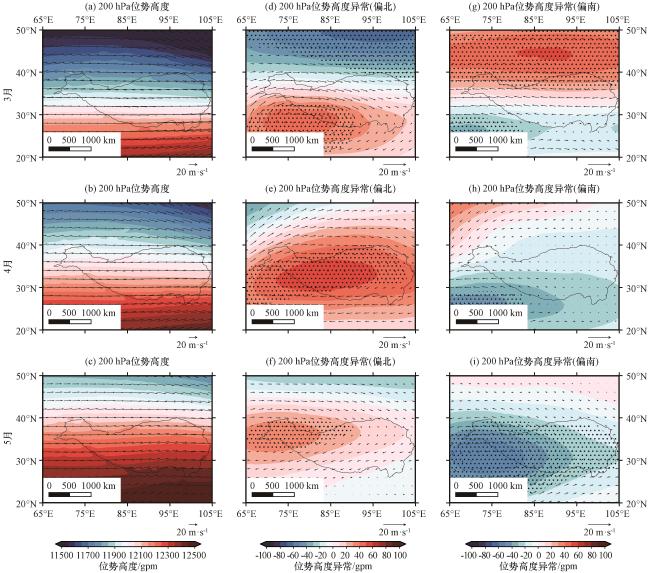
200 hPa上塔克拉玛干沙漠被西风控制[图6(a)~(c)], 当急流偏北时, 各月在200 hPa会出现一个异常反气旋和气旋, 随着月份的变化, 反气旋逐渐北移至塔克拉玛干上空, 其强度在4月最大。3月, 异常反气旋中心位于青藏高原西南部, 异常气旋中心位于青藏高原东北部[图6(d)], 此时, 异常的反气旋和气旋在塔克拉玛干上空产生一个异常西风, 加强原本的西风急流。4、 5月异常反气旋中心北移至青藏高原上空, 但仍在塔克拉玛干上空产生异常西风。增强的高空西风急流能够加强沙尘向下游的输送能力, 同时在西风急流下沉支的作用下将动量下传, 从而增强地表风速(Wang et al, 2021; 韩经纬等, 2007), 促进塔克拉玛干沙漠沙尘的排放。当急流偏南时, 气旋、 反气旋的分布与偏北时相反, 异常的气旋主导青藏高原及塔克拉玛干沙漠上空的环流, 其强度在5月达到最大[图6(i)], 产生异常东风, 削弱西风急流, 沙尘向下游的输送能力被削弱, 同时动量下传减弱, 进一步对塔克拉玛干沙漠沙尘的排放起到抑制作用。春季的反气旋中心也随着急流的北移呈现出逐月北移的趋势。由此可见, 急流位置的偏北、 偏南导致200 hPa出现相反的异常环流场, 导致塔克拉玛干沙漠上空产生相反的异常风场, 对西风急流产生不同的作用, 影响高层沙尘的输送以及地面沙尘的排放。
图6 春季各月急流偏北、 偏南时200 hPa位势高度及其异常分布(单位: gpm)

(a) 3月, (b) 4月, (c) 5月, (d) 3月偏北, (e) 4月偏北, (f) 5月偏北, (g) 3月偏南, (h) 4月偏南, (i) 5月偏南。矢量为风场及风场异常(单位: m·s-1), 打点区域通过90%显著性检验

Fig.6 The 200 hPa geopotential height (HGT) and its anomaly distribution when the jet in spring is biased north or south.Unit: gpm.(a) March, (b) April, (c)May, (d) March(North), (e) April (North), (f) May (North), (g) March (South), (h) May (South), (i) May (South).The vectors in the figure are wind fields and wind field anomalies (unit: m·s-1), and the dotted area passes the 90% significance test

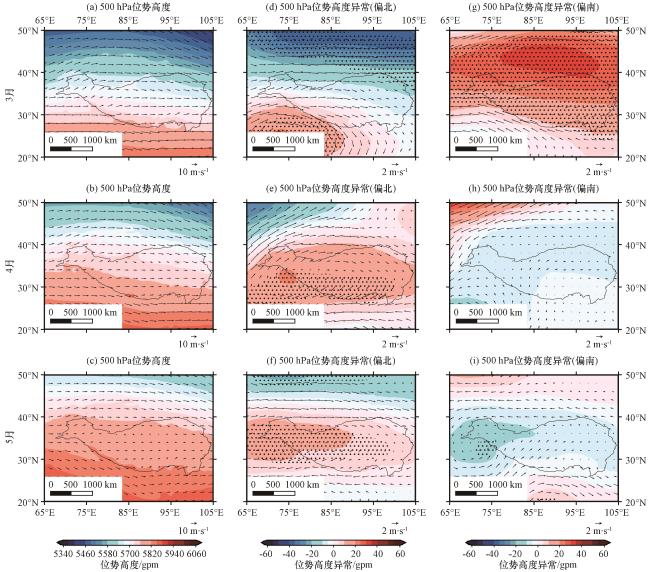
对于500 hPa的风场, 春季各月仍以西风为主[图7(a)~(c)], 急流偏南偏北时的异常气旋、 反气旋的分布情况与200 hPa几乎一致。急流偏北时, 依旧在塔克拉玛干沙漠上空产生异常西风, 急流偏南则相反, 与200 hPa相比, 500 hPa异常气旋、 反气旋出现的位置更偏南, 表明动量是从上到下传递, 且逐渐向南传播(李雪和刘晓东, 2015)。
图7 春季各月急流偏北、 偏南时500 hPa位势高度及其异常分布(单位: gpm)

(a) 3月, (b) 4月, (c) 5月, (d) 3月偏北, (e) 4月偏北, (f) 5月偏北, (g) 3月偏南, (h) 4月偏南, (i) 5月偏南。矢量为风场及风场异常(单位: m·s-1), 打点区域通过90%显著性检验

Fig.7 The 500 hPa geopotential height (HGT) and its anomaly distribution when the jet in spring is biased north or south.Unit: gpm.(a) March, (b) April, (c)May, (d) March(North), (e) April (North), (f) May (North), (g) March (South), (h) May (South), (i) May (South).The vectors in the figure are wind fields and wind field anomalies (unit: m·s-1), and the dotted area passes the 90% significance test

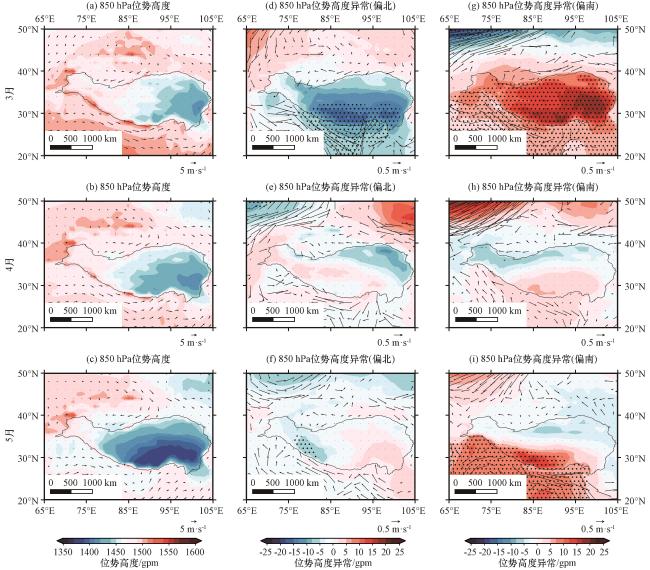
850 hPa的环流场在春季各月体现为青藏高原上空的低压中心[图7(a)~(c)], 因此在塔克拉玛干区域盛行偏东风或者东北风(Sun et al, 2001; Wang et al, 2023), 3月急流偏北时, 在青藏高原上仍为异常气旋[图8(d)], 在塔克拉玛干沙漠上空产生异常偏东风增强原本的东风, 增加沙尘事件发生频率, 同时, 沙漠上空600 hPa以上有一明显的上升气流[图3(d)], 控制沙尘向上输送; 急流偏南时, 青藏高原上为异常反气旋[图8(g)], 产生异常西风, 风场减弱, 不利于起沙, 且其上部为下沉气流[图3(g)], 沙尘不容易输送到高层, 最终导致3月急流偏南时沙尘混合比小于偏北时[图5(a)]。4月急流偏南偏北时, 都在青藏高原产生一个异常气旋[图8(e), (h)], 但异常气旋出现的位置不同, 急流偏北时异常反气旋位于青藏高原东北部, 在塔克拉玛干沙漠东部和青藏高原北部产生异常东风, 导致塔克拉玛干沙漠东部和青藏高原北部沙尘排放增加, 而在塔克拉玛干沙漠西部产生异常西风, 对西部的沙尘排放起到抑制作用, 但此时沙漠上空仍为上升气流携带沙尘向上输送[图3(e)]; 当急流偏南时, 异常气旋在青藏高原北部以及西北部, 在塔克拉玛干沙漠上空产生异常东风, 促进塔克拉玛干沙漠沙尘排放, 沙漠上空的上升气流比偏北时更强[图3(h)], 沙尘的向上输送也更强, 但是由于急流偏南时500 hPa和200 hPa均产生异常东风, 减弱上空沙尘的东向输送, 同时动量下传减弱, 最终导致急流偏南时沙尘混合比呈现负异常, 但其值比其余月份小。5月急流偏北时, 在青藏高原东部产生异常反气旋, 西部则是异常气旋[图8(f)], 异常气旋的存在使塔克拉玛干沙漠产生异常东风, 风速增大, 促进沙尘的排放; 急流偏南时, 在青藏高原北部以及以北区域产生异常气旋, 在青藏高原南部以及以南区域产生异常气旋[图8(i)], 此时在塔克拉玛干沙漠产生的异常风场较为混乱, 对沙尘排放的促进和抑制作用均不明显, 急流偏南偏北时均在塔克拉玛干沙漠上空有上升气流的存在, 沙尘能够向上输送, 但是由于排放的差异, 导致5月沙尘混合比随急流位置变化显示出正负异常。
图8 春季各月急流偏北、 偏南时850 hPa位势高度及其异常分布(单位: gpm)

(a) 3月, (b) 4月, (c) 5月, (d) 3月偏北, (e) 4月偏北, (f) 5月偏北, (g) 3月偏南, (h) 4月偏南, (i) 5月偏南。矢量为风场及风场异常(单位: m·s-1), 打点区域通过90%显著性检验

Fig.8 The 850 hPa geopotential height (HGT) and its anomaly distribution when the jet in spring is biased north or south.Unit: gpm.(a) March, (b) April, (c)May, (d) March(North), (e) April (North), (f) May (North), (g) March(South), (h) May (South), (i) May (South).The vectors in the figure are wind fields and wind field anomalies (unit: m·s-1), and the dotted area passes the 90% significance test

综上所述, 急流的位置变化对塔克拉玛干沙漠沙尘活动的影响是通过调控其上空的大气环流场实现的。当急流偏北时, 中高层200 hPa、 500 hPa均产生异常西风来增强西风急流, 动量下传增强, 促进低层沙尘的排放, 并伴随上升气流, 使得沙尘向上和向下游的输送增强; 急流偏南时则相反, 此时塔克拉玛干沙漠上空高层受异常东风控制, 西风急流被减弱, 动量下传减弱, 不利于沙尘的排放和输送。

4 结论

本文利用了MERRA-2再分析数据和站点沙尘日数据, 对西风急流的位置变化与塔克拉玛干沙漠沙尘之间的关系进行了研究, 西风急流从冷到暖的气候季节变化中逐渐北移, 在此过程中, 还存在季节内、 月内的南北移动, 导致高低层大气环流的不同, 来影响区域内天气和气候。本文重点从急流出发, 选取各月急流偏北偏南年, 分析各月急流偏北、 偏南时环流场的不同, 进而明晰急流位置变化与塔克拉玛干沙漠沙尘之间的联系。
(1) 春季各月西风急流的位置指数随年份呈现很强的波动性。3月急流整体位于青藏高原南部, 强度较强, 4月急流平均态位置不变, 但强度减弱, 5月急流北移至青藏高原北部, 强度持续减弱。从总体上看, 1980 -2020年期间各月西风急流的位置变化有不同的趋势, 3月西风急流有南移趋势, 4月北移, 5月急流位置移动的趋势不明显。
(2) 春季塔克拉玛干沙漠上空急流的南北移动主要由南北温度梯度变化引起的。当南部温度降低, 北部温度升高, 南北温度梯度减小, 急流北移, 反之, 急流南移。
(3) 塔克拉玛干沙漠沙尘活动与急流的南北移动有关, 两者呈现正相关。当急流北移时, 塔克拉玛干沙漠区域在各月出现了低层到高层的沙尘混合比不同程度的增加, 偏南时相反。其次, 急流的南北移动还影响塔克拉玛干沙漠中各类沙尘事件的发生, 当急流北移时, 塔克拉玛干沙漠各月浮尘、 扬沙、 沙尘暴平均日数较偏南时增加。急流的南北移动对沙尘活动的影响有月份的差异, 但总体来看, 急流的北移对沙尘的排放和输送都起促进作用。
(4) 急流的偏南或偏北使得高低空环流场发生变化, 从而引起沙尘的排放和输送发生变化。可以清楚地看到, 当急流偏北时, 从200 hPa开始到850 hPa, 产生能够使塔克拉玛干沙漠上空风场增强的异常风场, 动量下传增强, 从而促进塔克拉玛干沙漠沙尘的排放和输送, 并且伴随沙漠上空存在的上升气流, 使得沙尘能够向上运输到高层; 急流偏南时, 与原本风场相反的异常风场控制塔克拉玛干沙漠区域, 因此, 从上层开始直到低层风场均被削弱, 动量下传减弱, 使得该地区沙尘的排放和输送也被抑制。
从本文的结果来看, 急流的位置变化与塔克拉玛干沙漠沙尘活动呈现正相关, 但是目前使用的分析方法仍存在不足之处。例如4月急流的南北移动幅度较3月更强(图3), 但其位置变化引起的塔克拉玛干沙漠沙尘活动的异常并没有3月显著(图5), 除了3、 4月急流强度的差异外, 利用月平均数据导致结果被平滑也是使4月结果不显著的原因之一。此外, 引起沙尘的各类气象要素, 以及西风急流等环流系统, 都存在明显的月变化特征, 用月平均风场计算得到的急流位置指数来表征急流的南北移动, 一定程度上会使研究结果显著性不高, 而且直接利用月平均数据进行合成分析还会导致某些气象要素对沙尘活动的影响被弱化, 甚至被忽略。另外, 本文由于研究时长较长, 无法用现有的卫星观测数据对结果进行验证, 在后续的研究工作中, 应该使用日数据进行急流位置的识别和各类气象要素的分析。其次, 各类气象要素的变化与西风急流之间的配置对沙尘活动的共同调控也需要进一步研究。

References

null
AiLi A S J, Xu H L, Liu X H, et al, 2021.Dynamics of dust storm and its response to meteorological conditions and anthropogenic impact in South edge of Taklimakan desert, China[J].MAUSAM, 72(3): 619-626.DOI: 10.54302/mausam.v72i3. 1311 .
null
Buchard V, Randles C A, da Silva A M, et al, 2017.The MERRA-2 aerosol reanalysis, 1980 onward.Part II: evaluation and case studies[J].Journal of Climate, 30(17): 6851-6872.DOI: 10. 1175/JCLI-D-16-0613.1 .
null
Chen S Y, Huang J P, Li J X, et al, 2017.Comparison of dust emissions, transport, and deposition between the Taklimakan Desert and Gobi Desert from 2007 to 2011[J].Science China (Earth Sciences), 60: 1338-1355.DOI: 10.1007/s11430-016-9051-0 .
null
Fan K, Wang H J, 2006.The interannual variability of dust weather frequency in Beijing and its global atmospheric circulation[J].Chinese Journal of Geophysics, 49(4): 892-899.DOI: 10.1002/cjg2.909 .
null
Ge J M, Liu H, Huang J, et al, 2016.Taklimakan Desert nocturnal low-level jet: climatology and dust activity[J].Atmospheric Chemistry and Physics, 16(12): 7773-7783.DOI: 10.5194/acp-16-7773-2016 .
null
Han Y X, Fang X M, Kang S C, et al, 2008.Shifts of dust source regions over Central Asia and the Tibetan Plateau: Connections with the Arctic Oscillation and the westerly jet[J].Atmospheric Environment, 42(10): 2358-2368.DOI: 10.1016/j.atmosenv. 2007.12.025 .
null
Han Y, Wang T H, Tang J Y, et al, 2022a.New insights into the Asian dust cycle derived from CALIPSO lidar measurements[J].Remote Sensing of Environment, 272: 112906.DOI: 10.1016/j.rse.2022.112906 .
null
Han Y, Wang T H, Tan R Q, et al, 2022b.CALIOP-based quantification of Central Asian dust transport[J].Remote Sensing, 14: 1416-1431.DOI: 10.3390/rs14061416 .
null
Huang J P, Minnis P, Chen B, et al, 2008.Long-range transport and vertical structure of Asian dust from CALIPSO and surface measurements during PACDEX[J].Journal of Geophysical Research (Atmospheres), 113: D23212.DOI: 10.1029/2008JD010620 .
null
Huang J P, Wang T H, Wang W C, et al, 2014.Climate effects of dust aerosols over East Asian arid and semiarid regions[J].Journal of Geophysical Research (Atmospheres), 119: 11398-11416 DOI: 10.1002/2014JD021796 .
null
Kang L T, Huang J P, Chen S Y, et al, 2016.Long-term trends of dust events over Tibetan Plateau during 1961-2010[J].Atmospheric Environment, 125: 188-198.DOI: 10.1016/j.atmosenv. 2015.10.085 .
null
Kurosaki Y, Mikami M, 2005.Regional difference in the characteristic of dust event in East Asia: Relationship among dust outbreak, surface wind, and land surface condition[J].Journal of the Meteorolodical Society of Japan, 83: 1-18.DOI: 10.2151/jmsj.83A.1 .
null
Mao R, Ho C H, Shao Y P, et al, 2011.Influence of Arctic Oscillation on dust activity over northeast Asia[J].Atmospheric Environment, 45(2): 326-337.DOI: 10.1016/j.atmosenv.2010.10.020 .
null
McGraw Z, Storelvmo T, David R O, et al, 2020.Global radiative impacts of mineral dust perturbations through stratiform clouds[J].Journal of Geophysical Research: Atmospheres, 125(23): e2019JD031807.DOI: 10.1029/2019JD031807 .
null
Ridame C, Dekaezemacker J, Guieu C, et al, 2014.Contrasted Saharan dust events in LNLC environments: impact on nutrient dynamics and primary production[J].Biogeosciences, 11(17): 4783-4800.DOI: 10.5194/bg-11-4783-2014 .
null
Schiemann R, Lüthi D, Sch?r C, 2009.Seasonality and interannual variability of the westerly jet in the Tibetan Plateau region[J].Journal of Climate, 22(11): 2940-2957.DOI: 10.1175/2008JCLI2625.1 .
null
Sun J M, Zhang M Y, Liu T S, 2001.Spatial and temporal characteristics of dust storms in China and its surrounding regions, 1960-1999: relations to source area and climate[J].Journal of Geophysical Research: Atmospheres, 106(D10): 10325-10333.DOI: 10.1029/2000JD900665 .
null
Sun J, Yang K, Guo W D, et al, 2020.Why has the inner Tibetan Plateau become wetter since the mid-1990s? [J].Journal of Climate, 33(19): 8507-8522.DOI: 10.1175/JCLI-D-19-0471.1 .
null
Tanaka T Y, 2012.Numerical study of the seasonal variation of elevated dust aerosols from the Taklimakan Desert[J].Sola, 8: 98-102.DOI: 10.2151/sola.2012-025 .
null
van der Does M, Brummer G J A, Korte L F, et al, 2021.Seasonality in Saharan dust across the Atlantic Ocean: From atmospheric transport to seafloor deposition[J].Journal of Geophysical Research: Atmospheres, 126(11): e2021JD034614.DOI: 10. 1029/2021JD034614 .
null
Wang C Y, Wang T H, Han Y, et al, 2023.Summer extreme dust activity in the Taklimakan Desert regulated by the South Asian High[J].Remote Sensing, 15(11): 2875.DOI: 10.3390/rs15112875 .
null
Wang H, Shi G Y, Zhu J, et al, 2013.Case study of longwave contribution to dust radiative effects over East Asia[J].Chinese Science Bulletin, 58: 3673-3681.DOI: 10.1007/s11434-013-5752-z .
null
Wang S G, Wang J Y, Zhou Z J, et al, 2005.Regional characteristics of three kinds of dust storm events in China[J].Atmosphere Environment.39(3): 509-520.DOI: 10.1016/j.atmosenv.2004. 09.033 .
null
Wang T H, Han Y, Huang J P, et al, 2020.Climatology of dust-forced radiative heating over the Tibetan Plateau and its surroundings[J].Journal of Geophysical Research (Atmospheres), 125(17): e2020JD032942.DOI: 10.1029/2020JD032942 .
null
Wang T H, Tang J Y, Sun M X, et al, 2021.Identifying a transport mechanism of dust aerosols over South Asia to the Tibetan Plateau: A case study[J].Science of the Total Environment, 758: 143714.DOI: 10.1016/j.scitotenv.2020.143714 .
null
Wu D Y, Liu J, Wang T S, et al, 2021.Applying a dust index over North China and evaluating the contribution of potential factors to its distribution[J].Atmospheric Research, 254: 105515.DOI: 10.1016/j.atmosres.2021.105515 .
null
Xiao F J, Zhou C P, Liao Y M, 2008.Dust storms evolution in Taklimakan Desert and its correlation with climatic parameters[J].Journal of Geographical Sciences, 18: 415-424.DOI: 10.1007/s11442-008-0415-8 .
null
Xie Y K, Huang J P, Wu G X, et al, 2023.Oceanic repeaters boost the global climatic impact of the Tibetan Plateau[J].Science Bulletin, 68(19): 2225-2235.DOI: 10.1016/j.scib.2023.07.019 .
null
Yang K, Wang Z E, Luo T, et al, 2022.Upper troposphere dust belt formation processes vary seasonally and spatially in the Northern Hemisphere[J].Communications Earth & Environment, 3(1): 24.DOI: 10.1038/s43247-022-00353-5 .
null
Yang L, Shi Z G, Sun H, et al, 2021.Distinct effects of winter monsoon and westerly circulation on dust aerosol transport over East Asia[J].Theoretical and Applied Climatology, 144: 1031-1042.DOI: 10.1007/s00704-021-03579-z .
null
Yuan T G, Chen S Y, Huang J P, et al, 2019.Influence of dynamic and thermal forcing on the meridional transport of Taklimakan Desert dust in spring and summer[J].Journal of Climate, 32(3): 749-767.DOI: 10.1175/JCLI-D-18-0361.1 .
null
Yin Y, Wurzler S, Levin Z, et al, 2002.Interactions of mineral dust particles and clouds: effects on precipitation and cloud optical properties[J].Journal of Geophysical Research (Atmospheres), 107(D23): 4724.DOI: 10.1029/2001JD001544 .
null
陈晓光, 纪晓玲, 刘庆军, 等, 2006.200 hPa高空急流与宁夏春季沙尘暴过程的特征分析[J].中国沙漠, 26(2): 238-242.DOI: 10.3321/j.issn: 1000-694X.2006.02.014.Chen X G ,
null
Ji X L, Liu Q J, et al, 2006.Relationship between 200 hPa Jet and Sand storm during Spring in Ningxia[J].Journal of Desert Research, 26 (2): 238-242.DOI: 10.3321/j.issn: 1000-694X.2006.02.014 .
null
董敏, 朱文妹, 徐祥德, 2001.青藏高原地表热通量变化及其对初夏东亚大气环流的影响[J].应用气象学报, 12(4): 458-468.DOI: 10.3969/j.issn.1001-7313.2001.04.008.Dong M ,
null
Zhu W S, Xu X D, 2001.The variation of surface heat flux over Tibet Plateau and its influences on the East Asia circulation in early summer[J].Quarterly Journal of Applied Meteorology, 12(4): 458-468.DOI: 10.3969/j.issn.1001-7313.2001.04.008 .
null
韩经纬, 沈建国, 孙永刚, 等, 2007.一次强沙尘暴和雪暴天气过程的诊断及模拟分析[J].高原气象, 26 (5): 1031-1038.
null
Han J W, Shen J G, Sun Y G, et al, 2007.Dynamic diagnoses and simulating analysis of a severe sandstorm and snowstorm weather process[J].Plateau Meteorology, 26(5): 1031-1038.
null
况雪源, 张耀存, 2006.东亚副热带西风急流季节变化特征及其热力影响机制探讨[J].气象学报, 64(5): 564-575.DOI: 10.3321/j.issn: 0577-6619.2006.05.003.Kuang X Y ,
null
Zhang Y C, 2006.The seasonal variation of the East Asina Subtropical Westerly Jet and its thermal mechanism[J].Acta Meteorologica Sinica, 64(5): 564-575.DOI: 10.3321/j.issn: 0577-6619.2006.05.003 .
null
李本涛, 张镭, 张云舒, 等, 2023.青藏高原沙尘气溶胶时空变化及其来源地分析[J].高原气象, 42(3): 564-574.DOI: 10.7522/j.issn.1000-0534.2022.00100.Li B T ,
null
Zhang L, Zhang Y S, et al, 2023.Temporal and spatial changes of dust aerosol over Qinghai-Xizang (Tibet) Plateau and analysis on its source regions[J].Plateau Meteorology, 42(3): 564-574.DOI: 10.7522/j.issn.1000-0534.2022.00100 .
null
刘生元, 王金艳, 王式功, 等, 2015.春季东亚副热带西风急流的变化特征及其与中国沙尘天气的关系[J].中国沙漠, 35(2): 431-437.DOI: 10.7522/j.issn.1000-694X.2014.00090.Liu S Y ,
null
Wang J Y, Wang S G, et al, 2015.Variation of the East Asian Subtropical Westerly Jet Stream in spring and its relationship with dust weather in China[J].Journal of Desert Research, 35(2): 431-437.DOI: 10.7522/j.issn.1000-694X.2014.00090 .
null
李雪, 刘晓东, 2015.中国北方春季沙尘暴活动与高空西风急流变化的联系[J].高原气象, 34(5): 1292-1300.DOI: 10.7522/j.issn.1000-0534.2014.00067.Li X ,
null
Liu X D, 2015.Relation of spring dust-storm activities in Northern China and changes of upper westerlies[J].Plateau Meteorology, 34(5): 1292-1300.DOI: 10.7522/j.issn.1000-0534.2014.00067 .
null
李亚云, 成巍, 王宁, 等, 2023.塔克拉玛干沙漠和戈壁沙漠春季沙尘暴特征及其气象影响因素对比[J].中国沙漠, 43(4): 1-9.DOI: 10.7522/j.issn.1000-694X.2022.00158.Li Y Y ,
null
Cheng W, Wang N, et al, 2023.Comparative study on the characteristic of spring sandstorms and the related meteorological factors of the Taklimakan Desert and Gobi Desert[J].Journal of Desert Research, 43(4): 1-9.DOI: 10.7522/j.issn.1000-694X.2022.00158 .
null
曼吾拉·卡德尔, 张璐, 刘鑫华, 等, 2023.塔里木盆地两次沙尘天气过程对比分析[J].中国沙漠, 43(4): 76-88.DOI: 10.7522/j.issn.1000-694X.2022.00160.Kader M ,
null
Zhang L, Liu X H, et al, 2023.Comparative analysis of two dust weather processes in Tarim Basin, China [J].Journal of Desert Research, 43(4): 76-88.DOI: 10.7522/j.issn.1000-694X.2022.00160 .
null
牛瑞佳, 文莉娟, 王梦晓, 等, 2023.积雪和沙尘对冰封期青海湖辐射和温度的影响[J].高原气象, 42(4): 913-922.DOI: 10.7522/j.issn.1000-0534.2023.00021.Niu R J ,
null
Wen L J, Wang M X, et al, 2023.Effects of snow and dust on radiation and temperature in Qinghai Lake during ice-covered period[J].Plateau Meteorology, 42(4): 913-922.DOI: 10.7522/j.issn.1000-0534.2023.00021 .
null
潘诗娴, 许潇锋, 罗天阳, 等, 2022.塔克拉玛干沙漠和青藏高原地区沙尘气溶胶光学特性及其加热率的时空分布特征[J].环境科学学报, 42(11): 361-371.DOI: 10.13671/j.hjkxxb.2022.0182.Pan S X ,
null
Xu X F, Luo T Y, et al, 2022.Spatial and temporal characteristics of optical properties and heating rate of dust aerosol over Taklimakan Desert and Tibetan Plateau in China[J].Acta Scientiae Circumstantiae, 42(11): 361-371.DOI: 10.13671/j.hjkxxb.2022.0182 .
null
邱玉珺, 牛生杰, 邹学勇, 等, 2008.沙尘天气频率与相关气象因子的关系[J].高原气象, 27(3): 637-643.
null
Qiu Y J, Niu S J, Zou X Y, et al, 2008.The relationship between dust event frequency and meteorological factors[J].Plateau Meteorology, 27(3): 637-643.
null
杨显玉, 朱俊橙, 文军, 等, 2023.南疆大风气候特征分析及其对沙尘天气的影响[J].高原气象, 42(1): 186-196.DOI: 10.7522/j.issn.1000-0534.2021.00043.Yang X Y ,
null
Zhu J C, Wen J, et al, 2023.Analysis on characteristics of gale climate in South Xinjiang and its influence on sandstrom[J].Plateau Meteorology, 42(1): 186-196.DOI: 10.7522/j.issn.1000-0534.2021.00043 .
null
张建涛, 王敏仲, 何清, 等, 2020.塔克拉玛干沙漠腹地夏季夜间低空急流变化特征[J].中国沙漠, 40(5): 89-100.DOI: 10.7522/j.issn.1000-694X.2020.00056.Zhang J T ,
null
Wang M Z, He Q, et al, 2020.Variation characteristics of nocturnal low-level jet in summer over the hinterland of Taklimakan Desert [J].Journal of Desert Research, 40(5): 89-100.DOI: 10.7522/j.issn.1000-694X.2020.00056 .
null
钟海玲, 李栋梁, 2005.中国北方4月沙尘暴与西风环流的关系[J].高原气象, 24(1): 104-111.DOI: 10.3321/j.issn: 1000-0534.2005.01.016.Zhong H L ,
null
Li D L, 2005.Relationship between sand-dust storm in Northern China in April and Westerly Circulation[J].Plateau Meteorology, 24(1): 104-111.DOI: 10.3321/j.issn: 1000-0534.2005.01.016 .
Outlines

/

〈 〉