

1 引言
2 资料来源和方法介绍
2.1 资料来源
2.2 方法介绍
3 陕南西南涡暴雨时空分布特征及活动路径
表1 2013-2022年陕南暴雨及西南涡暴雨逐月分布Table 1 Monthly distribution of rainstorm in southern Shaanxi and southwest vortex rainstorm from 2013 to 2022 |
| 暴雨日 | 4月 | 5月 | 6月 | 7月 | 8月 | 9月 | 10月 | 总计 |
|---|---|---|---|---|---|---|---|---|
| 暴雨/天 | 4 | 6 | 24 | 30 | 21 | 30 | 4 | 119 |
| 西南涡暴雨/天 | 1 | 4 | 12 | 6 | 5 | 9 | 1 | 38 |
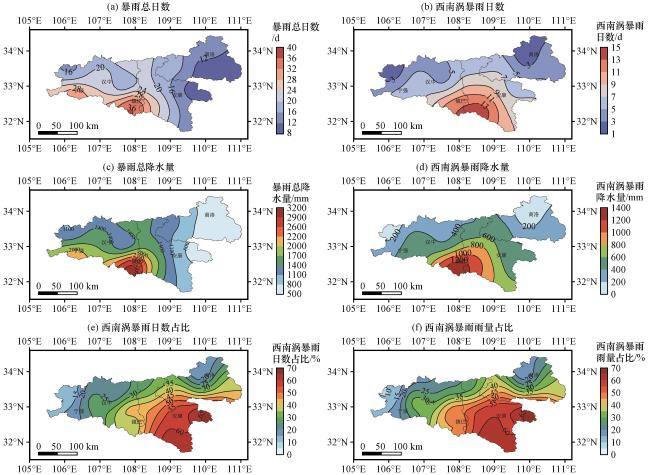
表2 2013 -2022年陕西南部西南涡暴雨Table 2 Southwest vortex rainstorm in southwestern Shaanxi from 2013 to 2022 |
| 序 号 | 发生 日期 | 降水时段 | 其他影响系统 | 暴雨 站数 /个 | 日最大 降雨量 /mm |
|---|---|---|---|---|---|
| 1 | 2013-07-04 | 4日04:00 -18:00 | 500 hPa西风槽、 副高外围西南气流、 西南低空急流 | 8 | 132.8 |
| 2 | 2013-09-08 | 8日02:00 -16:00 | 500 hPa高原槽、 副高外围西南气流、 西南低空急流、 偏东气流 | 9 | 80.6 |
| 3 | 2013-05-25 | 25日07:00 -20:00 | 500 hPa高原槽、 副高外围西南气流、 西南低空急流、 偏东气流 | 5 | 67.1 |
| 4 | 2013-06-24 | 24日05:00 -17:00 | 500 hPa高原槽、 副高外围西南气流、 西南低空急流、 偏东气流、 热带风暴“贝碧嘉” | 5 | 93.2 |
| 5 | 2013-07-18 | 18日03:00 -18:00 | 500 hPa短波槽、 西南低空急流、 副高外围西南气流、 热带风暴“西马仑” | 4 | 91 |
| 2013-07-19 | 19日01:00 -15:00 | 500 hPa西风槽、 西南低空急流、 副高外围西南气流、 热带风暴“西马仑” | 4 | 71.9 | |
| 6 | 2015-05-01 | 1日01:00 -11:00 | 500 hPa西风槽 | 4 | 51.4 |
| 7 | 2016-06-23 | 23日01:00 -18:00 | 500 hPa短波槽、 西南低空急流、 副高外围西南气流、 偏东气流 | 9 | 116.5 |
| 8 | 2017-06-04 | 4日03:00 -17:00 | 500 hPa蒙古冷涡底部西风槽、 副高外围西南气流、 西南低空急流、 偏东急流 | 12 | 89.2 |
| 9 | 2018-06-18 | 17日21:00至18日17:00 | 500 hPa短波槽、 西南低空急流、 副高外围西南气流, 偏东气流 | 15 | 121 |
| 10 | 2019-04-20 | 20日02:00 -11:00 | 500 hPa高原槽、 偏东气流 | 4 | 89.9 |
| 11 | 2019-06-05 | 5日09:00 -17:00 | 500 hPa高原槽、 西南低空急流 | 4 | 68.3 |
| 12 | 2019-06-28 | 27日20:00至28日05:00 | 500 hPa西风槽、 偏东气流 | 4 | 70.9 |
| 13 | 2020-06-17 | 16日21:00至17日17:00 | 500 hPa西风槽、 西南低空急流、 副高外围西南气流, 偏东气流 | 4 | 130.8 |
| 14 | 2021-06-17 | 17日03:00 -12:00 | 500 hPa副高北侧纬向气流、 偏东气流 | 4 | 68.7 |
| 15 | 2021-08-08 | 8日01:00 -12:00 | 500 hPa西风槽、 副高外围西南气流、 西南低空急流, 台风“卢碧” | 10 | 84.2 |
| 16 | 2021-08-22 | 21日20:00至22日17:00 | 副高北侧纬向气流、 西南低空急流、 偏东气流、 台风“奥麦斯” | 14 | 237.9 |
| 17 | 2021-09-04 | 4日04:00 -17:00 | 副高北侧纬向气流、 西南低空大风速带、 偏东气流 | 6 | 123.4 |
| 18 | 2021-09-17 | 17日07:00 -19:00 | 副高北侧纬向气流、 偏东气流、 台风“灿都” | 5 | 79.8 |
| 19 | 2021-09-26 | 26日05:00 -19:00 | 500 hPa短波槽、 西南低空急流、 偏东气流 | 7 | 112.8 |
| 20 | 2022-07-19 | 18日20:00至19日11:00 | 500 hPa高原槽、 西南低空大风速带 | 12 | 96.7 |
| 21 | 2022-10-03 | 3日03:00 -17:00 | 500 hPa短波槽、 西南低空急流 | 14 | 77.6 |
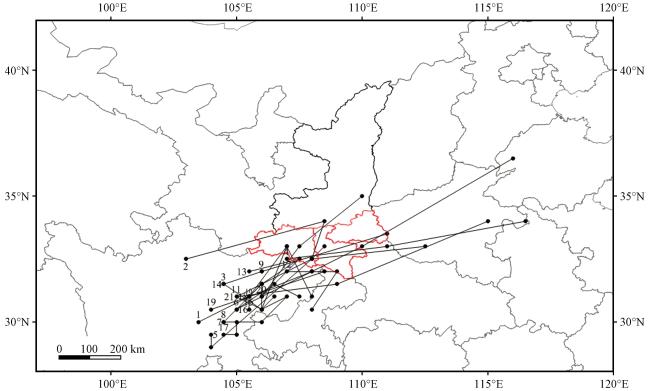
图2 陕南西南涡暴雨活动路径数字表示西南涡发源地, 与表2序号对应, 其中2013年7月18、 19日为同一西南涡涡源; 黑点间隔12 h, 表示移动位置 Fig.2 Rainstorm activity path of southwest vortex in southern Shaanxi.In Fig.2, the number are corresponding to the serial number in Table 2, among them, 18 and 19 July 2013 are the same southwest vortex source.The black dots are spaced 12-hour apart and represent the moving position |
4 陕南西南涡暴雨环流形势
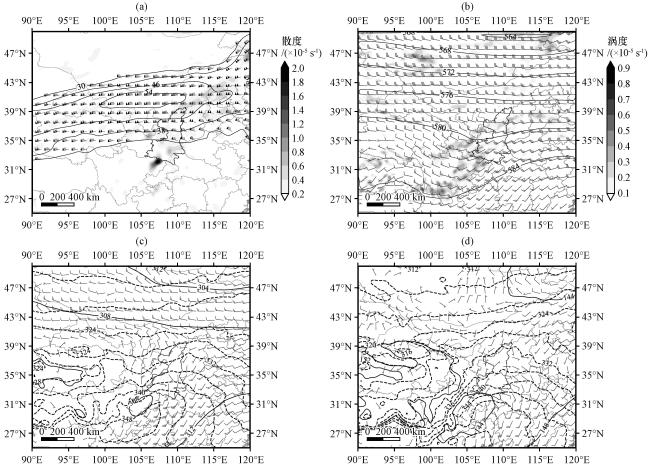
图3 2013 -2022年陕南西南涡暴雨的200 hPa散度(阴影, 单位: ×10-5 s-1)和急流(实线与风羽, 单位: m·s-1)(a) 500 hPa位势高度(实线, 单位: dagpm)、 涡度(阴影, 单位: ×10-5 s-1)和风场(风羽, 单位: m·s-1)(b), 700 hPa (c)、 850 hPa (d)假相当位温(虚线, 单位: K)、 风场(风羽, 单位: m·s-1)和位势高度(实线, 单位: dagpm)Fig.3 200 hPa divergence (the shaded, unit: ×10-5 s-1) and jet (barb and solid line, unit: m·s-1) (a), 500 hPa geopotential height (solid line, unit: dagpm), vorticity (the shaded, unit: ×10-5 s-1) and wind field (barb, unit: m·s-1) (b), 700 hPa (c), 850 hPa (d) pseudo-equivalent potential temperature (dotted line, unit: K) and wind field (barb, unit: m·s-1 ), potential height (solid line, unit: dagpm) |
5 陕南西南涡暴雨的水汽特征
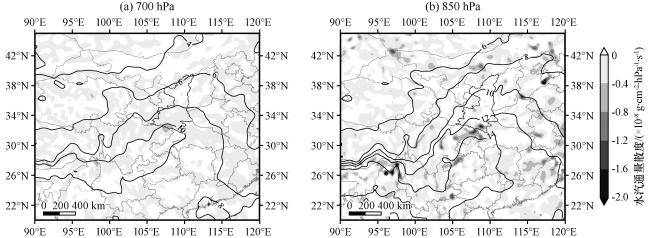
图4 2013 -2022年陕南西南涡暴雨水汽通量散度(阴影, 单位: ×10-8 g·cm-2·hPa-1·s-1)和比湿(实线, 单位: g·kg-1)分布Fig.4 Distribution of 700 hPa (a) and 850 hPa (b) water vapor flux divergence (the shaded, unit: ×10-8 g·cm-2·hPa-1·s-1) and specific humidity (solid line, unit: g·kg-1) of rainstorm in Southwest Shaanxi Vortex from 2013 to 2022 |
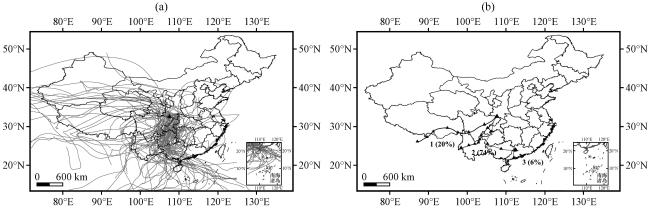
图5 2013 -2022年陕南西南涡暴雨区700 hPa水汽输送后向轨迹(a)和水汽后向轨迹聚类及对应的轨迹数量百分比(b)Fig.5 The backward track of water vapor transport at 700 hPa (a) and the clustering of the backward track of water vapor and the corresponding track number percentage (b) in the southwest vortex rainstorm area of southern Shaanxi from 2013 to 2022 |
6 西南涡的垂直结构特征
6.1 散度场和涡度场特征
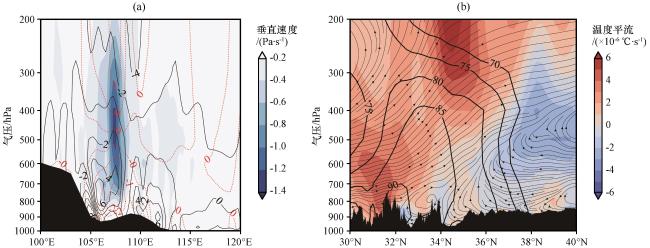
图6 2013 -2022年陕南西南涡暴雨沿33°N的垂直速度(彩色区, 单位: Pa·s-1)、 涡度(实线, 单位: ×10-5 s-1)和散度(虚线, 单位: ×10-5 s-1)(a), 沿108°E的相对湿度(实线, 单位:%)、 温度平流(彩色区, 单位: ×10-6 ℃·s-1)、 流场(流线, ν风场和垂直速度-100ω)的垂直剖面(b)Fig.6 Vertical velocity (color area, unit: Pa·s-1 ), vorticity (solid line, unit: ×10-5 s-1) and vertical cross sections of divergence (dotted line, unit: ×10-5 s-1) along 33°N (a), and relative humidity (solid line, unit:%), temperature advection (color area, unit: × 10-6 ℃·s-1) and flow field (streamline, ν wind field and vertical velocity -100ω) along 108°E (b) during torrential rains caused by Southwest vortex in southern Shaanxi from 2013 to 2022 |
6.2 能量场和锋生场特征
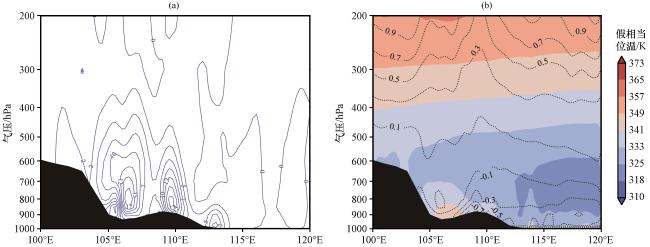
图7 2013 -2022年陕南西南涡暴雨沿33°N锋生函数(单位: ×10-10 K·m-1·s-1)(a)以及湿位涡(虚线, 单位: PVU)和假相当位温(阴影, 单位: K)(b)的垂直剖面Fig.7 Vertical profile of frontogenesis function (unit: ×10-10 K·m-1·s-1) (a), wet potential vortex (dashed line, unit: PVU) and pseudo equivalent potential temperature (the shaded, unit: K) (b) of the south Shaanxi southwest vortex rainstorm along 33° N from 2013 to 2022 |
7 秦巴山区地形在西南涡暴雨中的作用
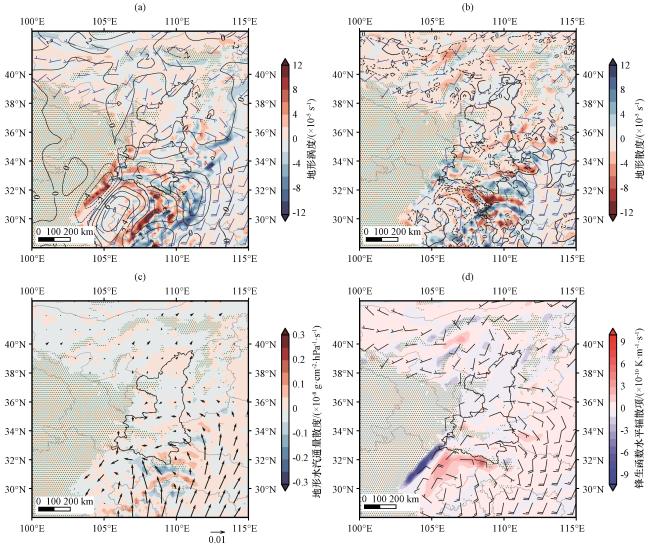


图8 2013 -2022年850 hPa陕南西南涡暴雨涡度(等值线, 单位: ×10-5 s-1)和地形涡度(阴影, 单位: ×10-5 s-1)(a), 散度(等值线, 单位: ×10-5 s-1)和地形散度(阴影, 单位: ×10-5s-1)(b)及风场(风羽, 单位: m·s-1)分布, 地形水汽通量散度(阴影, 单位: ×10-8 g·cm-2 ·hPa-1 ·s-1)和水汽通量(矢量, 单位: kg·m-1·s-1)(c), 锋生函数水平辐散项(单位: ×10-10 K·m-1·s-1)及风场(风羽, 单位: m·s-1)分布(d)绿点为叠加1.5 km以上地形高度分布 Fig.8 850 hPa rainstorm vorticity (contour, unit: ×10-5s-1) and terrain vorticity (the shaded, unit: ×10-5 s-1) (a), divergence contour, unit: ×10-5s-1) and terrain divergence (the shaded, unit: ×10-5 s-1) (b) and the distribution of wind field (barb, unit: m·s-1), the divergence of terrain water vapor flux (the shaded, unit: ×10-8 g·cm-2 ·hPa-1 ·s-1) and water vapor flux (vector, unit: kg·m-1·s-1) (c), the horizontal divergence term of frontogenesis function (unit: ×10-10 K·m-1·s-1) and wind field (barb, unit: m·s-1) distribution (d) of the south Shaanxi southwest vortex rainstorm from 2013 to 2022.The terrain height distribution above 1.5 km superimposed by green points |