Statistical Characteristics of Raindrop Size Distribution in the Mountainous and Plain Areas of the Ili River Valley

  • Yufei JIANG ,
  • Lianmei YANG ,
  • Jiangang LI ,
  • Yong ZENG ,
  • Zepeng TONG ,
  • Jing LIU ,
  • Haoyang LI ,
  • Xiaomeng LI
Expand
  • 1. Institute of Desert Meteorology,China Meteorological Administration,Urumqi 830002,Xinjiang,China
    2. Xinjiang Cloud Precipitation Physics and Cloud Water Resources Development Laboratory,Urumqi 830002,Xinjiang,China
    3. Field Scientific Observation Base of Cloud Precipitation Physics in West Tianshan Mountains,Urumqi 830002,Xinjiang,China

Received date: 2023-11-07

  Revised date: 2024-01-16

  Online published: 2024-01-16

Abstract

Raindrop size distribution (RSD) is fundamental in understanding the precipitation microphysics and quantitative precipitation estimation, especially in complex terrain with complicated rainfall mechanism and high spatial and temporal variability.In this paper, the RSD characteristics of different rainfall rates and rain types in the mountainous and plain areas of the Ili River Valley during the summer of 2020 -2022 are investigated using Parsivel2 disdrometer.The results show that the precipitation in the mountainous and plain areas is mainly composed of small raindrops, and medium raindrops are the largest contribution to the rainfall rate R.Precipitation in the mountainous and plain areas mainly occurs during the late afternoon and early evening, and the concentration of large and medium-sized raindrops is higher in the mountainous areas in all time periods.The spectral width and the concentration of drops with diameters increase with increasing rainfall rate.The number concentration of medium and large particles in the mountainous areas is obviously higher than that in the plain areas during light rain and heavy rain.For the same rainfall rate and rain type, precipitation in the mountainous areas has higher mass-weighted mean diameter (Dm ) and lower normalized intercept parameter (log10 Nw ).In addition, the convective rain spectrum in the mountainous and plain areas of the Ili River Valley tend to be “continental-like convective cluster”.It is found that there are also significant differences in the μ-Λ relationship and Z-R relationship of precipitation between the two areas, and the empirical relationship of Z =300R 1.40 clearly overestimates precipitation.The results reveal the microphysical characteristics of precipitation under different terrain conditions in the Ili River Valley, and provide a reliable factual basis for the subsequent retrieval of precipitation using radar data.

Cite this article

Yufei JIANG , Lianmei YANG , Jiangang LI , Yong ZENG , Zepeng TONG , Jing LIU , Haoyang LI , Xiaomeng LI . Statistical Characteristics of Raindrop Size Distribution in the Mountainous and Plain Areas of the Ili River Valley[J]. Plateau Meteorology, 2024 , 43(5) : 1271 -1285 . DOI: 10.7522/j.issn.1000-0534.2024.00004

1 引言

降水是云中微物理-动力学-热力学过程和许多其他因素综合作用的结果(Bruintjes, 1999)。作为降水最基本的微观物理特征之一, 雨滴谱反映了雨滴数浓度随直径的变化(陈宝君等, 1998)。研究表明, 雨滴谱的空间和时间变化受许多物理因素的影响, 包括碰撞聚并, 破裂, 凝结和蒸发等(Rosenfeld and Ulbrich, 2003Tokay and Short, 1996)。研究雨滴谱的特征及其时空变异性不仅有助于理解降水系统中发生的复杂微物理过程和提高天气雷达定量降水估测的准确性, 对于改善数值天气和气候预测模型中的微物理参数化方案也至关重要(Chakravarty and Raj, 2013刘胜男和王改利, 2020房彬等, 2016)。
大量研究表明, 雨滴谱随气候背景、 地形地貌、 季节、 天气系统和降水类型而变化(Luo et al, 2021Dolan et al, 2018Tang et al, 2014刘彦等, 2023王俊等, 2021)。作为影响降水的主要因素之一, 地形可以通过动力、 热力和云物理等过程对局地降水的形成和发展产生影响(钟水新, 2020廖菲等, 2007)。近年来, 有关不同地形条件下雨滴谱特征的研究也越来越受到国内外学者们的青睐。一些研究也证实了山区降水和平原降水的雨滴谱特征存在显著差异, 山区降水与平原降水相比, 存在雨滴直径偏大、 数浓度偏低的特征(Sumesh et al, 2021Kozu et al, 2006程鹏等, 2021赵城城等, 2021杨俊梅等, 2016)。Harikumar et al(2016)利用激光雨滴谱仪对比了热带地区三个沿海站点和一个山区站点的雨滴谱特征, 清楚地揭示了地形效应对热带降雨微物理的影响。当雨强较大时, 地形降水比非地形降水具有更丰富的大雨滴。Zwiebel et al(2015)利用雨滴谱仪和微雨雷达分析了法国中部从平原到山区不同地形条件下雨滴谱的水平和垂直结构特征, 研究发现地形和降水强度均可以影响降水结构及其相关的微物理和动力过程。随着地形的复杂程度增加, 雨滴的碰并作用越明显。彭旺等(2022)利用在柴达木盆地东北缘收集的不同海拔处的雨滴谱资料, 对比分析了山区和平原区不同降水强度的雨滴谱分布特征, 研究表明地形的抬升对较大雨滴的数浓度有明显的促进作用。李山山等(2020)统计分析了川西高原不同海拔下的雨滴谱特征, 指出强降水中大粒子数浓度随海拔升高明显增大, 中小粒子数浓度则呈减小趋势; 而弱降水中的小雨滴数浓度随海拔升高而增大, 中粒子数浓度反而略有减小。
伊犁河谷位于新疆西北部, 属于典型的温带大陆性气候, 年降水量达400~1000 mm, 素有“西域湿岛”“塞外江南”之美称。伊犁河谷东西长约360 km, 南北最宽约275 km, 北、 东、 南三面环山, 构成向西敞开的“喇叭口”地形。伊犁河谷处于中纬度盛行西风带上, 特殊的喇叭口地形使得来自大西洋的暖湿气流伴随西风通过地形阻塞效应汇聚于此。伊犁河谷由于其独特的地形地貌, 降水分布极其不均, 山区降水量往往大于平原地区(张学文和张家宝, 2006张家宝和邓子风, 1987)。以往针对伊犁河谷流域降水的研究主要集中在环流配置、 多尺度天气系统间的相互作用、 动热力场和水汽输送等方面(杨霞等, 2021郑博华等, 2019刘晶等, 2019), 有关雨滴谱特征的研究主要倾向于单一地区降水的统计分析(Zeng et al, 20202022Jiang et al, 2022江雨霏等, 2023), 对不同地形条件下降水微物理特征的研究还很缺乏。本文利用2020 - 2022年夏季在伊犁河谷流域开展降水观测试验获取的雨滴谱数据, 较为全面地分析不同地形(山区、 平原)的雨滴谱分布特征, 为加深理解伊犁河谷流域复杂地形条件下降水的形成机理提供可靠的理论依据。

2 资料来源与方法介绍

2.1 采样时间与地点

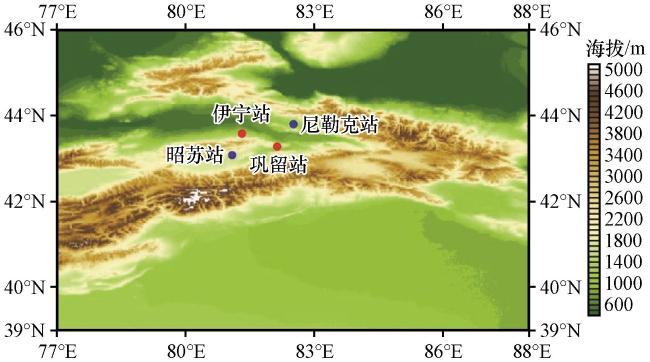
本文的研究区域为中国天山山脉西侧的伊犁河谷, 图1为研究区域的地形及观测站点地理位置分布情况。伊犁河谷流域分布着许多高山峻岭, 山间又有广阔的平原, 海拔的不同及下垫面性质的不同可能会造成降水微物理特征的差异。本研究将布设在伊犁河谷流域的四个观测站点根据海拔分为山区和平原, 将海拔不高于1000 m的观测站点看作是平原站, 将海拔高于1000 m的观测站点看作是山区站, 以此探索干旱区不同地形条件下的雨滴谱分布特征。其中, 山区站选取昭苏站(81.09°E, 43.08°N, 海拔1851 m)和尼勒克站(82.52°E, 43.80°N, 海拔1106.6 m), 平原站选取巩留站(82.14°E, 43.28°N, 海拔774.9 m)和伊宁站(81.32°E, 43.58°N, 海拔770 m)。由于伊犁河谷降雨多发生在夏季(郑博华等, 2019张学文和张家宝, 2006), 本研究将选取2020 -2022年6 -8月为主要观测时段。文中所用时间为地方时。
图1 伊犁河谷地形海拔(彩色驱, 单位: m)及观测站点(圆点)位置分布

Fig.1 The topographic elevation (color area, unit: m) of the Ili River Valley and locations (dots) of observational sites

2.2 观测仪器及数据处理

本研究采用德国OTT公司2011年推出的新一代激光雨滴谱仪Parsivel2。Parsivel2较第一代而言使用了更先进的激光设备, 实现了测量精度的大大提升(Tokay et al, 2014)。在过去的十年里, Parsivel2在世界各地被广泛用于雨滴谱观测研究(Wang et al, 2021Chen et al, 2017Jaffrain and Berne, 2011)。Parsivel2是一种以激光技术为基础的光学测量系统, 采样间隔为60 s, 能够发射出宽30 mm, 长180 mm的激光束, 可同时测量降水粒子的直径和下落速度(LÖffler-Mang and Joss, 2000)。当降水粒子穿过水平激光束时, 以其相应的直径屏蔽部分激光束, 从而降低输出电压。可以通过电压下降的大小来确定粒子直径。粒子的下降速度是根据粒子开始进入激光束到完全离开激光束所经历的时间推导出来的。测得的降水粒子将被细分为32个不等间距的直径档和速度档储存, 粒子直径和下落速度的测量范围分别为0.2~25 mm和0.2~20 m·s-1
Parsivel2在强风、 边缘效应和飞溅效应等条件下会出现一些采样误差。当粒子部分位于激光束内, 它可能会被错误地归类为一个比在该直径下观察到的其他粒子下落速度更快的小粒子, 这种现象称为“边缘效应”(Yuter et al, 2006)。强降雨期间, 雨滴撞击仪器表面溅起的水花可能会被识别为虚假的缓慢下落的大粒子, 这种现象称为“飞溅效应”(Friedrich et al, 2013)。为了最大限度地减少仪器测量误差并提高数据可靠性, 本文将采取如下的质量控制程序: (1)考虑到前两个直径通道数据信噪比低, 将雨滴的最小可探测直径限制在0.312 mm; (2)雨滴总数<10个和降水强度<0.1 mm·h-1的数据被视为噪声剔除; (3)排除雨滴直径大于8 mm或含有冰雹、 雪等固态降水粒子的数据; (4)按照Jaffrain and Berne(2011)提出的方法, 将仪器的有效采样面积定义为180 mm×(30 mm-0.5Di ), 其中Di (单位: mm)是第i个尺度区间的中值; (5)考虑到伊犁河谷流域四个观测站点的实际海拔, 基于式(1)式(2)Atlas et al(1973)提出的D-Vt 经验关系进行空气密度校正, 去除分布在理论阈值±60%之外的粒子。此外, 考虑到发生在研究区域的大多数降雨事件都是间歇性的, 为了避免测量不稳定, 将剔除降水持续时间小于30 min的数据。
D = 1 0.6 × l n 10.3 9.65 - V t / δ   ( h )
δ ( h ) = 1 + 3.68 × 10 - 5 h + 1.71 × 10 - 9 h 2
式中: D为粒子直径; Vt 为下落速度; h为采样地点的海拔; δh)为修正因子。
基于质控后的雨滴谱数据, 可以得到雨滴数浓度的计算公式如下:
N ( D i ) = 1 S e f f ( D i ) t D i j = 1 32 n i j V j
式中: N ( D i )(单位: mm-1·m-3)代表直径介于 D i D i+ D i的雨滴数浓度; D i(单位: mm)和 D i(单位: mm)分别表示第i个尺度区间的中值和间隔; S e f f ( D i )(单位: m2)和 t(单位: s)分别为有效采样面积和采样时间; n i j表示直径位于第i个尺度区间内同时下落速度位于第j个速度区间内的雨滴数; V j(单位: m·s-1)代表第j个速度区间的中心速度。
通过雨滴数浓度 N ( D i )可以计算雨滴总数浓度 N t(单位: m-3)、 降水强度 R(单位: mm·h-1)、 雷达反射率因子 Z(单位: mm6·m-3)及液态水含量 W(单位: g·m-3)。
N t = i = 1 32 N ( D i ) D i
R = 6 π × 10 - 4 i = 1 32 j = 1 32 V j N ( D i ) D i 3 D i
Z = i = 1 32 N ( D i ) D i 6 D i
W = π 6000 ρ w N ( D i ) D i 3 D i
式中: ρ w(单位: g·cm-3)为水的密度。
Ulbrich(1983)提出的三参数Gamma分布模型已经被证明对雨滴谱的拟合效果最好, 公式如下:
N ( D ) = N 0 D μ e x p ( - Λ D )
式中: N 0(单位: mm-1- μ ·m-3)、 μ(无量纲)和   Λ(单位: mm-1)分别为截断参数、 形状参数和斜率参数。式(8)中的三个参数可以利用Vivekanandan et al(2004)提出的阶矩法计算求得, 矩量选择三、 四和六阶矩的组合方式。雨滴谱的第n阶矩定义为:
M n = 0 D n N ( D ) d D = N 0 Γ ( μ + n + 1 ) Λ μ + n + 1
式(10)式(11)式(12)可以计算得出Gamma分布的三参数(μ Λ N 0)。
μ = 11 G - 8 + G ( G + 8 ) 2 ( 1 - G )
Λ = ( μ + 4 ) M 3 M 4
N 0 = Λ μ + 4 M 3 Γ ( μ + 4 )
式中: G = M 4 3 M 3 2 M 6M式(9) Γ为完整的Gamma函数。
考虑到Gamma分布模型的三个参数不是相互独立的, 标准化Gamma分布已被广泛用于分析雨滴谱特征及其与降水积分参数之间的关系(Wang et al, 2021Testud et al, 2001)。
N ( D ) = N w   f   ( μ ) D D m μ e x p   - ( μ + 4 ) D D m
式中: D m(单位: mm)和 N w(单位: mm-1·m-3)分别为质量加权平均直径和标准化截断参数。 D m N w f   ( μ )可表示为:
D m = M 4 M 3
N w = 4 4 π ρ w 10 3 W D m 4
f   ( μ ) = 6 256 × ( μ + 4 ) μ + 4 Γ ( μ + 4 )

2.3 样本概况

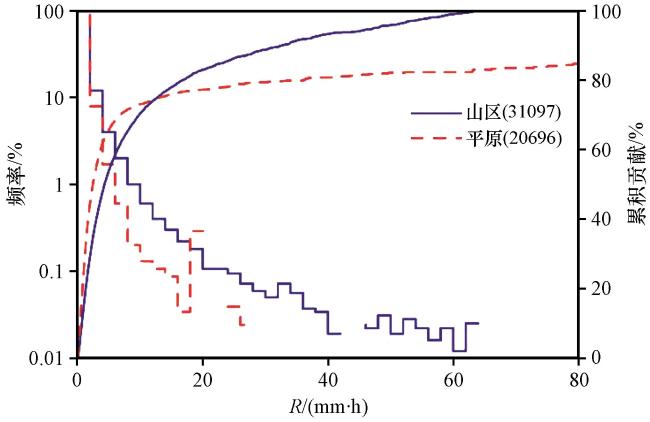
经过质量控制, 山区站共获得31097个降水样本, 平原站共获得20696个降水样本。山区和平原不同雨强降水的频率分布及其对总雨量的累积贡献如图2所示。总体而言, 山区和平原降水发生频率随雨强的增加而减小, 但对总降水量贡献大体呈增加趋势。山区(平原)R<5 mm·h-1的降水发生频率和对总雨量的贡献分别为90%(89%)和53%(78%), 山区(平原)R>10 mm·h-1的降水发生频率和对总雨量的贡献分别为2%(0.5%)和30%(13%)。由此可见, 伊犁河谷山区和平原降水过程多为弱降水, 强降水的发生频率明显低于华东和华南(Zhang et al, 2019Chen et al, 2013)。与平原相比, 山区R>10 mm·h-1的降水发生频率虽然很小, 但其对总降水量的贡献却不容忽视。
图2 不同雨强降水的频率分布(折线)及其对总降水量的累积贡献(曲线)

Fig.2 Frequency distribution of different rainfall rates (fold line) and cumulative contribution to the total rainfall (curve)

3 主要结果

3.1 微物理特征参量

表1显示了山区和平原降水积分参数和雨滴特征直径的平均值, 包括降水强度R, 雷达反射率因子Z, 液态水含量W, 雨滴平均直径 D ¯, 雨滴平均最大直径 D m a x ¯和雨滴总数浓度Nt。在本研究中, 将遵循先前研究人员提出的雨滴直径分类方法将雨滴粗略地分为小雨滴(<1 mm)、 中雨滴(1~3 mm)和大雨滴(>3 mm)三类, 并给出各档雨滴对RNt 的贡献率(Seela et al, 2018Tokay et al, 2014)。其中, 直径<1 mm的雨滴对RNt 的贡献表示为R 1/RN 1/Nt, 直径为1~3 mm的雨滴对RNt 的贡献表示为R 2/RN 2/Nt, 直径 > 3 mm的雨滴对RNt 的贡献表示为R 3/RN 3/Nt。如表1所示, 山区降水的雨强、 雷达反射率因子和液态水含量均较大, 山区降水的平均雨强为1.87 mm·h-1, 约为平原地区的2倍。这主要是由于山区降水的粒子直径和数浓度明显偏大。通过分析各档雨滴对RNt 的贡献率可以看出, 小雨滴在山区和平原降水中占主导地位, 直径 < 1 mm的雨滴数浓度均大于80%。山区的大、 中型雨滴数浓度均大于平原, 这可能是由于山区低层云和雾的播种-供给机制增强了粒子的碰并作用, 使得云中粒子可以多次循环增长(Zwiebel et al, 2015)。此外, 无论是山区还是平原, 对降水强度R贡献最大的主要是中雨滴, 其次是小雨滴。
表1 山区和平原降水微物理参量的平均值及各档雨滴对 R Nt 的贡献率

Table 1 Averaged microphysical parameters of precipitation in the mountainous and plain areas

站名

R

/(mm·h-1

Z

/dBZ

W

/(g·m-3

D ¯

/mm

D m a x ¯

/mm

N t

/m-3

R 1/R

/%

N 1/Nt

/%

R 2/R

/%

N 2/Nt

/%

R 3/R

/%

N 3/Nt

/%

山区 1.87 23.51 0.10 0.75 2.10 208.36 30.68 82.38 56.15 17.41 13.17 0.21
平原 1.06 20.85 0.07 0.72 1.85 198.54 38.85 84.98 55.03 14.94 6.12 0.08

3.2 雨滴谱的日变化

日变化是地球气候系统中由太阳辐射驱动的最基本的变化周期, 而降水的日变化是所有气象变量中变化最显著的。迄今为止, 世界范围内对雨滴谱的日变化进行了大量研究(Seela et al, 2018Chen et al, 2017Kozu et al, 2006)。Kozu et al(2006)研究了亚洲季风区雨滴谱的日变化和季节变化后发现, 西苏门答腊Kototabang雨滴谱的日变化特征最为明显, 这与Kototabang受到地形效应和海陆热力学差异的影响有关。Chen et al(2017)研究了青藏高原夏季雨滴谱的日变化。结果表明, 对流云降水雨滴谱的昼夜差异较大, 而层状云降水则较小。台湾北部夏季和冬季降水雨滴谱也表现出明显的日变化特征(Seela et al, 2018)。
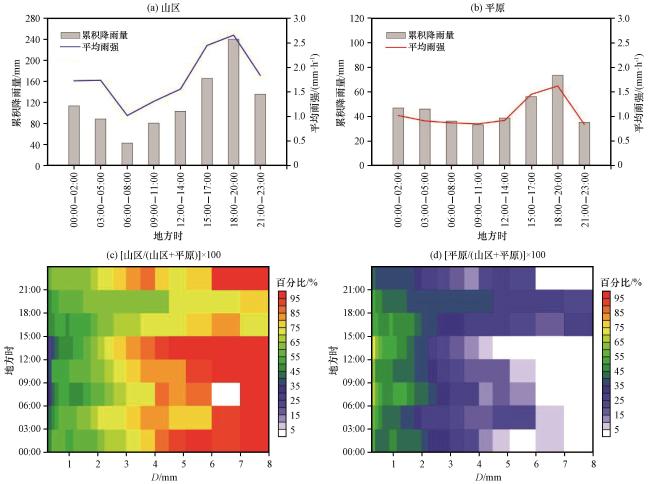
图3(a)和(b)显示了山区和平原累积降雨量和平均雨强的日变化。在2020 -2022年夏季观测期间, 山区和平原累积降雨量分别为970.9 mm和366.1 mm。山区降水和平原降水主要出现在午后至傍晚, 山区降水各个时刻的累积降雨量和平均雨强呈现出“一峰一谷”的特征, 峰值时刻出现在18:00 -20:00, 谷值时刻出现在06:00 -08:00。较平原而言, 山区降水表现出明显的日变化特征, 午后至傍晚的累积降雨量和平均雨强峰值更加突出。为了进一步研究山区和平原雨滴谱的日变化差异, 我们对每3 h间隔(00:00 -02:00、 03:00 -05:00、 06:00 - 08:00、 09:00 -11:00、 12:00 -14:00、 15:00 - 17:00、 18:00 -20:00 和 21:00 -23:00)的雨滴谱分布计算了一个百分比参数δD, T)。δD, T)是指直径为D、 时间间隔为3 h的一个地区(山区或平原)的平均雨滴数浓度与两个地区(山区和平原)的平均雨滴数浓度之和的比值。图3(c)和(d)用百分比参数δD, T)清楚地显示了山区和平原不同直径雨滴数浓度在3 h时间间隔内的变化。从图中可以看到, 在每3 h间隔内, 山区降水以中雨滴和大雨滴为主, 平原降水以小雨滴为主。
图3 累积降雨量(直方图)和平均雨强(折线)(a~b)以及不同直径粒子数浓度百分比参数(c~d, 单位: %)的日变化

Fig.3 Diurnal variations of accumulated rain amount (histogram) and average rainfall rate (fold line) (a~b) and percentage parameter with raindrop diameter (c~d, unit: %)

3.3 不同雨强等级雨滴谱特征

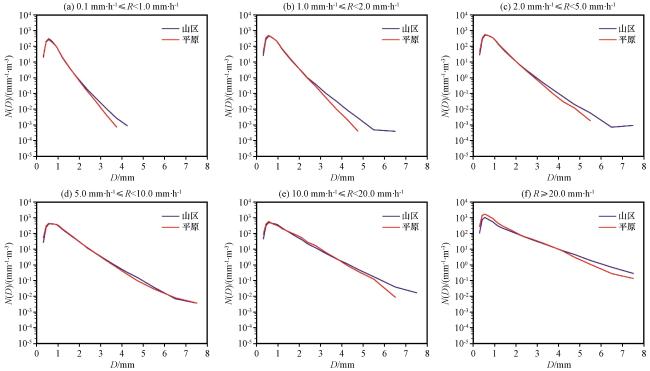
为了进一步了解伊犁河谷流域山区和平原不同降水强度下的雨滴谱特征, 本文依据干旱区地面降水以弱降水为主的客观事实将观测数据按照雨强划分为6类: (a) 0.1 mm·h-1R<1.0 mm·h-1, (b) 1.0 mm·h-1R<2.0 mm·h-1, (c) 2.0 mm·h-1R<5.0 mm·h-1, (d) 5.0 mm·h-1R<10.0 mm·h-1, (e) 10.0 mm·h-1R<20.0 mm·h-1, (f) R≥20.0 mm·h-1表2汇总了山区和平原不同雨强等级雨滴谱的样本数量及统计结果。如表2中所示, 每一类雨强等级的样本数量足够大。其中, 山区降水强度的平均值、 标准差略大于平原。图4给出了不同雨强等级的平均雨滴谱。从图4中可以看出, 6种雨强等级下的雨滴谱形状均呈现出单峰分布, 且峰值位于D=0.5 mm附近, 这与Krishna et al(2016)的研究结果不同, 后者在R>8.0 mm·h-1时雨滴谱形状变为双峰分布。此外, 随着降水强度的增加, 雨滴谱的谱宽和各直径档的雨滴数浓度也随之增加, 而雨滴谱的斜率则减小。当R<5.0 mm·h-1时, 山区大中型雨滴数浓度明显大于平原。当5.0≤R<10.0 mm·h-1时, 两条曲线近乎重叠, 山区和平原各个尺寸下的雨滴数浓度相当。当R>10.0 mm·h-1时, 山区大雨滴数浓度明显偏大。山区和平原不同雨强等级Dm, log10 Nwμ和Λ的平均值和标准差由每一个1 min样本计算得出(表3表4)。可以清楚地看到, 山区和平原Dm 的平均值随着降水强度的增加而单调增加, μ和Λ则呈减小趋势, 表明雨强较大时雨滴谱变得更宽更平, 雨强较小时雨滴谱特性更加多样化。与平原相比, 当R>1.0 mm·h-1时, 山区降水的平均Dm 较高, log10 Nwμ和Λ的数值相对较低。值得注意的是, 当1.0≤R<2.0 mm·h-1时, log10 Nw 值最大, 这与Chen et al(2017)在青藏高原那曲的研究结果相似。
表2 山区和平原不同雨强等级的统计结果

Table 2 Statistical results of different rainfall rate classes in the mountainous and plain areas

雨强等级

/(mm·h-1

山区 平原

样本数

/1 min

平均值/(mm·h-1 标准差/(mm·h-1

样本数

/1 min

平均值/(mm·h-1 标准差/(mm·h-1
0.1≤R<1.0 18520 0.42 0.25 14849 0.39 0.25
1.0≤R<2.0 5749 1.42 0.28 3549 1.40 0.28
2.0≤R<5.0 4690 3.08 0.82 1862 2.95 0.76
5.0≤R<10.0 1273 6.92 1.39 297 6.52 1.27
10.0≤R<20.0 549 13.72 2.78 81 13.57 2.47
R≥20.0 316 36.79 15.76 58 45.91 26.62
合计 31097 1.87 4.51 20696 1.06 3.07
图4 不同雨强等级下不同粒子直径的平均雨滴谱

Fig.4 The average raindrop size distribution for different raindrop diameters at different rainfall rate classes

表3 山区不同雨强等级 Dmlog10 Nw μΛ的平均值和标准差

Table 3 Mean and standard deviation of Dmlog10 Nw μ and Λ for different rainfall rate classes in the mountainous areas

雨强等级/(mm·h-1 Dm /mm log10 Nw /(m-3·mm-1 μ Λ/(mm-1
平均值 标准差 平均值 标准差 平均值 标准差 平均值 标准差
0.1≤R<1.0 1.02 0.32 3.36 0.54 11.66 10.53 18.13 16.64
1.0≤R<2.0 1.30 0.43 3.49 0.56 5.96 6.39 8.91 7.09
2.0≤R<5.0 1.57 0.56 3.43 0.59 4.56 5.68 6.44 4.41
5.0≤R<10.0 2.05 0.71 3.25 0.59 4.06 3.85 4.24 2.15
10.0≤R<20.0 2.46 0.95 3.14 0.67 3.68 3.19 3.42 1.09
R≥20.0 3.37 1.02 2.92 0.57 2.48 2.01 2.03 0.79
合计 1.24 0.58 3.38 0.56 8.99 8.52 13.67 10.95
表4 平原不同雨强等级 Dmlog10 Nw μΛ的平均值和标准差

Table 4 Mean and standard deviation of Dmlog10 Nw μ and Λ for different rainfall rate classes in the plain areas

雨强等级/(mm·h-1 Dm /mm log10 Nw /(m-3·mm-1 μ Λ/(mm-1
平均值 标准差 平均值 标准差 平均值 标准差 平均值 标准差
0.1≤R<1.0 1.02 0.26 3.34 0.49 11.53 9.69 16.94 12.49
1.0≤R<2.0 1.23 0.31 3.57 0.47 6.30 5.41 9.21 6.50
2.0≤R<5.0 1.48 0.43 3.53 0.52 5.45 4.88 7.13 5.00
5.0≤R<10.0 1.96 0.69 3.34 0.58 5.07 3.48 5.11 2.54
10.0≤R<20.0 2.35 0.62 3.26 0.47 4.84 2.80 3.97 1.57
R≥20.0 2.94 0.55 3.28 0.41 2.12 2.00 2.15 0.80
合计 1.12 0.37 3.39 0.50 9.94 9.02 14.47 11.73

3.4 不同降水类型的雨滴谱分布

雨滴谱在两种一般的降水类型(层状云降水和对流云降水)之间具有显著的变化(Bringi et al, 2003)。为了进一步了解伊犁河谷山区和平原不同降水类型的雨滴谱分布特征, 在本研究中, 将采用Bringi et al(2003)提出的基于降水强度平均值和标准差的降水分类标准, 将所有1 min雨滴谱数据划分为层状云降水和对流云降水两类。对于10个连续1 min的雨滴谱数据, R ¯≥0.5 mm·h-1 σ R≤1.5 mm·h-1的样本被归类为层状云降水, R ¯≥5.0 mm·h-1 σ R≥1.5 mm·h-1的样本被归类为对流云降水, 其余则视为混合云降水, 这里不做考虑。山区共有31097个降水样本, 其中层状云样本为16044个(51.6%), 对流云样本为2067个(6.6%); 平原共有20696个降水样本, 其中层状云样本为10053个(48.6%), 对流云样本为355个(1.7%)。
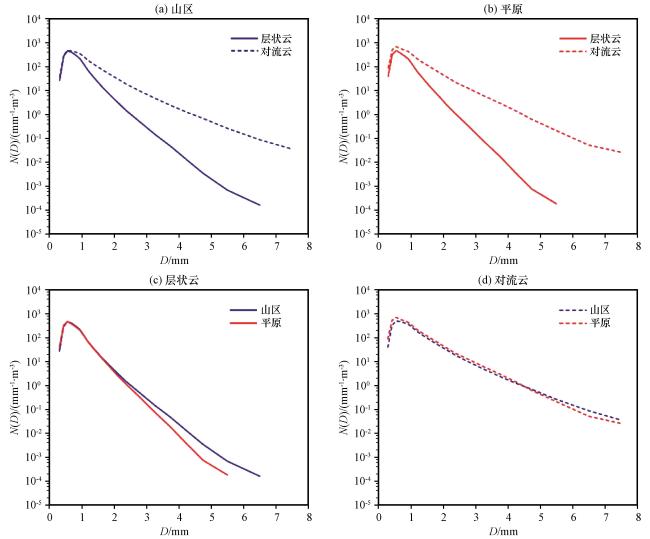
山区和平原对流云和层状云降水的平均雨滴谱如图5所示。无论是山区还是平原, 对流云滴谱和层状云滴谱均表现出明显的单峰结构, 峰值浓度主要出现在D=0.5 mm附近。对流云降水雨滴谱相对于层状云降水而言其主要特征是较小的斜率和较大的谱宽, 随着直径增加对流云降水粒子数浓度远高于层状云降水, 这可能是由于霰粒子、 小冰雹的融化以及活跃的凝结聚并过程的存在。图5(c)和(d)显示了山区和平原降水在特定雨型条件下雨滴谱分布的差异。对于层状云降水, 当D<2 mm时, 山区和平原雨滴数浓度相当, 当D>2 mm时, 二者之间的差异逐渐变大, 山区中大型粒子数浓度明显偏大。对于对流云降水, 山区和平原雨滴谱分布曲线近乎重合。表5给出了山区和平原对流云和层状云降水Dm, log10 Nwμ和Λ的平均值和标准差。无论是层状云降水还是对流云降水, 山区降水的Dm 值大于平原降水, 而log10 Nwμ和Λ值则小于平原降水。
图5 层状云和对流云降水的平均雨滴谱

Fig.5 The average raindrop size distribution for stratiform and convective rain types

表5 层状云和对流云降水 Dmlog10 Nw μΛ的平均值和标准差

Table 5 Mean and standard deviation of Dmlog10 Nw μ and Λ for stratiform and convective rain types

雨型 山区

样本数

/1 min

Dm /mm log10 Nw /(m-3·mm-1 μ Λ/(mm-1
平均值 标准差 平均值 标准差 平均值 标准差 平均值 标准差
层状云 16044 1.23 0.41 3.48 0.53 6.85 7.34 10.61 11.19
对流云 2067 2.30 0.95 3.15 0.64 4.62 4.79 4.59 5.15
雨型 平原

样本数

/1 min

Dm /mm log10 Nw /(m-3·mm-1 μ Λ/(mm-1
平均值 标准差 平均值 标准差 平均值 标准差 平均值 标准差
层状云 10053 1.18 0.32 3.52 0.48 7.63 6.87 11.22 8.93
对流云 355 2.05 0.78 3.31 0.55 4.67 4.08 5.23 4.69
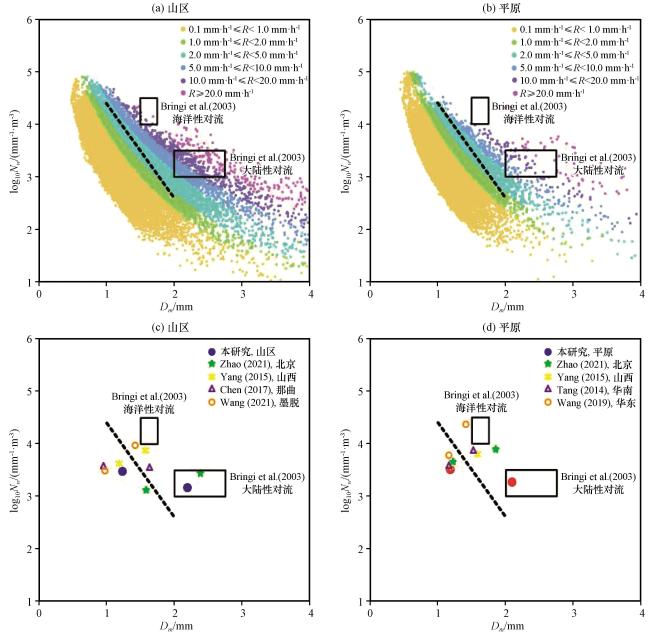
质量加权平均直径Dm 和标准化截断参数log10 Nw 作为两个独立的物理量, 常用来表征雨滴大小和数浓度的变化情况。图6(a)和(b)显示了伊犁河谷流域山区和平原不同雨强等级下log10 Nw -Dm 的散点分布情况。图6中叠加的两个黑色矩形框分别对应于Bringi et al(2003)定义的“海洋性对流簇”和“大陆性对流簇”, 黑色虚线为Bringi et al(2003)定义的“层状云降水分界线”。如图6(a)和(b)所示, 山区降水和平原降水log10 Nw -Dm 的散点分布范围很广, 大多数点集中在Dm 值较小而log10 Nw 值较大的区域。随着雨强增大, 散点分布区域逐渐变得离散并向着图像右下方移动。为了将我们的研究结果与中国其他区域的研究结果进行比较, 图6(c)和(d)及表6还给出了伊犁河谷和中国其他气候背景下山区和平原降水log10 Nw -Dm 的平均值。伊犁河谷山区层状云降水较其他区域而言, Dm 值较大而log10 Nw 值较小, 说明该地区层状云降水主要是由于大雪花的融化而产生的。伊犁河谷平原层状云降水log10 Nw -Dm 的平均值与其他区域相比差别不大。对于对流云降水, 伊犁河谷山区的平均Dm 值和log10 Nw 值分别为2.30 mm和3.15, 粒子浓度最小, 粒子直径明显大于青藏高原但略小于北京山区。伊犁河谷平原对流云降水的平均Dm 值和log10 Nw 值分别为2.05 mm和3.31, 与中国其他平原地区相比, 粒子直径最大, 粒子浓度最小。此外, 伊犁河谷流域山区和平原的对流云滴谱均倾向于雨滴直径较大但雨滴数浓度较低的“大陆性对流簇”。伊犁河谷位于中纬度盛行西风带上, 受中亚低涡(槽)等天气系统的影响, 降水主要以冷雨过程为主, 冰相粒子的融化使得伊犁河谷山区和平原的雨滴直径较大(Bringi et al, 2003Zeng et al, 20202022)。
图6 不同雨强等级的log10 Nw -Dm 散点图(a~b)和本研究及在中国其他地区计算得出的log10 Nw -Dm 平均值(c~d)两个黑色矩形框为 Bringi et al(2003)提出的海洋性和大陆性对流簇, 黑色虚线为Bringi et al(2003)提出的层状云降水分界线

Fig.6 Scatter plot of log10 Nw -Dm for different rainfall rate classes (a~b) and the mean values of log10 Nw -Dm calculated in this study and in other regions of China (c~d).The two black rectangles correspond to the maritime and continental convective clusters and the black dashed line is a separation line between stratiform and convective rain reported by Bringi et al (2003)

表6 本文分析结果与中国其他气候背景下山区和平原雨滴谱的 Dmlog10 Nw 的对比

Table 6 Comparison of Dm and log10 Nw retrieved from this paper and the mountainous and plain areas of other climatic background in China

位置 雨型 平均雨强/(mm·h-1 Dm /mm log10 Nw /(m-3·mm-1
山区(本文) 层状云 1.42 1.23 3.48
对流云 12.39 2.30 3.15
北京山区(赵城城等, 2021) 层状云 - 1.58 3.13
对流云 - 2.38 3.45
山西山区(杨俊梅等, 2016) 层状云 2.02 1.18 3.63
对流云 13.00 1.57 3.88
平原(本文) 层状云 1.24 1.18 3.52
对流云 12.05 2.05 3.31
北京平原(赵城城等, 2021) 层状云 - 1.22 3.66
对流云 - 1.85 3.90
山西平原(杨俊梅等, 2016) 层状云 1.73 1.18 3.56
对流云 10.62 1.58 3.80

-表示无数据(- indicates no data)

3.5  μ关系

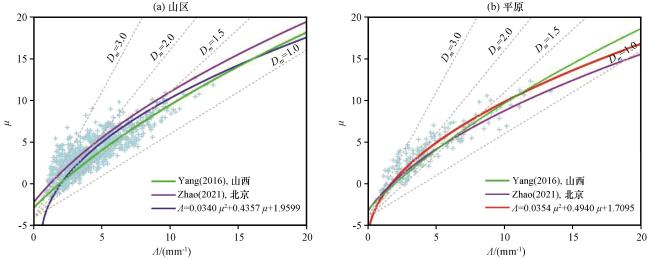
在微物理参数化方案中, 三参数( N 0μ Λ)Gamma分布模型已被广泛用于描述自然降水中雨滴谱的变化。考虑到 N 0μ Λ三个参数之间不是相互独立的, 先前的研究中提出了 N 0-μ关系(Ulbrich, 1983)和μ-Λ关系(Zhang et al, 2003)来反演雨滴谱特征。大量研究表明, μ-Λ关系随降水类型、 地理位置和气候背景的变化而变化(Luo et al, 2021Chen et al, 2017王俊等, 2021)。根据Zhang et al(2003)提出的阈值标准, 本研究将选取R>5 mm·h-1且雨滴数>1000的样本分析伊犁河谷流域山区和平原降水的μ-Λ关系。这种方法可以消除由于测量误差或拟合方法的限制而可能出现的Λ为很大负值的不切实际的数据点。图7为伊犁河谷流域山区和平原μ-Λ散点图及使用最小二乘法拟合的μ-Λ关系。此外, 图中还描绘了中国其他区域拟合的μ-Λ关系。伊犁河谷流域山区和平原的拟合方程分别为:
Λ=0.0340μ 2+0.4357μ+1.9599
Λ=0.0354μ 2+0.4940μ+1.7095
图7 μ-Λ散点图及其拟合曲线 (a) 山区; (b) 平原; 在Dm =1.0, 1.5, 2.0和3.0 mm的情况下, 灰色虚线对应ΛDm =4+μ

Fig.7 The μ-Λ relation scatterplots and fitting curves.(a) mountain areas, (b) plain areas.The gray lines correspond to the relationship ΛDm =4+μ given the values of Dm =1.0, 1.5, 2.0, and 3.0 mm

对于Gamma分布模型, μ-Λ关系还可以近似表示为ΛDm =4+μ, 对于给定的Λ, μ值越大则相应的Dm 值越大(Ulbrich, 1983)。如图7所示, 伊犁河谷流域山区降水的μ-Λ拟合曲线介于赵城城等(2021)杨俊梅等(2016)两条拟合曲线之间, 与赵城城等(2021)在北京山区的观测结果更为接近, 这说明较高的粒子直径可能是伊犁河谷流域山区降水μ值较大的原因。对于平原降水, 本研究的拟合曲线位于北京平原和山西平原两条拟合曲线上方, 也就是Dm 大值区, 说明伊犁河谷流域平原降水的粒子尺度明显偏大。

3.6  Z-R 关系

雷达反射率因子Z和降水强度R之间的幂律关系(Z=a·Rb )是单偏振雷达估算降水量最广泛使用的方法, 它的系数a和指数b随地理位置、 大气条件、 降水类型和仪器类型而变化, 并强烈依赖于雨滴谱的变异性(Seela et al, 2018Rosenfeld and Ulbrich, 2003彭旺等, 2022)。通过建立合适的Z-R关系, 可以最大限度地减少某一地区雷达定量降水估测的不确定性。在Z=a·Rb 关系中, 系数a可以推断出雨滴的大小, 指数b与微物理过程密切相关。如果指数b近似等于1, 则雨滴谱是从稳定或均质降雨条件下的数浓度控制过程演变而来; 如果指数b大于1, 则雨滴谱是由数浓度和雨滴大小协调组合所控制的(Steiner et al, 2004)。
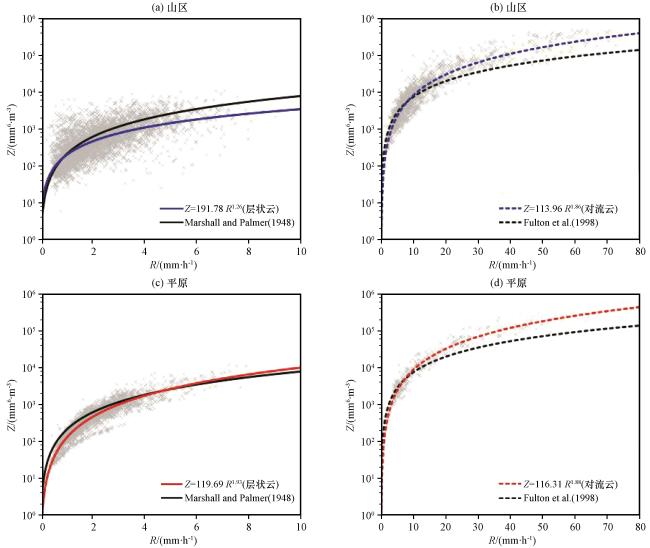
图8为伊犁河谷流域山区和平原层状云和对流云降水的Z-R散点图及使用最小二乘法拟合Z-R关系。如图8所示, 山区和平原对流云降水的Z-R关系相似, 而层状云降水的Z-R关系明显不同。与平原相比, 山区层状云降水的Z-R关系中的系数a较大, 指数b较小, 这可能与山区降水大雨滴含量丰富有关。此外, 无论是山区还是平原, 两种降水类型的Z-R关系中指数b的值均大于1, 说明两地区降水的雨滴谱是由数浓度和雨滴大小协调组合所控制的, 不同于以数浓度控制雨滴谱变异性为特征的热带海洋降水。为便于比较, 图8中还绘制了代表中纬度地区层状云降水的Z-R关系(Z= 200R 1.60Marshall and Palmer, 1948)和代表夏季对流云降水的Z-R关系(Z = 300R 1.40Fulton et al, 1998), Z=300R 1.40也是我国新一代业务天气雷达内置的定量降水估测公式。平原地区层状云降水的拟合曲线与中纬度地区层状云降水的拟合曲线基本重合, 两者对降雨量的估测差别不大, 而对于山区层状云降水, 经典关系可能会有低估。对于对流云降水, 经典Z-R关系位于两地区拟合曲线的下方, 经典Z-R关系对降雨量有明显的高估, 使用默认的天气雷达内置关系可能会增大降水估测的不确定性。
图8 Z-R散点分布及其拟合曲线 (a, b)山区, (c, d)平原

Fig.8 The Z-R relation scatterplots and fitting curves.(a, b) mountain areas, (c, d) plain areas

4 结论

本研究利用2020 -2022年6 -8月布设在伊犁河谷流域四个观测站点的Parsivel2一维激光雨滴谱仪逐分钟数据, 探究了山区和平原不同降水强度和不同降水类型的降水微物理特征及雨滴谱分布的差异。得到以下主要结论:
(1) 伊犁河谷流域山区和平原多为弱降水, 较大的雨滴直径和数浓度使得山区降水的雨强、 雷达反射率因子和液态水含量明显大于平原。无论是山区还是平原, 对雨滴总数浓度Nt 贡献最大的是小雨滴, 对降水强度R贡献最大的是中雨滴。山区降水和平原降水主要出现在午后至傍晚, 在每3 h时间间隔内, 山区降水以中雨滴和大雨滴为主, 平原降水以小雨滴为主。
(2) 将观测数据按照降水强度R划分为6类, 可以看出, 6种雨强等级下的雨滴谱形状相似, 均表现为峰值浓度位于D=0.5 mm附近的单峰分布。随雨强增加, 雨滴谱的谱宽增大, 斜率减小。山区降水的大中型粒子数浓度在小雨和大雨时明显大于平原。山区和平原Dm 值随着降水强度的增加而增加, μ和Λ则呈减小趋势, 当1.0≤R<2.0 mm·h-1时, log10 Nw 值最大。当R>1.0 mm·h-1时, 山区降水的平均Dm 较高, log10 Nwμ和Λ的数值相对较低。
(3) 伊犁河谷流域山区和平原夏季多为层状云降水, 对流云降水频次相对较低。对流云降水雨滴谱表现出较小的斜率和较大的谱宽, 随着直径增加对流云降水粒子数浓度远高于层状云降水。在相同降水类型的情况下, 山区降水具有较大的质量加权平均直径(Dm )和较小的标准化截断参数(log10 Nw )。此外, 两地区对流云滴谱均倾向于“大陆性对流簇”。
(4) 通过分析μ-Λ关系可知, 山区降水的μ-Λ关系与赵城城等(2021)在北京山区的观测结果更为接近, 平原降水的μ-Λ关系则倾向于杨俊梅等(2016)在山西平原拟合的μ-Λ曲线。平原地区层状云降水的Z-R关系与中纬度地区层状云降水的Z-R关系差别不大, 而对于山区层状云降水, 经典关系可能会有低估。对于对流云降水, 使用Z= 300R 1.40的天气雷达内置关系显然高估了山区和平原的降水量。
值得注意的是, 本研究只采用了3年的一维激光雨滴谱仪数据, 存在一定的局限性。未来的工作中将考虑使用多种仪器, 包括二维视频雨滴谱仪、 微雨雷达、 云雷达、 双偏振雷达等, 尽可能全面地揭示伊犁河谷流域降水的三维微物理特征及其演变规律, 以期为提高本地区降水的定量监测及防灾减灾提供可靠的理论依据。

References

null
Atlas D Srivastava R C Sekhon R S1973.Doppler radar characteristics of precipitation at vertical incidence[J].Reviews of Geophysics and Space Physics11(1): 1-35.
null
Bringi V N Chandrasekar V Hubbert J, et al, 2003.Raindrop size distribution in different climatic regimes from disdrometer and dual-polarized radar analysis[J].Journal of the Atmospheric Sciences60(2): 354-365.DOI: 10.1175/1520-0469(2003)060<0354: RSDIDC>2.0.CO; 2 .
null
Bruintjes R T1999.A review of cloud seeding experiments to enhance precipitation and some new prospects[J].Bulletin of the American Meteorological Society80(5): 805-820.DOI: 10.1175/1520-0477(1999)080<0805: AROCSE>2.0.CO; 2 .
null
Chakravarty K Raj P E2013.Raindrop size distributions and their association with characteristics of clouds and precipitation during monsoon and post-monsoon periods over a tropical Indian station[J].Atmospheric Research124(124): 181-189.DOI: 10. 1016/j.atmosres.2013.01.005 .
null
Chen B J Hu Z Q Liu L P, et al, 2017.Raindrop size distribution measurements at 4500 m on the Tibetan Plateau during TIPEX-III[J].Journal of Geophysical Research: Atmospheres122(20): 11092-11106.DOI: 10.1002/2017JD027233 .
null
Chen B J Yang J Pu J P2013.Statistical characteristics of raindrop size distribution in the Meiyu season observed in eastern China[J].Journal of the Meteorological Society of Japan Ser II91(2): 215-227.DOI: 10.2151/jmsj.2013-208 .
null
Dolan B Fuchs B Rutledge S A, et al, 2018.Primary modes of global drop size distributions[J].Journal of the Atmospheric Sciences75(5): 1453-1476.DOI: 10.1175/JAS-D-17-0242.1 .
null
Friedrich K Higgins S Masters F J, et al, 2013.Articulating and stationary PARSIVEL disdrometer measurements in conditions with strong winds and heavy rainfall[J].Journal of Atmospheric and Oceanic Technology30(9): 2063-2080.DOI: 10.1175/JTECH-D-12-00254.1 .
null
Fulton R A Breidenbach J P Seo D J, et al, 1998.The WSR-88D rainfall algorithm[J].Weather and Forecasting13(2): 377-395.DOI: 10.1175/1520-0434(1998)013<0377: TWRA>2.0.CO; 2 .
null
Harikumar R2016.Orographic effect on tropical rain physics in the Asian monsoon region[J].Atmospheric Science Letters17(10): 556-563.DOI: 10.1002/asl.692 .
null
Jaffrain J Berne A2011.Experimental quantification of the sampling uncertainty associated with measurements from Parsivel disdrometers[J].Journal of Hydrometeorology12(3): 352-370.DOI: 10.1175/2010JHM1244.1 .
null
Jiang Y F Yang L M Zeng Y, et al, 2022.Comparison of summer raindrop size distribution characteristics in the western and central Tianshan Mountains of China[J].Meteorological Applications29(3): e2067.DOI: 10.1002/met.2067 .
null
Kozu T Reddy K K Mori S, et al, 2006.Seasonal and diurnal variations of raindrop size distribution in Asian monsoon region[J].Journal of the Meteorological Society of Japan, 84: 195-209.DOI: 10.2151/jmsj.84A.195 .
null
Krishna U V M Reddy K K Seela B K, et al, 2016.Raindrop size distribution of easterly and westerly monsoon precipitation observed over Palau islands in the Western Pacific Ocean[J].Atmospheric Research174-175: 41-51.DOI: 10.1016/j.atmosres. 2016.01.013 .
null
L?ffler-Mang M Joss J2000.An optical disdrometer for measuring size and velocity of hydrometeors[J].Journal of Atmospheric and Oceanic Technology17(2): 130-139.DOI: 10.1175/1520-0426(2000)017<0130: AODFMS>2.0.CO; 2 .
null
Luo L Guo J Chen H N, et al, 2021.Microphysical characteristics of rainfall observed by a 2DVD disdrometer during different seasons in Beijing, China[J].Remote Sensing13(12): 2303.DOI: 10.3390/rs13122303 .
null
Marshall J S Palmer W M1948.The distribution of raindrops with size[J].Journal of Meteorology5(4): 165-166.
null
Rosenfeld D Ulbrich C W2003.Cloud microphysical properties, processes, and rainfall estimation opportunities[J].Radar and Atmospheric Science: A Collection of Essays in Honor of David Atlas, Meteorological Monographs, American Meteor Society, 52: 237-258.
null
Seela B K Janapati J Lin P P, et al, 2018.Raindrop size distribution characteristics of summer and winter season rainfall over North Taiwan[J].Journal of Geophysical Research: Atmospheres123(20): 11602-11624.DOI: 10.1029/2018JD028307 .
null
Steiner M Smith J A Uijlenhoet R2004.A microphysical interpretation of radar reflectivity-rain rate relationships[J].Journal of the Atmospheric Sciences61(10): 1114-1131.DOI: 10.1175/1520-0469(2004)0612.0.CO; 2 .
null
Sumesh R K Resmi E A Unnikrishnan C K, et al, 2021.Signatures of shallow and deep clouds inferred from precipitation microphysics over windward side of Western Ghats[J].Journal of Geophysical Research: Atmospheres126(10): 1-31.DOI: 10.1029/2020JD034312 .
null
Tang Q Xiao H Guo C W, et al, 2014.Characteristics of the raindrop size distributions and their retrieved polarimetric radar parameters in northern and southern China[J].Atmospheric Research, 135-136(135-136): 59-75.DOI: 10.1016/j.atmosres. 2013.08.003 .
null
Testud J Oury S Black R A, et al, 2001.The concept of “normalized” distribution to describe raindrop spectra: a tool for cloud physics and cloud remote sensing[J].Journal of Applied Meteorology, 40: 1118-1140.DOI: 10.1175/1520-0450(2001)040<1118: TCONDT>2.0.CO; 2 .
null
Tokay A Short D A1996.Evidence from tropical raindrop spectra of the origin of rain from stratiform versus convective clouds[J].Journal of Applied Meteorology35(3): 355-371.DOI: 10. 1175/1520-0450(1996)035<0355: EFTRSO>2.0.CO; 2 .
null
Tokay A Wolff D B Petersen W A2014.Evaluation of the new version of the laser-optical disdrometer, OTT Parsivel2 [J].Journal of Atmospheric and Oceanic Technology, 31: 1276-1288.DOI: 10.1175/jtech-d-13-00174.1 .
null
Ulbrich C W1983.Natural variations in the analytical form of the raindrop size distribution[J].Journal of Climate and Applied Meteorology22(10): 1764-1775.DOI: 10.1175/1520-0450(1983)022<1764: NVITAF>2.0.CO; 2 .
null
Vivekanandan J Zhang G F Brandes E2004.Polarimetric radar estimators based on a constrained gamma drop size distribution model[J].Journal of Applied Meteorology43(2): 217-230.
null
Wang G L Zhou R R Zhaxi S L, et al, 2021.Raindrop size distribution measurements on the southeast Tibetan Plateau during the STEP project[J].Atmospheric Research249(249): 1-12.DOI: 10.1016/j.atmosres.2020.105311 .
null
Wen L Zhao K Wang M Y, et al, 2019.Seasonal variations of observed raindrop size distribution in East China[J].Advances in Atmospheric Sciences36(4): 346-362.DOI: 10.1007/s00376-018-8107-5 .
null
Yuter S E Kingsmill D E Nance L B, et al, 2006.Observations of precipitation size and fall speed characteristics within coexisting rain and wet snow[J].Journal of Applied Meteorology and Climatology45(10): 1450-1464.DOI: 10.1175/JAM2406.1 .
null
Zeng Y Tong Z P Jiang Y F, et al, 2022.Microphysical characteristics of seasonal rainfall observed by a Parsivel disdrometer in the Tianshan Mountains, China[J].Atmospheric Research, 280: 106459.DOI: 10.1016/j.atmosres.2022.106459 .
null
Zeng Y Yang L M Zhang Z Y, et al, 2020.Characteristics of clouds and raindrop size distribution in Xinjiang, using cloud radar datasets and a disdrometer[J].Atmosphere11(12): 1382.DOI: 10.3390/atmos11121382 .
null
Zhang A S Hu J J Chen S, et al, 2019.Statistical characteristics of raindrop size distribution in the monsoon season observed in southern China[J].Remote Sensing11(4): 432.DOI: 10.3390/rs11040432 .
null
Zhang G F Vivekanandan J Brandes E A, et al, 2003.The shape-slope relation in observed gamma raindrop size distributions: Statistical error or useful information?[J].Journal of Atmospheric and Oceanic Technology20(8): 1106-1109.DOI: 10.1175/1520-0426 (2003)020<1106: TSRIOG>2.0.CO; 2 .
null
Zwiebel J Van Baelen J Anquetin S, et al, 2015.Impacts of orography and rain intensity on rainfall structure.The case of the HyMeX IOP7a event[J].Quarterly Journal of the Royal Meteorological Society142(): 310-319.DOI: 10.1002/qj.2679 .
null
陈宝君, 李子华, 刘吉成, 等, 1998.三类降水云雨滴谱分布模式[J].气象学报56(4): 506-512.DOI: 10.11676/qxxb1998.046.Chen B J
null
Li Z H Liu J C, et al, 1998.Model of raindrop size distribution in three types of precipitation[J].Acta Meteorologica Sinica56(4): 506-512.DOI: 10.11676/qxxb1998.046 .
null
程鹏, 常祎, 刘琴, 等, 2021.祁连山春季一次层状云降水的雨滴谱分布及地形影响特征[J].大气科学45(6): 1232-1248.DOI: 10.3878/j.issn.1006-9895.2103.20231. Cheng P
null
Chang Y Liu Q, et al, 2021.A case study of raindrop size distribution and orographic impact characteristics in spring stratiform precipitation over the Qilian Mountains[J].Chinese Journal of Atmospheric Sciences45(6): 1232-1248.DOI: 10.3878/j.issn.1006-9895.2103.20231 .
null
房彬, 郭学良, 肖辉, 2016.辽宁地区不同降水云系雨滴谱参数及其特征量研究[J].大气科学40(6): 1154-1164.DOI: 10.3878/j.issn.1006-9895.1512.15244.Fang B
null
Guo X L Xiao H2016.A study on characteristics of spectral parameters and characteristic variables of raindrop size distribution for different cloud systems in Liaoning Province[J].Chinese Journal of Atmospheric Sciences40(6): 1154-1164.DOI: 10.3878/j.issn.1006-9895.1512.15244 .
null
江雨霏, 杨莲梅, 曾勇, 等, 2023.昭苏夏季层状云和对流云降水的雨滴谱特征[J].沙漠与绿洲气象17(3): 8-16.DOI: 10.12057/j.issn.1002-0799.2023.03.002.Jiang Y F
null
Yang L M Zeng Y, et al, 2023.Characteristics of raindrop size distribution for stratiform and convective precipitation in summer in Zhaosu[J].Desert and Oasis Meteorology17(3): 8-16.DOI: 10.12057/j.issn.1002-0799.2023.03.002 .
null
李山山, 王晓芳, 万蓉, 等, 2020.青藏高原东坡不同海拔区域的雨滴谱特征[J].高原气象39(5): 899-911.DOI: 10.7522/j.issn.1000-0534.2019.00086.Li S S
null
Wang X F Wan R, et al, 2020.The characteristics of raindrop spectrum in different altitude region on the eastern slope of Qinghai-Xizang Plateau[J].Plateau Meteorology39(5): 899-911.DOI: 10.7522/j.issn.1000-0534.2019.00086 .
null
廖菲, 洪延超, 郑国光, 2007.地形对降水的影响研究概述[J].气象科技35(3): 309-316.DOI: 10.3969/j.issn.1671-6345.2007.03.001.Liao F
null
Hong Y C Zheng G G2007.Review of orographic influences on surface precipitation[J].Meteorological Sciences and Technology35(3): 309-316.DOI: 10.3969/j.issn.1671-6345.2007.03.001 .
null
刘晶, 周玉淑, 杨莲梅, 等, 2019.伊犁河谷一次极端强降水事件水汽特征分析[J].大气科学43(5): 959-974.DOI: 10.3878/j.issn.1006-9895.1901.18114.Liu J
null
Zhou Y S Yang L M, et al, 2019.A diagnostic study of water vapor during an extreme precipitation event in the Yili River Valley[J].Chinese Journal of Atmospheric Sciences43(5): 959-974.DOI: 10.3878/j.issn.1006-9895.1901.18114 .
null
刘胜男, 王改利, 2020.DSD参数对双频雷达估测降水的影响研究[J].高原气象39(3): 570-580.DOI: 10.7522/j.issn.1000-0534.2019.00092.Liu S N
null
Wang G L2020.Study on the impacts of DSD parameters on precipitation estimation using dual-frequency radar[J].Plateau Meteorology39(3): 570-580.DOI: 10.7522/j.issn.1000-0534.2019.00092 .
null
刘彦, 苏德斌, 杨宁, 等, 2023.基于二维雨滴谱仪的巴彦淖尔地区降雹谱个例分析[J].高原气象42(3): 748-757.DOI: 10.7522/j.issn.1000-0534.2022.00059.Liu Y
null
Su D B Yang N, et al, 2023.Case study of hail size distribution in Bayannur Area based on two-dimensional video disdrometer[J].Plateau Meteorology42(3): 748-757.DOI: 10.7522/j.issn.1000-0534.2022.00059 .
null
彭旺, 李琼, 魏加华, 等, 2022.柴达木盆地东北缘山区和平原区雨滴谱特征对比研究[J].高原气象41(6): 1471-1480.DOI: 10.7522/j.issn.1000-0534.2021.00122.Peng W
null
Li Q Wei J H, et al, 2022.The mountainous and plain areas on the northeastern margin of the Qaidam Basin contrast study on raindrop spectrum characteristics[J].Plateau Meteorology41(6): 1471-1480.DOI: 10.7522/j.issn.1000-0534.2021.00122 .
null
王俊, 王文青, 王洪, 等, 2021.短时强降水和冰雹云降水个例雨滴谱特征分析[J].高原气象40(5): 1071-1086.DOI: 10.7522/j.issn.1000-0534.2020.00091.Wang J
null
Wang W Q Wang H, et al, 2021.Characteristics of the raindrop size distribution during a short-time heavy rainfall and a squall line accompanied by hail[J].Plateau Meteorology40(5): 1071-1086.DOI: 10.7522/j.issn.1000-0534.2020.00091 .
null
杨俊梅, 陈宝君, 韩永翔, 等, 2016.山西省不同地区雨滴谱的统计特征[J].气象科学36(1): 88-95.DOI: 10.3969/2014jms.0107.Yang J M
null
Chen B J Han Y X, et al, 2016.Statistical characteristics of raindrop size distribution in different regions of Shanxi[J].Journal of the Meteorological Sciences36(1): 88-95.DOI: 10.3969/2014jms.0107 .
null
杨霞, 张俊兰, 华烨, 等, 2021.新疆伊犁河谷不同季节降水的日变化特征[J].干旱气象39(3): 394-405.DOI: 10.11755/j.issn.1006-7639(2021)-03-0394.Yang X
null
Zhang J L Hua Y, et al, 2021.Diurnal variation characteristics of precipitation in different seasons in the Yili River Valley of Xinjiang[J].Journal of Arid Meteorology39(3): 394-405.DOI: 10.11755/j.issn.1006-7639(2021)-03-0394 .
null
张家宝, 邓子风, 1987.新疆降水概论[M].北京: 气象出版社.Zhang J B, Deng Z F, 1987.Introduction to Xinjiang’s Precipitation (in Chinese) [M].Beijing: China Meteorological Press.
null
张学文, 张家宝, 2006.新疆气象手册[M].北京: 气象出版社.Zhang X W, Zhang J B, 2006.Xinjiang meteorological manual (in Chinese)[M].Beijing: China Meteorological Press.
null
赵城城, 张乐坚, 梁海河, 等, 2021.北京山区和平原地区夏季雨滴谱特征分析[J].气象47(7): 830-842.DOI: 10.7519/j.issn.1000-0526.2021.07.006.Zhao C C
null
Zhang L J Liang H H, et al, 2021.Microphypical characteristics of the raindrop size distribution between mountain and plain areas over Beijing in summer[J].Meteorological Monthly47(7): 830-842.DOI: 10.7519/j.issn.1000-0526.2021.07.006 .
null
郑博华, 李斌, 黄秋霞, 等, 2019.新疆伊犁河谷冷暖季降水时空分布特征[J].沙漠与绿洲气象13(3): 80-87.DOI: 10.12057/j.issn.1002-0799.2019.03.011.Zheng B H
null
Li B Huang Q X, et al, 2019.Diurnal variation characteristics of precipitation in the cold and warm season of Ili River Valley, Xinjiang[J].Desert and Oasis Meteorology13(3): 80-87.DOI: 10.12057/j.issn.1002-0799.2019.03.011 .
null
钟水新, 2020.地形对降水的影响机理及预报方法研究进展[J].高原气象39(5): 1122-1132.DOI: 10.7522/j.issn.1000-0534.2019.00083.Zhong S X , 2020.Advances in the study of the influencing mechanism and forecast methods for orographic precipitation[J].Plateau Meteorology, 39(5): 1122-1132.DOI: 10.7522/j.issn.1000-0534.2019.00083 .
Outlines

/