1 引言
2 秦岭南北麓和使用数据简介
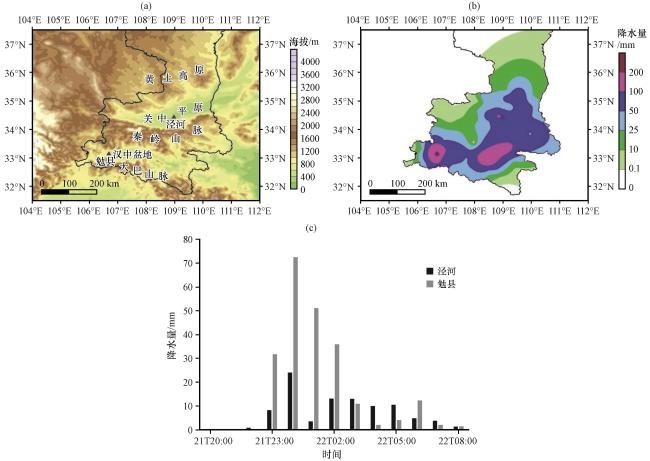
图1 秦岭地形海拔(a, 彩色区, 单位: m; 三角为泾河和勉县位置), 2021年8月21日20:00至22日20:00降水量分布(b, 彩色区, 单位: mm)以及泾河和勉县强降水时段的小时雨量(c, 单位: mm)Fig.1 Topographic altitude of the Qinling Mountains (a, color area, unit: m, the triangles show the locations of Mianxian and Jinghe respectively), the distribution of precipitation from 20:00 on 21 to 20:00 on 22 August 2021(b, colore area, unit: mm) and the hourly rainfall during the periods of heavy precipitation at Jinghe and Mianxian (c, unit: mm) |
3 天气实况和天气形势
3.1 降水量和小时雨强对比分析
3.2 环流形势分析
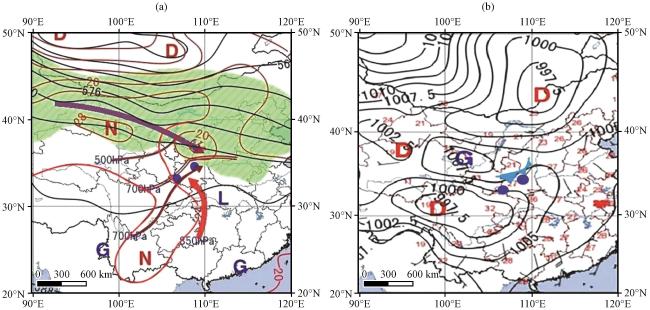
图2 2021年8月21日20:00高空形势配置图(a)和23:00地面形势场(b)(a)中黑色实线为500 hPa等高线(单位: dagpm); 红色实线为850 hPa等温线(单位: ℃); 绿色阴影为200 hPa ≥30 m·s-1的大风速区; 紫色箭头为200 hPa高空急流轴; 棕色粗实线为500 hPa槽线; 棕色双实线为700 hPa切变线; 棕色细箭头为700 hPa低空急流轴; 红色粗箭头为850 hPa低空急流轴; (b)中黑色实线为等压线(单位: hPa); 红色数字为地面2 m气温(单位: ℃); 天蓝色锯齿为锋面图中N、 L、 G、 D分别为暖中心、 冷中心、 高压中心、 低压中心; 蓝色实心圆点分别为泾河和勉县位置 Fig.2 Configuration diagram of the upper layer at 20:00 (a) and surface map at 23:00 (b) on 21 August 2021.(a)The black solid line represents the geopotential height of 500 hPa (unit: dagpm); the red solid line is 850 hPa isotherm (unit: ℃); the green shaded part is the high wind speed area of 200 hPa, where the wind speed ≥30 m·s-1; the purple arrow is the upper air jet axis of 200 hPa; the brown thick solid line is 500 hPa trough line; the brown double solid line is 700 hPa shear line; the brown thin arrow is 700 hPa low-level jet axis; red thick arrow is 850 hPa low-level jet axis.(b) The black solid line is isobaric line (unit: hPa); the red number is 2 m temperature (unit: ℃); the azure sawtooth is the cold front.In Fig.2, N, L, G and D are the warm center, cold center, high pressure center and low pressure center respectively; the blue solid dots show the locations of Jinghe and Mianxian respectively |
4 秦岭山脉南北麓暴雨触发条件对比分析
4.1 触发暴雨的中尺度系统对比分析
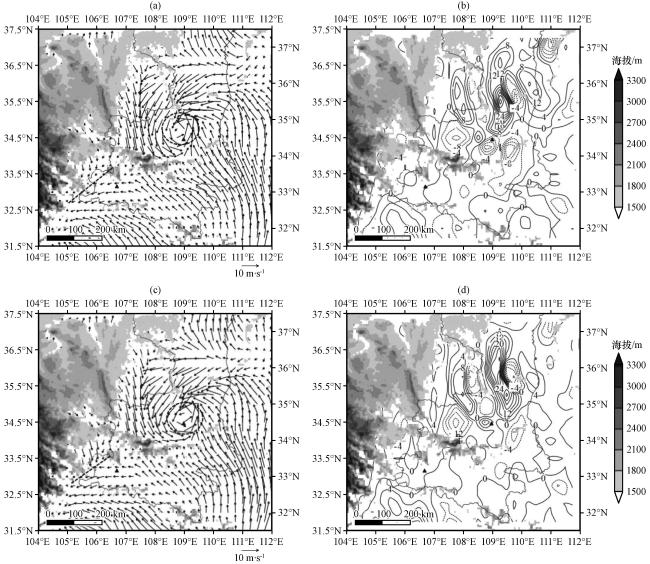
图3 2021年8月21日22:00 (上)与23:00 (下)850 hPa风场(a, c, 矢量, 单位: m·s-1)和温度平流(b, d, 等值线, 单位: ×10-3 ℃·s-1)阴影为海拔(单位: m), 三角分别为勉县和泾河位置 Fig.3 The wind field of 850 hPa(a, c, vector, unit: m·s-1) and the temperature advection of 850 hPa (b, d, contour, unit: ×10-3 ℃·s-1) at 22:00 (top) and 23:00 (bottom) on 21 August 2021.Shaded represents the elevation (unit: m) and the triangles show the locations of Mianxian and Jinghe respectively |
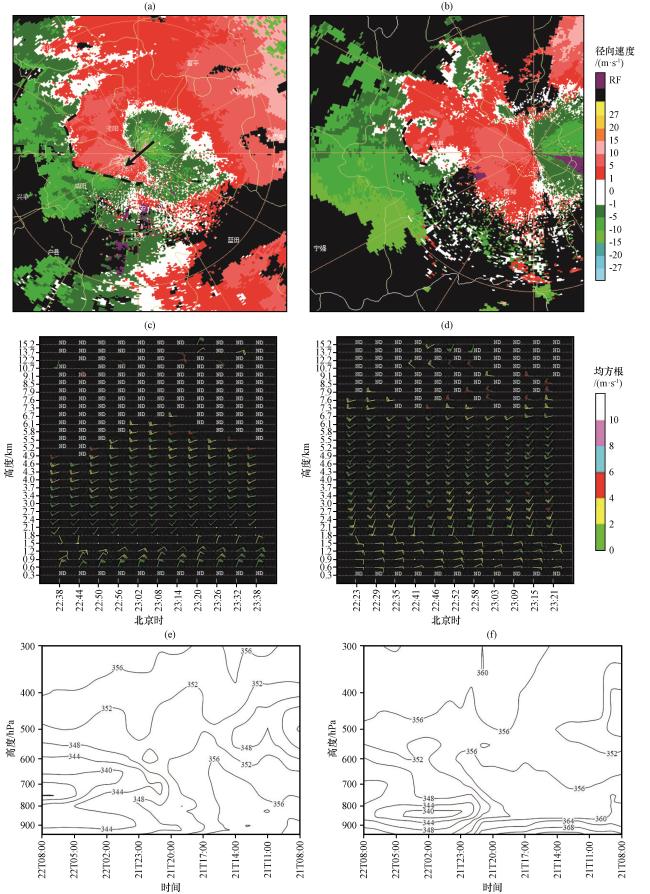
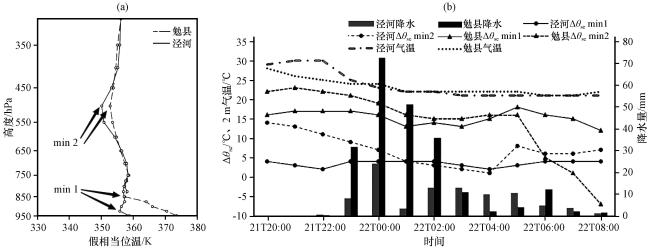
图4 西安(a, c)和汉中(b, d)多普勒雷达的径向速度(a, b, 单位: m·s-1)和风廓线(c, d)资料, 以及泾河(e)与勉县(f)假相当位温随时间的剖面(单位: K)(a~b)中黑色虚线为辐合线位置, 黑色箭头为低空急流, 黑色三角为泾河和勉县位置 Fig.4 Radial velocity (a, b, unit: m·s-1) and wind profile (c, d) data of doppler radars at Xi'an (a, c) and Hanzhong (b, d), and pseudo-equivalent potential temperature profiles at Jinghe (e) and Mianxian (f) (unit: K).The black dotted line (a~b) represents the convergence line, the black arrow represents the low-level rapid, and the black triangles show the locations of the Jinghe and Mianxian respectively |
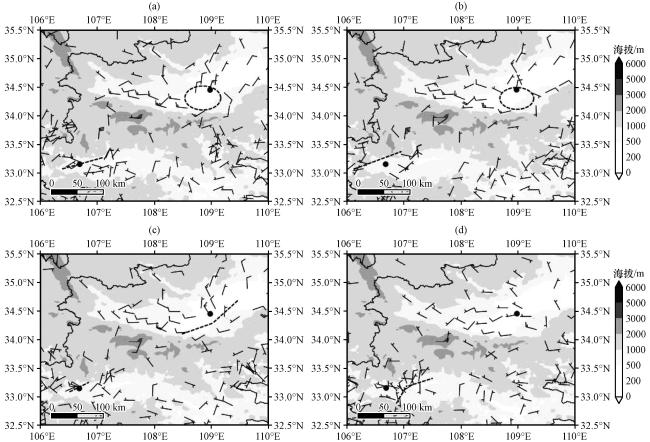
图5 2021年8月21日23:10(a)、 22日00:10(b)、 01:00(c)和03:00(d)地面风场(风羽, 单位: m·s-1)和地形高度(阴影区, 单位: m)黑色虚线椭圆为中尺度气旋性环流; 黑色虚线为地面辐合线, 黑色圆点为泾河和勉县位置 Fig.5 Surface wind field (vector, unit: m·s-1) and topographic height (the shaded, unit: m) at 23:10 (a) on 21 August 2021, 00:10 (b), 01:00 (c) and 03:00 (d) on 22 August 2021.The black dashed ellipse represents the mesoscale cyclonic circulation; the black dashed line represents the ground convergence line, and the black dots show the locations of Jinghe and Mianxian respectively |
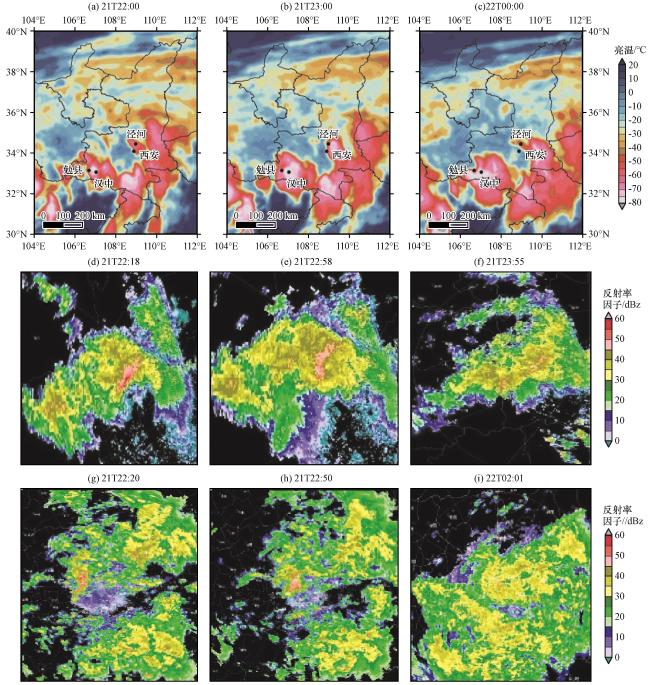
4.2 触发秦岭南北麓暴雨对流云团组织方式对比分析
4.3 触发秦岭南北麓暴雨物理机制对比分析
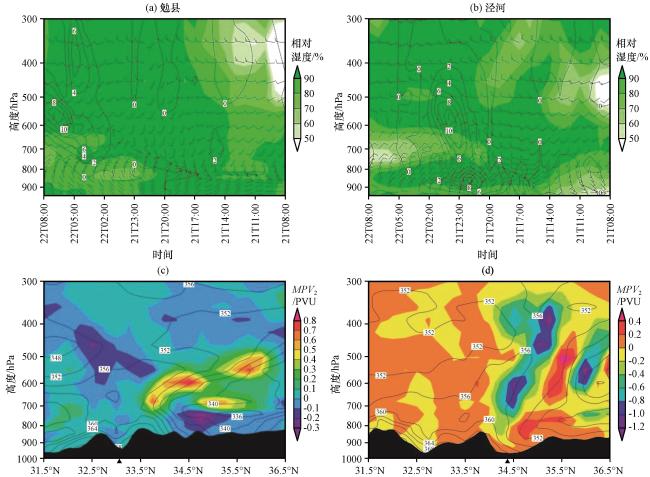
图7 2021年8月21日08:00至22日08:00勉县(a)和泾河(b)相对湿度(绿色阴影, 单位: %)和凝结潜热加热率(等值线, 单位: Kcal·h-1)以及全风速(风羽, 单位: m·s-1)的时间演变图, 以及2021年8月22日00:00, 分别沿106.69°E(c, 黑色三角代表南麓勉县位置)、 108.98°E(d, 黑色三角代表北麓泾河位置, d)的 θ se(等值线, 单位: K)和MPV 2(阴影, 单位: PVU)经度-高度剖面图Fig.7 Temporal evolution of relative humidity (green shaded, unit: %) and condensation latent heat heating rate (contour, unit: Kcal·h-1) and total wind speed (barb, unit: m·s-1) at Mianxian (a) and Jinghe (b).Longitude-height profiles of θ se (isoline, unit: K) and MPV 2 (color pattern, unit: PVU) along 106.69°E (c, black triangle represents the location of Mianxian) and 108.98°E (d, black triangle represents the location of Jinghe) at 00:00 on 22 August 2021 |