
1 引言
2 资料来源和方法介绍
3 2018年浙江梅雨降水实况
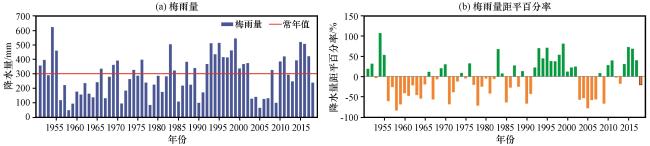
图1 1951 -2018年浙江省历年梅雨量(a, 常年值为1981 -2010年气候平均值, 单位: mm)及其距平百分率(b, 单位: %)的时间序列Fig.1 Time series of yearly Meiyu precipitation (a, the climatological value represents mean value of 1981 -2020, unit: mm) and its anomaly in percentage (b, unit: %) over Zhejiang province from 1951 to 2018 |
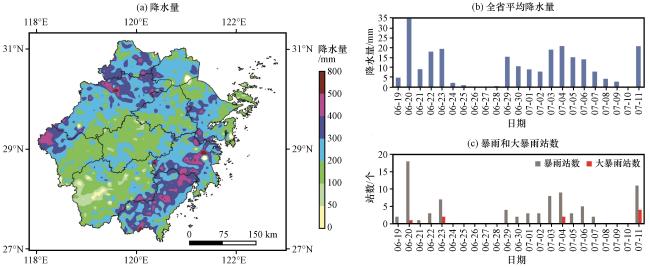
图2 浙江省2018年6月19日至7月11日累积降水量空间分布(a, 单位: mm)与逐日全省平均降水量(b)、 暴雨和大暴雨站数(c)Fig.2 Spatial distribution of total precipitation from June 19 to July 11 of 2018 over Zhejiang province (a, unit: mm) and daily provincial-mean precipitation (b), numbers of rainstorm stations and large rainstorm stations during the same time-span (c) |
4 大尺度环流特征及不同系统相互配置关系
4.1 梅雨同期平均环流特征
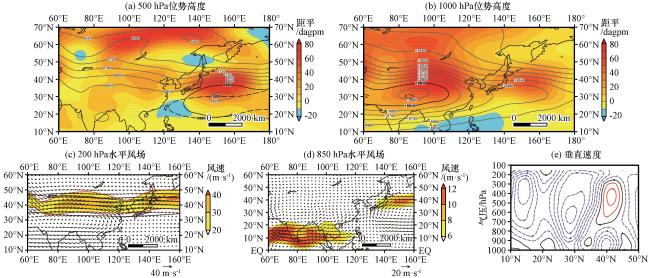
图3 浙江省2018年梅雨期大气环流平均特征(a)、 (b)分别表征500 hPa和100 hPa位势高度(等值线)及其距平(彩色区)(单位: dagpm), 粗实线和粗虚线分别为2018年梅雨期和气候平均西太副高脊线(5880 gpm等值线)及南亚高压脊线(16840 gpm等值线)位置; (c)为200 hPa多年平均(黑色实线)和2018年(红色实线)纬向风速≥20 m·s-1西风急流南北位置及2018年水平风速(矢量, 单位: m·s-1), 彩色区为纬向风速≥20 m·s-1的区域; (d)为2018年850 hPa水平风速(矢量, 单位: m·s-1)及纬向风速≥6 m·s-1的低空急流区域(彩色区); (e)为118°E -123°E纬向平均垂直速度(omega)距平(单位: Pa·s-1) Fig.3 Mean atmospheric circulation characteristics during Meiyu period of 2018 in Zhejiang province.(a) and (b) represent geopotential height (solid lines) and its anomaly (color areas) at 500 hPa and 100 hPa respectively (unit: dagpm); thick solid and dashed lines represent the position of ridge line of western Pacific subtropical High (contour of 5880 gpm) (a) and South Asia High (contour of 16840 gpm) (b) for 2018 and climatological scenario, respectively; (c) denotes the position of westerly jet (u≥20 m·s-1) at 200 hPa for climatology (black solid lines) and 2018 (red solid lines) respectively and horizontal wind speed (vector arrows, unit: m⋅s-1) and the region with u≥20 m⋅s-1 (shaded area, unit: m⋅s-1) in 2018.(d) describes the position of low-level jet at 850 hPa with u≥6 m⋅s-1 (shaded regions) as well as horizontal wind speed (vector arrow, unit: m⋅s-1) in 2018.(e) gives the latitude-height plot of 118°E -123°E zonal-mean vertical wind speed (omega) anomaly (unit: Pa⋅s-1) |
4.2 梅汛期不同阶段环流演变特征
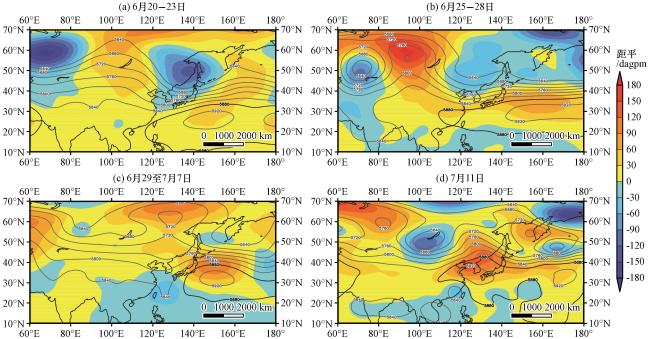
图4 梅汛期不同时段500 hPa位势高度(等值线)及其距平(彩色区)(单位: dagpm)(a)6月20 -23日, (b)6月25 -28日, (c)6月29日至7月7日, (d)7月11日 Fig.4 Geopotential height (solid lines) and its anomaly (color areas) at 500 hPa for different stages of Meiyu period in 2018 over Zhejiang province.Unit: dagpm.(a) June 20 -23, (b) June 25 -28, (c) from June 29 to July 7, (d) July 11 |
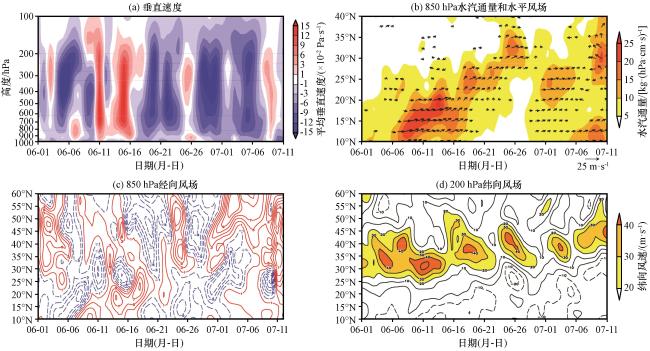
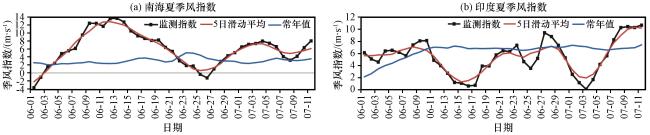
图5 不同环流特征量在浙江区域的逐日演变(a)为(118°E -123°E, 27°N -32°N)区域平均垂直速度(omega, 单位: ×10-2 Pa⋅s-1); (b)为115°E -125°E纬向平均的850 hPa水汽通量[彩色区, 单位: kg⋅(hPa·cm·s)-1]和水平风场(矢量, 单位: m⋅s-1); (c)和(d)分别为118°E -123°E纬向平均的850 hPa经向风速和200 hPa纬向风速(单位: m⋅s-1), (d)中彩色区为≥20 m·s-1的区域 Fig.5 Daily evolution of different circulation factors over Zhejiang province.(a) represents regional-mean of (118°E -123°E, 27°N -32°N) vertical wind speed (omega) (unit: ×10-2 Pa⋅s-1); (b) represents 115°E -125°E zonal-mean water vapor flux at 850 hPa [colored area, unit: kg⋅(hPa·cm·s)-1] and horizontal wind field (vector, unit: m·s-1); (c) and (d) represent 115°E -125°E zonal-mean meridional wind speed at 850 hPa and zonal wind speed at 200 hPa respectively (unit: m⋅s-1), the color area in (d) refers to the area with a latitudinal wind speed of ≥20 m·s-1 |
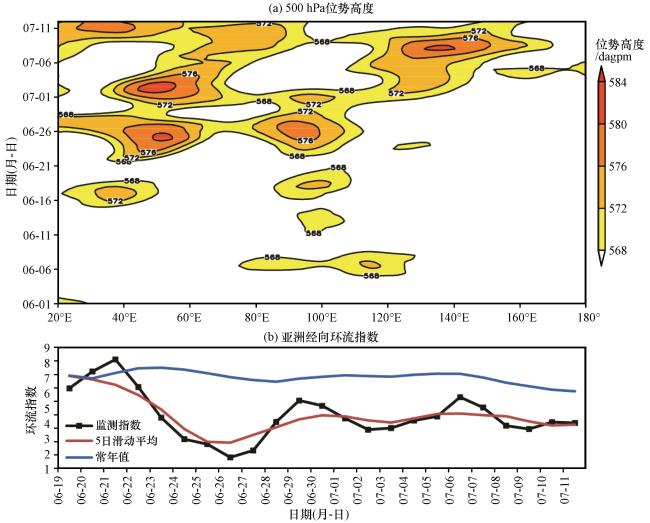
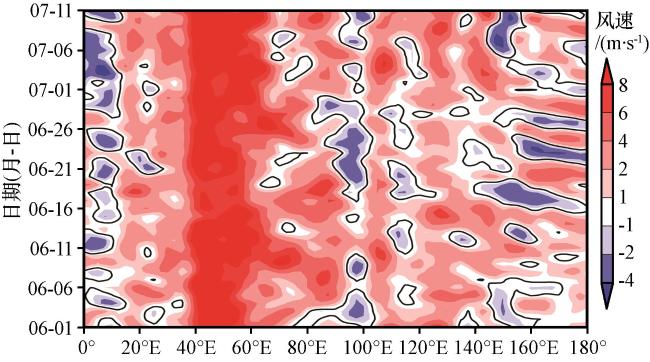
图6 中高纬度环流系统逐日演变(a)为500 hPa 50°N -70°N经向平均位势高度的经度-时间剖面(单位: dagpm); (b)为亚洲经向环流指数逐日演变 Fig.6 Daily evolution of mid-high latitude circulation system: longitude-time plot of 50°N -70°N meridional-mean geopotential height at 500 hPa (a, unit: dagpm) and temporal evolution of Asian meridional circulation index (b) |
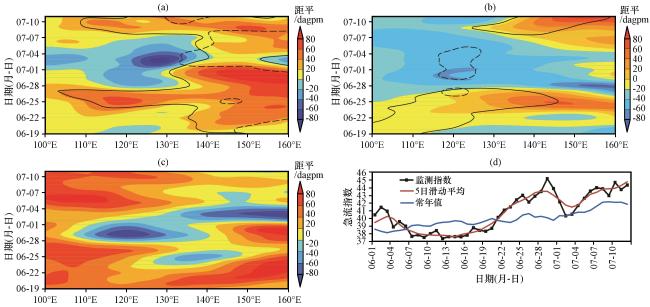
图7 副热带环流系统逐日演变(a)、 (c)分别为28°N -33°N经向平均500 hPa和100 hPa位势高度距平的经度-时间剖面(单位: dagpm); (b)为118°E -123°E纬向平均500 hPa位势高度距平的纬度-时间剖面(单位: dagpm); (d)为东亚副热带西风急流指数的逐日演变。(a)和(b)中粗实线和粗虚线分别为2018年和气候平均的5880 gpm等值线 Fig.7 Daily evolution of subtropical circulation system.(a) and (c) represent longitude-time plot of 28°N -33°N meridional-mean geopotential height anomaly at 500 hPa and 100 hPa respectively (unit: dagpm); (b) represents latitude-time plot of 118°E -123°E zonal-mean geopotential height anomaly at 500 hPa (unit: dagpm); (d) depicts temporal evolution of East Asian subtropical westerly jet index.Thick solid and dashed lines in (a) and (b) represent the position of ridge line of Western Pacific Subtropical High (contour of 5880 gpm) in 2018 and climatological scenario, respectively |
5 影响浙江梅雨的前兆信号及其对2018年梅雨降水的影响
5.1 影响浙江梅雨降水的前兆因子分析
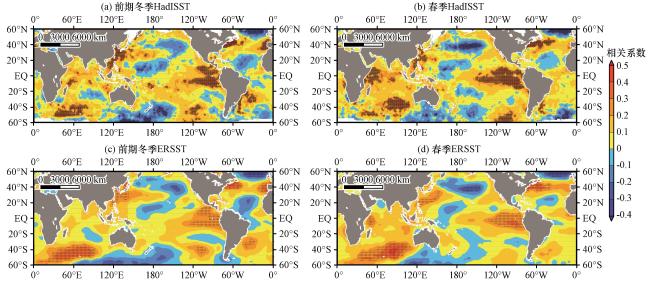
图11 基于HadISST(a, b)和ERSST(c, d)的浙江省逐年梅雨量分别与前期冬季(a, c)和春季(b, d)SST之间相关系数的空间分布打点区域表示达到95%统计显著性水平 Fig.11 Spatial distribution of correlation coefficient between Meiyu precipitation over Zhejiang province with previous winter (a, c) and spring (b, d) global SST based on the HadISST (a, b) and ERSST (c, d) data respectively.Values over the dotted regions have passed the 95% statistical significance level |
表1 海温因子定义方法Table 1 Definition of SST indices |
| 海温因子 | 定义方法 |
|---|---|
| Niño3指数 | (5°S -5°N, 150°W -90°W)范围内, SST距平的区域平均值 |
| Niño3.4指数 | (5°S -5°N, 170°W -120°W)范围内, SST距平的区域平均值 |
| Niño4指数 | (5°S -5°N, 160°E -150°W)范围内, SST距平的区域平均值 |
| IOB指数 | (20°S -20°N, 40°E -110°E)范围内, SST距平的区域平均值 |
| NAT指数 | (0° -60°N, 80°W -0°)范围内, 将去除线性趋势的SST距平EOF分解第一模态作为投影模态, 逐月SST距平去除全球海温增暖影响后对该模态投影所得投影系数的标准化序列 |
| 中国近海SST距平 | (10°N -40°N, 110°E -130°E)范围内, SST距平的区域平均值 |
| 北太平洋中部SST距平 | (30°N -45°N, 180°E -220°E)范围内, SST距平的区域平均值 |
| 西南印度洋SST距平 | (55°S -35°S, 30°E -75°E)范围内, SST距平的区域平均值 |
| 东南印度洋SST距平 | (50°S -30°S, 70°E -110°E)范围内, SST距平的区域平均值 |
表2 不同海温因子与浙江梅雨量之间的相关系数和同号率Table 2 Correlation coefficient and percentage of the same sign between different SST factors and Meiyu-precipitation anomaly over Zhejiang province |
| 相关 系数 | 同号率 /% | 偏多/偏少5成 以上同号率/% | 偏多同号率 /% | 偏少同号率 /% | 偏多5成以上 同号率/% | 偏少5成以上 同号率/% | |
|---|---|---|---|---|---|---|---|
| 前冬Niño3指数 | 0.19 | 58.2 | 62.5 | 45.2 | 69.4 | 77.8 | 53.3 |
| 前冬Niño3.4指数 | 0.12 | 55.2 | 54.2 | 48.4 | 61.1 | 77.8 | 40.0 |
| 前冬Niño4指数 | 0.05 | 59.7 | 54.2 | 51.6 | 66.7 | 77.8 | 40.0 |
| 前冬IOB指数 | 0.14 | 52.2 | 45.8 | 35.5 | 66.7 | 44.4 | 46.7 |
| 前冬NAT指数 | 0.17 | 58.2 | 70.8 | 56.7 | 59.5 | 66.7 | 73.3 |
| 前冬中国近海SST | 0.33 | 64.2 | 66.7 | 50.0 | 75.7 | 66.7 | 66.7 |
| 前冬西南印度洋SST | 0.31 | 64.2 | 70.8 | 40.0 | 86.1 | 83.8 | 80.0 |
| 春季Niño3指数 | 0.27 | 57.4 | 66.7 | 41.9 | 70.3 | 55.6 | 73.3 |
| 春季Niño3.4指数 | 0.20 | 60.3 | 66.7 | 54.7 | 64.9 | 66.7 | 66.7 |
| 春季Niño4指数 | 0.12 | 61.8 | 62.7 | 54.7 | 67.6 | 66.7 | 66.7 |
| 春季IOB指数 | 0.16 | 58.2 | 57.4 | 38.7 | 73.0 | 44.4 | 66.7 |
| 春季NAT指数 | 0.10 | 47.1 | 54.2 | 38.7 | 54.1 | 44.4 | 60.0 |
| 春季东南印度洋SST | 0.37 | 66.2 | 70.8 | 51.6 | 78.4 | 66.7 | 80.0 |
表3 不同海温因子与浙江梅雨量之间的相关系数和异号率Table 3 Correlation coefficient and percentage of opposite sign between different SST factors and Meiyu-precipitation anomaly over Zhejiang province |
| 相关 系数 | 异号率 /% | 偏多/偏少5成 以上异号率/% | 偏多异号率 /% | 偏少异号率 /% | 偏多5成以上 异号率/% | 偏少5成以上 异号率/% | |
|---|---|---|---|---|---|---|---|
| 前冬北太平洋中部SST | -0.11 | 50.7 | 58.3 | 38.7 | 61.1 | 55.6 | 60.0 |
| 春季北太平洋中部SST | -0.26 | 60.3 | 70.8 | 41.9 | 75.7 | 55.6 | 80.0 |
表4 不同时段南半球环状模指数与浙江梅雨量之间的相关系数和同号率Table 4 Correlation coefficient and percentage of the same sign between different Southern Annular Mode indices and Meiyu-precipitation anomaly over Zhejiang province |
| 相关 系数 | 同号率 /% | 偏多/偏少5成 以上同号率/% | 偏多同号率 /% | 偏少同号率 /% | 偏多5成以上 同号率/% | 偏少5成以上 同号率/% | |
|---|---|---|---|---|---|---|---|
| 3月SAM指数 | -0.03 | 54.4 | 58.3 | 48.4 | 59.5 | 55.6 | 60.0 |
| 4月SAM指数 | 0.22 | 57.4 | 54.2 | 51.6 | 62.2 | 66.7 | 46.7 |
| 5月SAM指数 | 0.27 | 60.3 | 58.3 | 45.2 | 73.0 | 33.3 | 73.3 |
| 3 -4月SAM指数 | 0.12 | 61.8 | 58.3 | 54.8 | 67.6 | 66.7 | 53.3 |
| 4 -5月SAM指数 | 0.28 | 67.6 | 70.8 | 58.1 | 75.7 | 66.7 | 73.3 |
| 3 -5月SAM指数 | 0.20 | 66.2 | 66.7 | 58.1 | 73.0 | 66.7 | 66.7 |
表5 不同时段北极涛动指数与浙江梅雨量之间的相关系数和异号率Table 5 Correlation coefficient and percentage of opposite sign between different Arctic Oscillation indices and Meiyu-precipitation anomaly over Zhejiang province |
| 相关 系数 | 异号率 /% | 偏多/偏少5成 以上异号率/% | 偏多异号率 /% | 偏少异号率 /% | 偏多5成以上 异号率/% | 偏少5成以上 异号率/% | |
|---|---|---|---|---|---|---|---|
| 3月AO指数 | -0.07 | 55.9 | 58.3 | 58.1 | 54.1 | 55.6 | 60.0 |
| 4月AO指数 | -0.12 | 48.5 | 33.3 | 41.9 | 54.1 | 22.2 | 40.0 |
| 5月AO指数 | -0.23 | 54.4 | 62.5 | 41.9 | 64.9 | 44.4 | 73.3 |
| 3 -4月AO指数 | -0.12 | 51.5 | 41.7 | 58.1 | 45.9 | 33.3 | 46.7 |
| 4 -5月AO指数 | -0.21 | 54.4 | 45.8 | 48.4 | 59.5 | 33.3 | 53.3 |
| 3 -5月AO指数 | -0.18 | 55.9 | 50.0 | 51.6 | 59.5 | 22.2 | 66.7 |
5.2 基于多因子的统计模型建立及其回报性能检验
5.2.1 多元线性回归模型
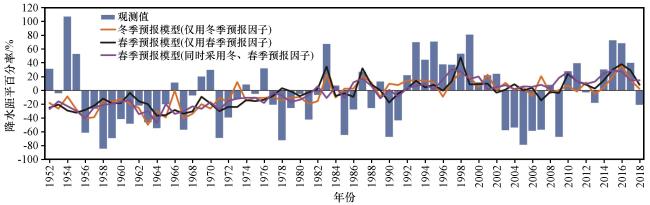
表6 多元线性回归模型对浙江梅雨降水距平的回报能力分析Table 6 Hindcast ability of multivariable linear regression model for Meiyu-precipitation anomaly over Zhejiang province |
| 冬季预报模型 (仅用冬季预报因子) | 春季预报模型 (仅用春季预报因子) | 春季预报模型 (同时采用冬、 春季预报因子) | |
|---|---|---|---|
| 预报因子 | Niño3指数、 NAT指数、 中国近海SST距平、 西南印度洋SST距平 | Niño3指数、 4 -5月SAM指数、 北太平洋中部SST距平、 东南印度洋SST距平 | 冬季中国近海SST距平、 冬季西南印度洋SST距平、 春季东南印度洋SST距平、 4 -5月SAM指数 |
| 相关系数 | 0.40 | 0.41 | 0.41 |
| 同号率/% | 62.2 | 70.6 | 65.7 |
| 偏多/偏少5成以上同号率/% | 62.5 | 75.0 | 62.5 |
| 偏多同号率/% | 58.1 | 64.5 | 61.3 |
| 偏少同号率/% | 66.7 | 75.7 | 69.4 |
| 偏多5成以上同号率/% | 77.8 | 77.8 | 77.8 |
| 偏少5成以上同号率/% | 53.3 | 73.3 | 53.3 |
5.2.2 多因子综合判别模型
表7 多因子综合判别模型对浙江梅雨距平符号的回报能力分析Table 7 Hindcast ability of multi-factor composite assess model for the sign of Meiyu-precipitation anomaly over Zhejiang province |
| 年份 | 冬季预报模型 (仅考虑冬季因子) | 春季预报模型 (仅考虑春季因子) | 春季预报模型 (同时考虑冬、 春季因子) | 年份 | 冬季预报模型 (仅考虑冬季因子) | 春季预报模型 (仅考虑春季因子) | 春季预报模型 (同时考虑冬、 春季因子) |
|---|---|---|---|---|---|---|---|
| 1952 | 异号 | 异号 | 异号 | 1987 | 同号 | 同号 | 同号 |
| 1953 | 同号 | 异号 | 同号 | 1988 | 无法判断 | 异号 | 异号 |
| 1954 | 无法判断 | 异号 | 异号 | 1989 | 异号 | 异号 | 异号 |
| 1955 | 异号 | 异号 | 异号 | 1990 | 无法判断 | 同号 | 同号 |
| 1956 | 同号 | 同号 | 同号 | 1991 | 无法判断 | 同号 | 同号 |
| 1957 | 同号 | 同号 | 同号 | 1992 | 同号 | 异号 | 异号 |
| 1958 | 同号 | 异号 | 同号 | 1993 | 同号 | 同号 | 同号 |
| 1959 | 同号 | 同号 | 同号 | 1994 | 异号 | 同号 | 同号 |
| 1960 | 同号 | 同号 | 同号 | 1995 | 同号 | 异号 | 异号 |
| 1961 | 同号 | 同号 | 同号 | 1996 | 异号 | 异号 | 异号 |
| 1962 | 同号 | 同号 | 同号 | 1997 | 异号 | 同号 | 同号 |
| 1963 | 同号 | 同号 | 同号 | 1998 | 同号 | 同号 | 同号 |
| 1964 | 同号 | 同号 | 同号 | 1999 | 同号 | 同号 | 同号 |
| 1965 | 同号 | 同号 | 同号 | 2000 | 同号 | 异号 | 异号 |
| 1966 | 异号 | 异号 | 异号 | 2001 | 同号 | 同号 | 同号 |
| 1967 | 同号 | 同号 | 同号 | 2002 | 无法判断 | 异号 | 异号 |
| 1968 | 同号 | 同号 | 同号 | 2003 | 异号 | 同号 | 异号 |
| 1969 | 异号 | 同号 | 异号 | 2004 | 无法判断 | 异号 | 异号 |
| 1970 | 异号 | 异号 | 异号 | 2005 | 异号 | 同号 | 同号 |
| 1971 | 同号 | 同号 | 同号 | 2006 | 同号 | 同号 | 同号 |
| 1972 | 同号 | 同号 | 同号 | 2007 | 异号 | 同号 | 同号 |
| 1973 | 无法判断 | 同号 | 同号 | 2008 | 异号 | 异号 | 异号 |
| 1974 | 异号 | 异号 | 异号 | 2009 | 无法判断 | 同号 | 同号 |
| 1975 | 同号 | 同号 | 同号 | 2010 | 同号 | 同号 | 同号 |
| 1976 | 异号 | 异号 | 异号 | 2011 | 无法判断 | 异号 | 同号 |
| 1977 | 无法判断 | 同号 | 同号 | 2012 | 异号 | 同号 | 异号 |
| 1978 | 同号 | 同号 | 同号 | 2013 | 同号 | 同号 | 同号 |
| 1979 | 同号 | 异号 | 异号 | 2014 | 无法判断 | 同号 | 同号 |
| 1980 | 同号 | 异号 | 同号 | 2015 | 同号 | 同号 | 同号 |
| 1981 | 同号 | 异号 | 同号 | 2016 | 同号 | 同号 | 同号 |
| 1982 | 无法判断 | 同号 | 同号 | 2017 | 无法判断 | 同号 | 同号 |
| 1983 | 同号 | 同号 | 同号 | 2018 | 无法判断 | 同号 | 同号 |
| 1984 | 无法判断 | 异号 | 异号 | 同号率 | 35/51=57.8% | 43/67=64.2% | 46/67=68.7% |
| 1985 | 同号 | 异号 | 同号 | 异号年份统计 | 实况偏多12年、 偏少4年 | 实况偏多16年、 偏少8年 | 实况偏多16年、 偏少5年 |
| 1986 | 无法判断 | 同号 | 同号 |
5.2.3 联合诊断模型
表8 联合诊断模型对浙江梅雨距平符号的回报能力分析Table 8 Hindcast ability of combined diagnostic model for the sign of Meiyu-precipitation anomaly over Zhejiang province |
| 冬季联合诊断 | 春季联合诊断 | 冬、 春季联合诊断 | |
|---|---|---|---|
| 同号率 | 36/51=70.6% | 38/52=73.1% | 34/46=73.9% |
| 异号年份统计 | 实况偏多11年、 偏少4年 | 实况偏多10年、 偏少4年 | 实况偏多8年、 偏少4年 |