

1 引言
2 资料来源与方法介绍
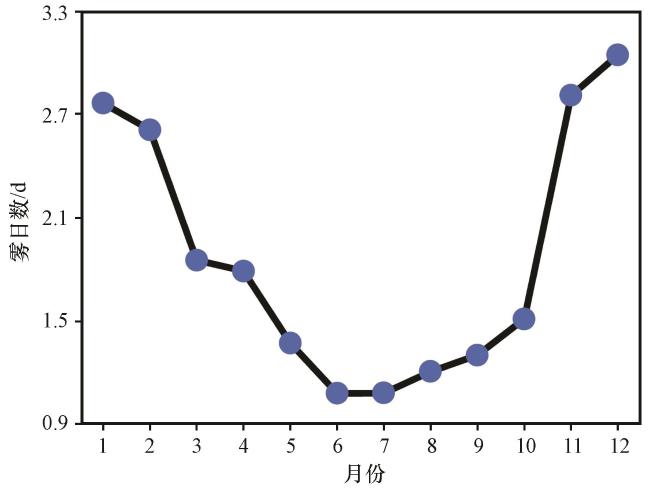
3 中国东部冬季雾日空间分布特征及变化特点
3.1 中国东部冬季雾日的空间分布特征
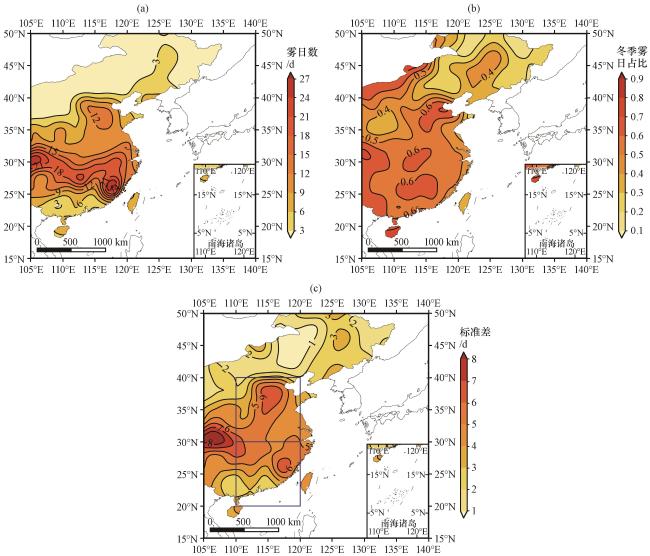
3.2 中国东部冬季雾日的变化特点
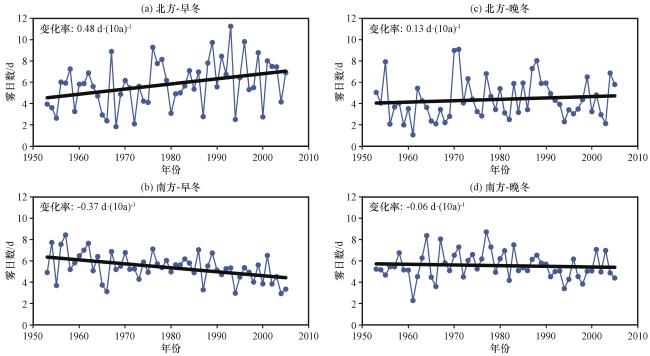
图3 1954 -2006年中国东部北方(a, c)及南方(b, d)地区分别在早冬(左列)及晚冬(右列)区域平均雾日数的线性变化趋势其中蓝点折线为逐年数据, 黑线为线性变化趋势线 Fig.3 The linear trend of regional mean fog days in early winter (left panel) and late winter (right panel) during 1954 -2006 over the northern (a, c) and southern (b, d) regions of Eastern China.Blue dots and line represent year-by-year data, black line represents linear trend |
4 不同区域海温对中国东部冬季雾日的影响
4.1 南北方冬季雾日与海温关系
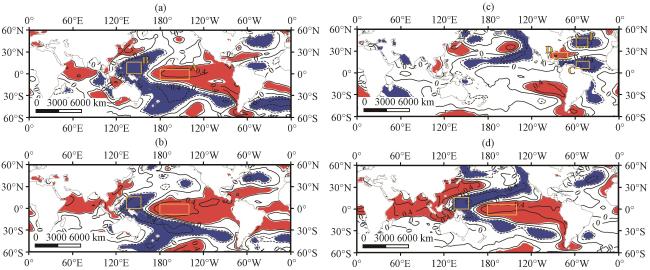
图4 早冬(a, b)及晚冬(c, d)时北方(上)及南方(下)区域平均雾日数与同期海表温度的相关系数(等值线)填充区域表示相关系数通过置信度为95%的t检验, 红、 蓝色分别表示正、 负相关; A为赤道中部太平洋区域(8°S -6°N, 180° -140°W); B为北太平洋副热带偏西区域(0° -16°N, 134°E -154°E); C为北大西洋靠近热带区域(6°N -16°N, 58°W -30°W); D为北大西洋副热带偏西区域(20°N -28°N, 90°W -70°W); E为北大西洋中高纬度区域(36°N -48°N, 58°W -42°W) Fig.4 Correlation coefficients (contour) between regional mean fog days and SST at the same time over northern (top) and southern (bottom) regions of Eastern China in early winter (a, b) and late winter (c, d).Shading area represents the values above the 95% confidence level, red and blue areas indicate positive and negative correlation, respectively; A is the central equator Pacific region (8°S -6°N, 180° -140°W); B is the western subtropical region of the North Pacific (0° -16°N, 134°E -154°E); C is the North Atlantic near tropical regions (6°N -16°N, 58°W -30°W); D is the western subtropical region of the North Atlantic (20°N -28°N, 90°W -70°W); E is the mid to high latitude region of the North Atlantic (36°N -48°N, 58°W -42°W) |
表1 南北方在早冬及晚冬时区域平均雾日数与同期海表温度的相关系数Table 1 Correlation coefficient between regional mean fog days of northern and southern China and SST at the same time in the early winter and late winter |
| 地区-时间 | A | B | (A-B)/2 | C | D | E | (D-C-E)/3 |
|---|---|---|---|---|---|---|---|
| 南方-早冬 | 0.46** | -0.43** | 0.44** | 0.06 | 0.21 | -0.28* | 0.14 |
| 北方-早冬 | 0.40** | -0.52** | 0.46** | -0.26 | 0.19 | -0.29* | 0.25 |
| 南方-晚冬 | 0.41** | -0.49** | 0.45** | -0.07 | 0.03 | -0.26 | 0.12 |
| 北方-晚冬 | 0.04 | -0.17 | 0.11 | -0.49** | 0.32* | -0.42** | 0.41** |
*表示通过置信度为95%的t检验; **表示通过置信度为99.5%的t检验; (A-B)/2表示相关系数绝对值在太平洋的平均; (D-C-E)/3表示相关系数绝对值在北大西洋的平均(* indicates passing the t-test with a confidence level of 95%; ** indicates passing the t-test with a confidence level of 99.5%; (A-B)/2 represents the average absolute value of the correlation coefficient in the Pacific Ocean; (D-C-E)/3 represents the average absolute value of the correlation coefficient in the North Atlantic) |
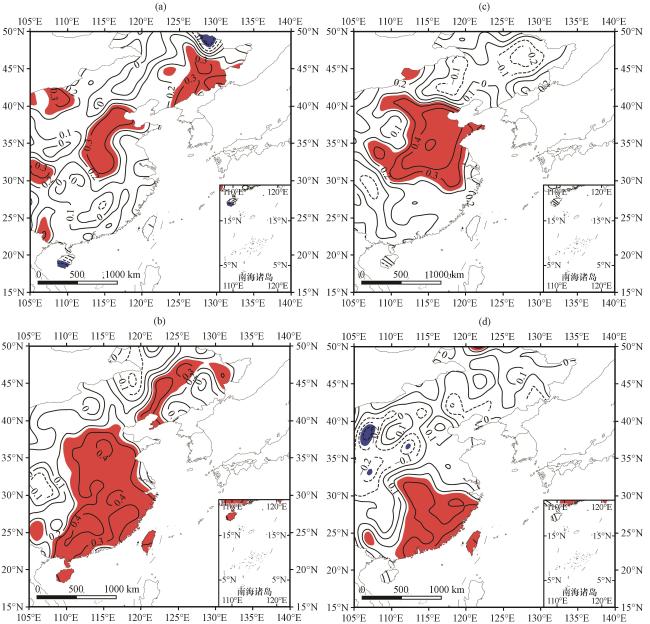
图5 早冬(a, b)及晚冬(c, d)时北大西洋海温指数(上)及热带太平洋海温指数(下)与同期中国东部雾日数的偏相关系数(等值线)填充区域表示相关系数通过置信度为95%的t检验, 红、 蓝色分别表示正、 负相关 Fig.5 Partial correlation (contour) between North Atlantic SST Index(top), Tropical Pacific SST Index(bottom) and fog days of Eastern China in early winter(a, b), late winter(c, d).Shading area represents the values above the 95% confidence level, red and blue areas indicate positive and negative correlation, respectively |
4.2 热带太平洋海温指数与北大西洋海温指数与南北方冬季雾日关系
4.3 不同区域海温影响下的成雾条件分析
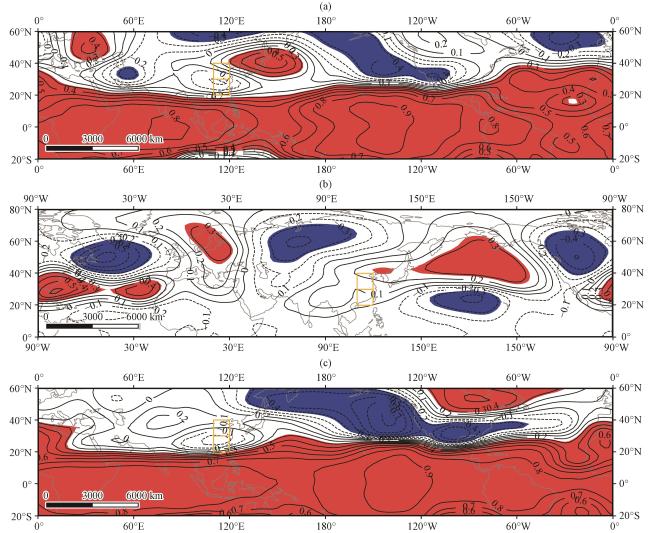
图6 早冬时热带太平洋海温指数(a)、 晚冬时北大西洋海温指数(b)、 晚冬时热带太平洋海温指数(c)与同期250 hPa位势高度的相关系数(等值线)填充区域表示相关系数通过置信度为95%的t检验, 红、 蓝色分别表示正、 负相关; 橘色框表示中国东部南、 北方 Fig.6 Correlation coefficients (contour) between Tropical Pacific SST Index in early winter (a), North Atlantic SST Index in late winter (b), Tropical Pacific SST Index in late winter (c) and 250 hPa geopotential height at the same time.Shading area represents the values above the 95% confidence level, red and blue areas indicate positive and negative correlation, respectively; the orange box represents the southern and northern area of eastern China |
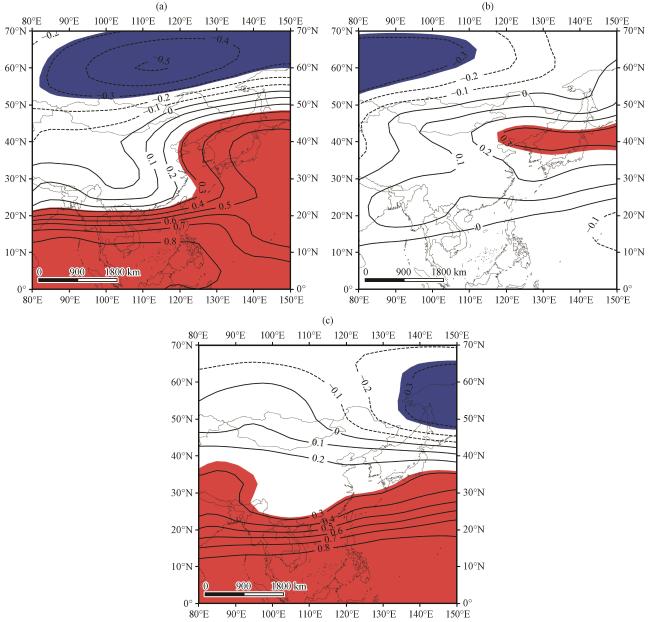
图7 早冬时热带太平洋海温指数(a)、 晚冬时北大西洋海温指数(b)、 晚冬时热带太平洋海温指数(c)与同期东亚区域500 hPa位势高度的相关系数(等值线)填充区域表示相关系数通过置信度为95%的t检验, 红、 蓝色分别表示正、 负相关 Fig.7 Correlation coefficients (contour) between Tropical Pacific SST Index in early winter (a), North Atlantic SST Index in late winter (b), Tropical Pacific SST Index in late winter (c) and 500 hPa geopotential height at the same time.Shading area represents the values above the 95% confidence level, red and blue areas indicate positive and negative correlation, respectively |
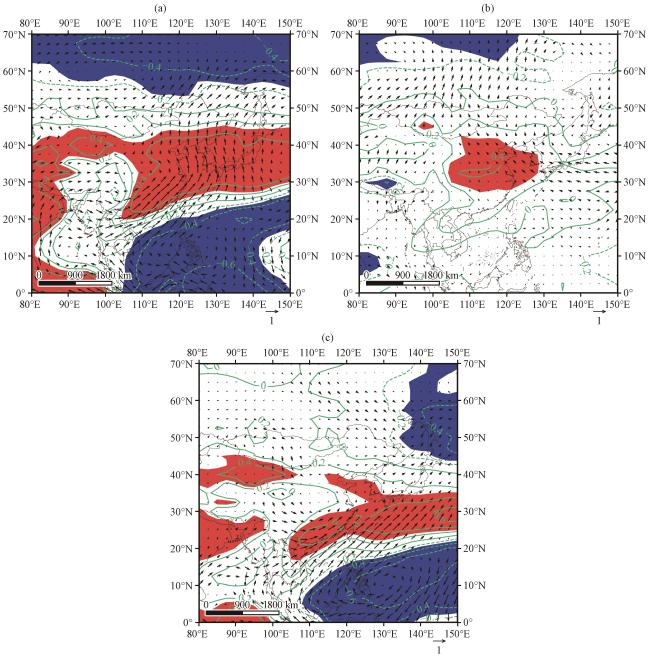
图8 早冬时热带太平洋海温指数(a)、 晚冬时北大西洋海温指数(b)、 晚冬时热带太平洋海温指数(c)分别与同期东亚区域整层大气可降水量(等值线)及850 hPa水平风场(矢量)的相关系数填充区域表示海温指数与整层大气可降水量的相关系数通过置信度为95%的t检验, 红、 蓝色分别表示正、 负相关 Fig.8 Correlation coefficients between Tropical Pacific SST Index in early winter (a), North Atlantic SST Index in late winter (b), Tropical Pacific SST Index in late winter (c) and atmospheric perceptible water (contour) and 850 hPa wind (vector) at the same time.Shading area represents the correlation coefficient between SST index and atmospheric perceptible water above the 95% confidence level, red and blue areas indicate positive and negative correlation, respectively |
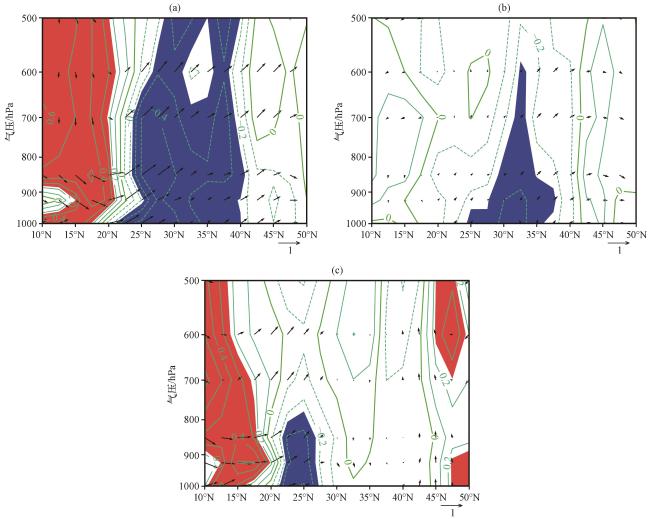
图9 早冬时热带太平洋海温指数(a)、 晚冬时北大西洋海温指数(b)、 晚冬时热带太平洋海温指数(c)分别与同期温度露点差(等值线)和经向及垂直风场(矢量)的相关系数沿10°N -50°N的垂直廓线(取110°E -120°E的平均)填充区域表示海温指数与温度露点差的相关系数通过置信度为95%的t检验, 红、 蓝色分别表示正、 负相关 Fig.9 Meridional-vertical cross sections along 10°N -50°N (average of 110°E -120°E) of the correlation coefficients between Tropical Pacific SST Index in early winter (a), North Atlantic SST Index in late winter (b), Tropical Pacific SST Index in late winter (c) and T-Td (contour) and wind (vector, v and ω) at the same time.Shading area represents the correlation coefficient between SST index and T-Td above the 95% confidence level, red and blue areas indicate positive and negative correlation, respectively |
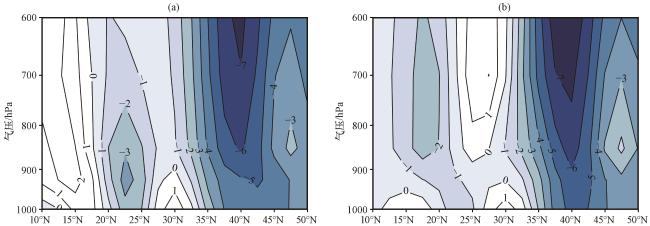


图10 1954 -2006年P坐标垂直速度(等值线, 单位: -0.01 Pa·s-1)在早冬(a)和晚冬(b)沿10°N -50°N的垂直廓线(取110°E -120°E的平均)填色区域表示下沉 Fig.10 Meridional-vertical cross sections along 10°N -50°N (average of 110°E -120°E) of the climatological ω (contour, unit: -0.01 Pa·s-1) in early winter (a) and late winter (b) during 1954 -2006.Shading area indicates subsidence |