
1 引言
2 资料来源与方法介绍
2.1 资料来源
2.2 轨迹模拟方案
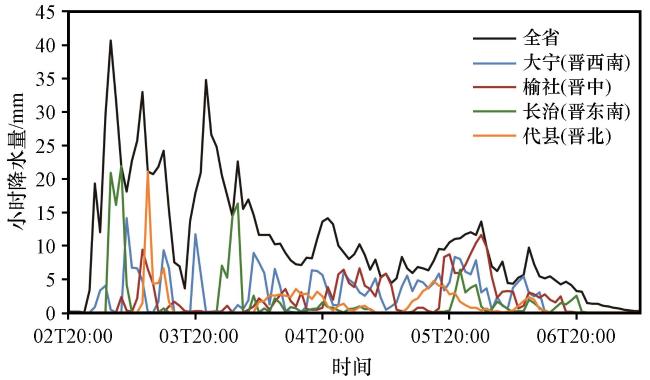
3 降水实况
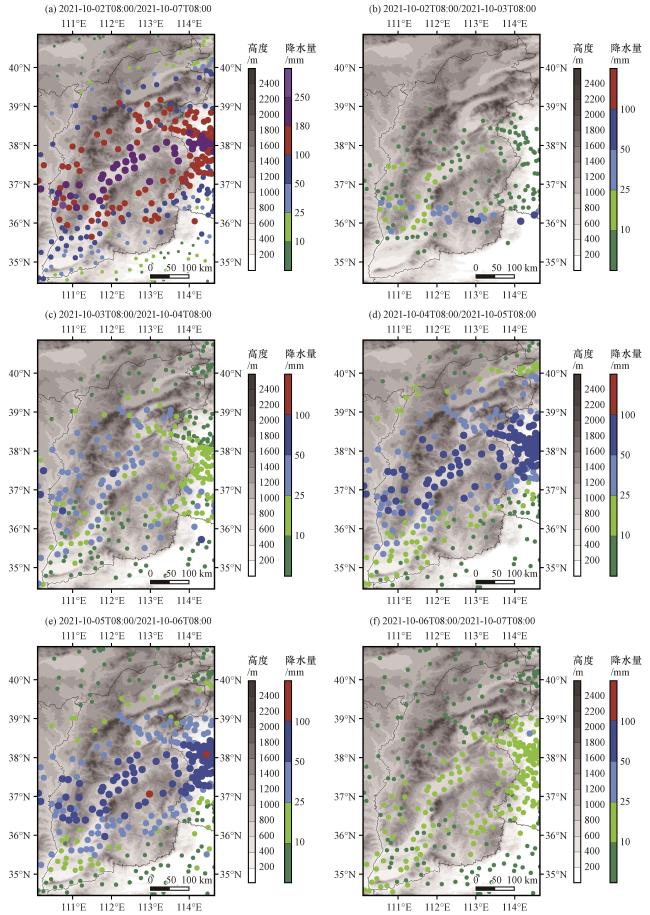
图1 2021年10月2 -6日总降水量(a)及逐日累计降水量(b~f)(彩色圆点, 单位: mm)灰色阴影为地形高度(单位: m) Fig.1 Total precipitation and daily accumulated precipitation from October 2 to 6, 2021 (color dotted, unit: mm).Grey shadings represent the height of terrain (unit: m) |
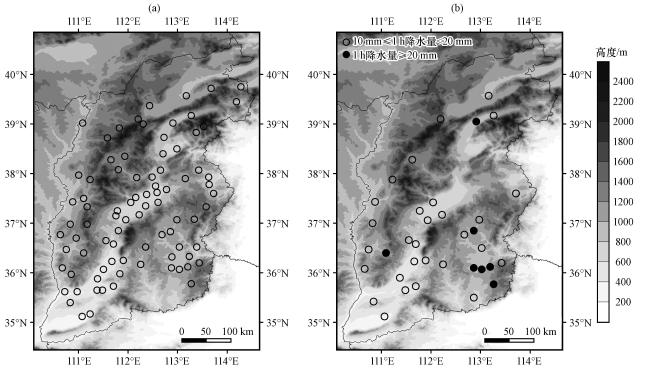
图2 2021年10月2 -6日总降水量超过历史同期极值的站点(a)及2 -6日出现1 h降水量达10 mm以上且超过历史同期极值的站点(b)Fig.2 Stations where total precipitation from October 2 to 6, 2021 exceeded the historical maximum (a) and stations where occurred 1-h precipitation more than 10 mm from 2 to 6 and exceeded historical maximum over the same period |
4 降水极端性成因
4.1 环流形势
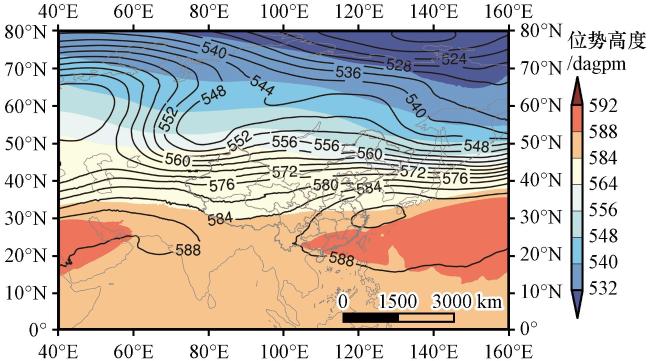
图4 2021年10月2 -6日500 hPa平均位势高度(等值线, 单位: dagpm)和2011 -2020年同期500 hPa平均位势高度(彩色区, 单位: dagpm)对比Fig.4 Comparison between the average geopotential height of 500 hPa from 2 to 6 October 2021 (contours, unit: dagpm) and the average geopotential height during same period from 2011 to 2020 (color area, unit: dagpm) |

图5 2021年10月2日20:00(a)、 3日08:00(b)、 4日08:00(c)、 5日08:00(d)500 hPa位势高度(等值线, 单位: dagpm)和海平面气压(彩色区, 单位: hPa)Fig.5 The geopotential height at 500 hPa (contours, unit: dagpm) and sea level pressure (color area, unit: hPa) at 20:00 on 2 (a), 08:00 on 3 (b), 08:00 on 4 (c), 08:00 on 5 (d) October 2021 |
4.2 低空急流及水汽输送
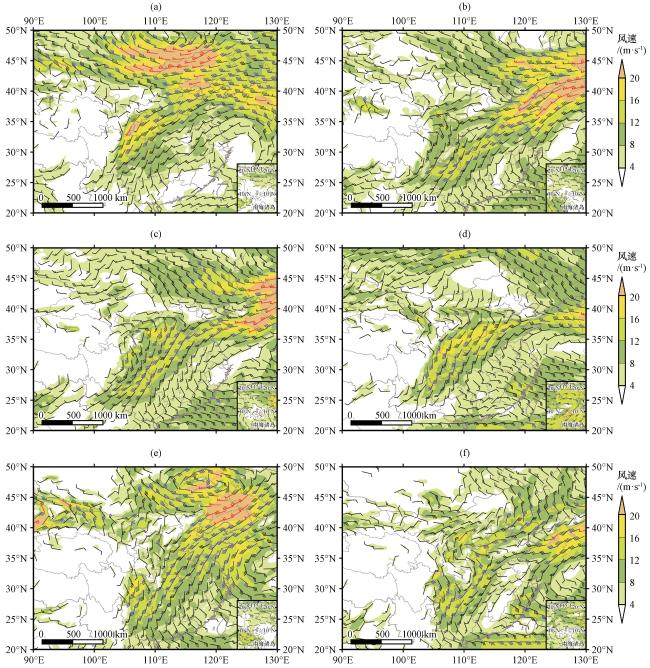
图6 2021年10月2日20:00(a)、 3日20:00(b)、 4日08:00(c)、 5日20:00(d)700 hPa风场(风羽和阴影, 单位: m·s-1)和10月3日02:00(e)、 4日08:00(f)850 hPa风场(风羽和阴影, 单位: m·s-1)Fig.6 The wind field at 700 hPa (wind barbs and shadings, unit: m·s-1) at 20:00 on 2 (a), 20:00 on 3 (b), 08:00 on 4 (c), 20:00 on 5 (d) and the wind field at 850 hPa (wind barbs and shadings, unit: m·s-1) at 02:00 on 3 (e), 08:00 on 4 (f) October 2021 |
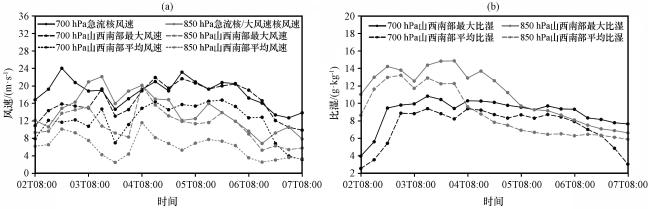
图7 2021年10月2 -6日700 hPa和850 hPa低空急流/西南大风速带中心风速及山西南部风速(单位: m·s-1)时序变化(a)、 山西南部比湿(单位: g·kg-1)时序变化(b)Fig.7 The time series changes of central wind speed of low-level jet/ southwest strong wind belt and the wind speed (unit: m·s-1) in southern Shanxi (a), the time series changes of specific humidity (unit: g·kg-1) in southern Shanxi (b) at 700 hPa and 850 hPa from 2 to 6 October 2021 |
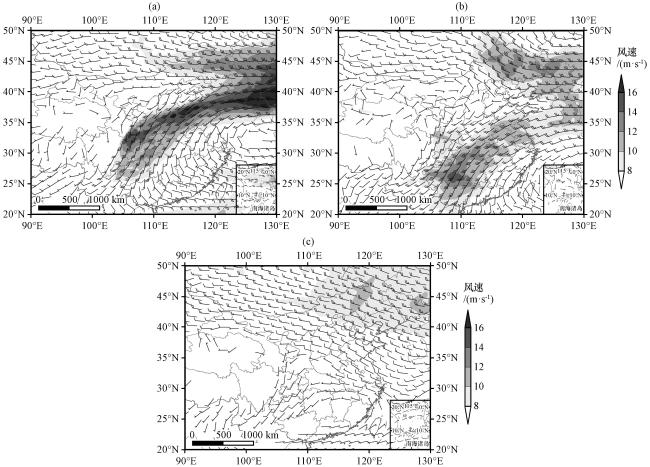
图8 此次极端降水过程(a)与相似环流背景下其他暴雨过程(b)、 常年同期(c)700 hPa平均风场(风羽和阴影, 单位: m·s-1)对比Fig.8 Comparison between the average wind field (wind barbs and shadings, unit: m·s-1) at 700 hPa of this extreme precipitation process (a) and other heavy rainfall process under similar circulation background (b), and the same period on usual years (c) |
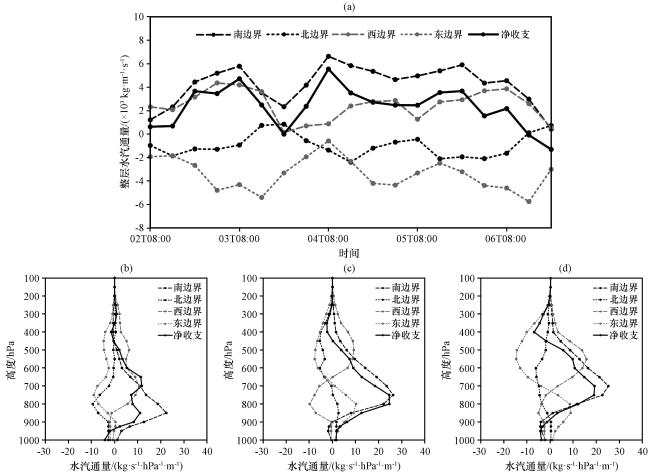
图9 2021年10月2日08:00至6日20:00不同边界整层水汽通量的时间演变(a)、 2日20:00 (b)、 4日08:00 (c)、 5日20:00 (d)不同边界水汽通量的时间-高度剖面Fig.9 The evolution of vertically integrated water vapor flux at different boundaries from 08:00 on 2 to 20:00 on 6 October 2021 (a) and the time-height chart of water vapor flux at different boundaries at 20:00 on 2 (b), 08:00 on 4 (c), 20:00 on 5 (d) October 2021 |
5 水汽源地追踪
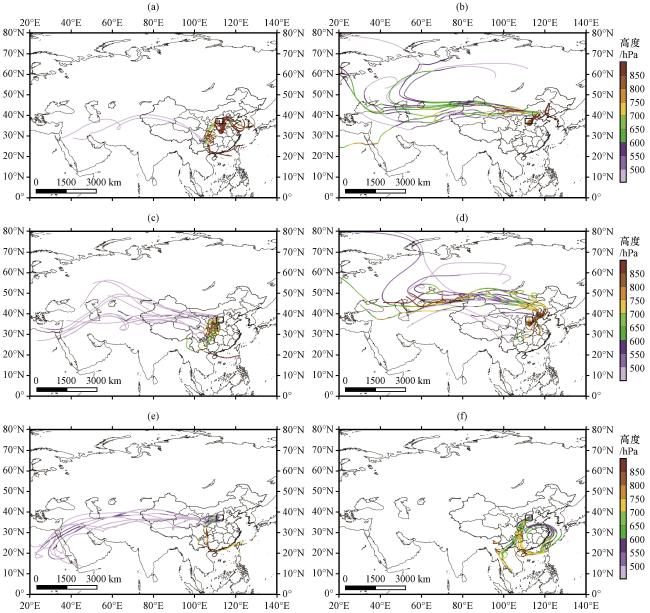
图10 HYSPLIT轨迹模式模拟的2021年10月3日20:00(左)、 5日20:00(右)初始高度为1000 m (a、 b)、 2000 m (c、 d)、 4000 m (e、 f)气团后向追踪240 h的轨迹分布黑色方框表示过程累计降水量大值区; 线条颜色表示轨迹高度(单位: hPa) Fig.10 The horizontal distributions of backward trajectories (backward integrated for 240 h) of air mass by HYSPLIT model at 20:00 on 3 (left) and 20:00 on 5 (right) October 2021 from different initial height respectively at 1000 m (a, b), 2000 m (c, d), 4000 m (e, f).Black box denotes large value area of total accumulated precipitation; color area of lines indicates height (unit: hPa) of trajectories |
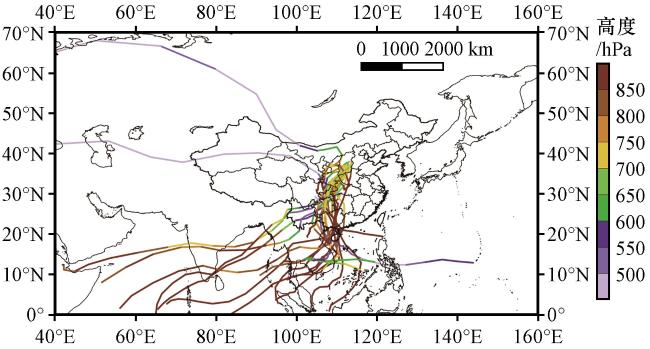
图11 HYSPLIT轨迹模式模拟的2011 -2020年其他暴雨日初始高度为2000 m气团后向追踪240 h的轨迹分布线条颜色为轨迹高度(单位: hPa) Fig.11 The horizontal distributions of backward trajectories (backward integrated for 240 h) of air mass by HYSPLIT model on other heavy rainfall days during 2011 -2020 from initial height at 2000 m.Color lines indicate height (unit: hPa) of trajectories |