1 引言
2 资料来源和方法介绍
1.1 数据来源
2.2 分析方法
表1 干旱指数各干旱等级对应的干旱频率Table 1 Drought frequency corresponding to different drought levels in the drought Index |
| 干旱等级 | 干旱程度 | 所占比重/% | 累积频率/% |
|---|---|---|---|
| 5 | 特旱 | 2 | 0~2 |
| 4 | 重旱 | 5 | 2~7 |
| 3 | 中旱 | 8 | 7~15 |
| 2 | 轻旱 | 15 | 15~30 |
| 1 | 无旱 | 70 | 30~100 |
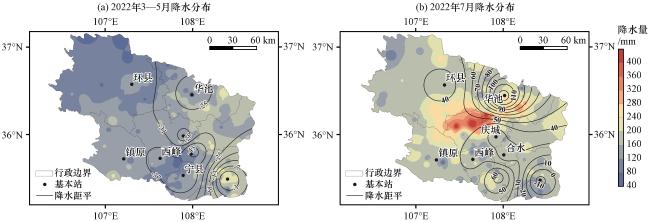
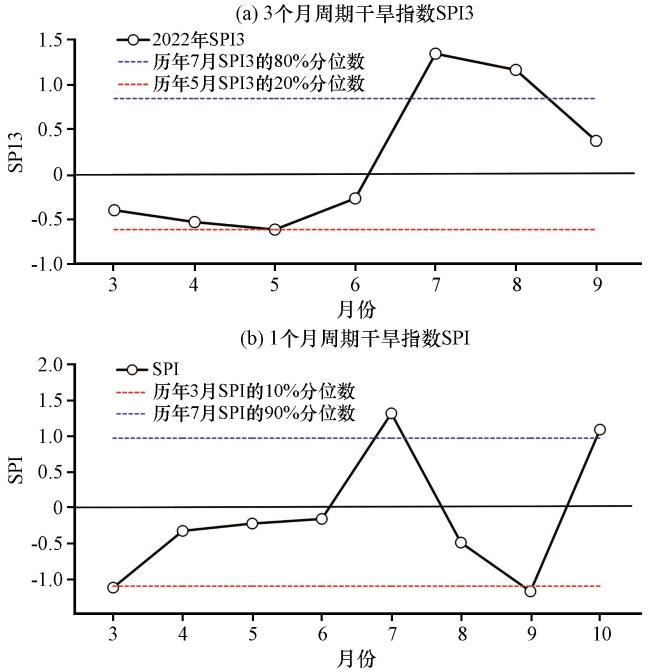
2 2022年旱涝急转特征
3 旱涝急转成因分析
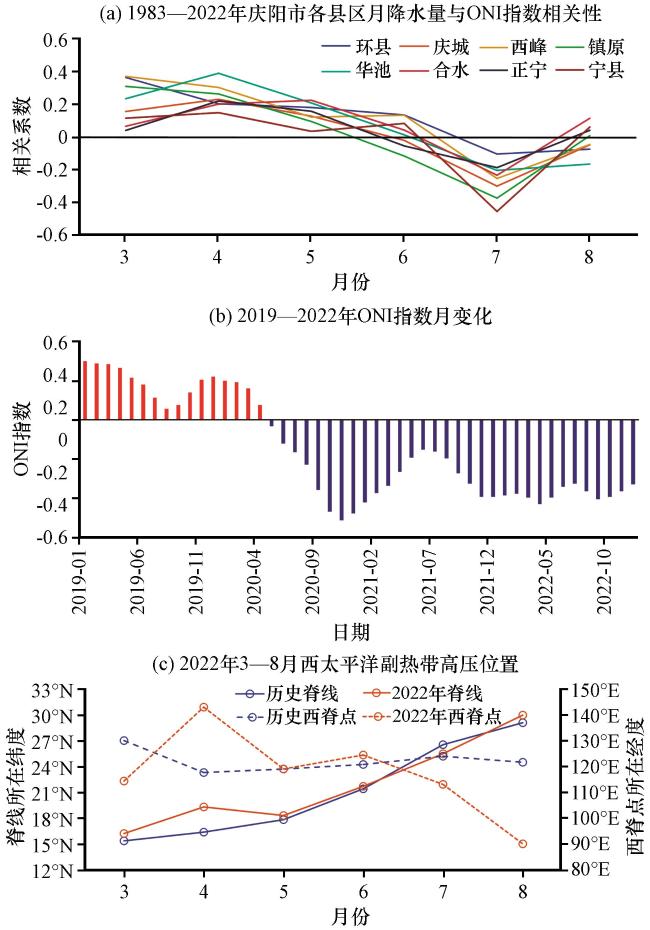
3.1 ENSO事件影响分析
图3 1983 -2022年庆阳市各县区月降水量与ONI指数相关性(a)2019 -2022年ONI指数月变化(b)及2022年3 -8月西太平洋副热带高压位置(c)Fig.3 The correlation between monthly precipitation and ONI index in various counties and districts of Qingyang City from 1983 to 2022 (a), Monthly Changes of ONI Index from 2019 to 2022 (b) and Location of Western Pacific Subtropical High from March to August 2022 (c) |
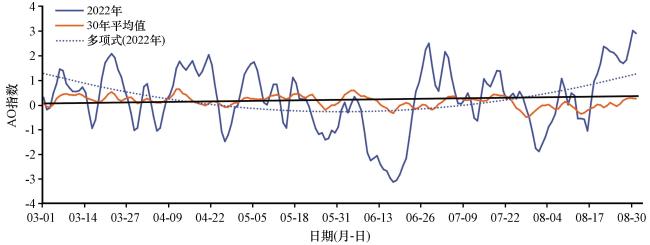
3.2 北极涛动影响分析
3.3 天气尺度大气环流异常分析
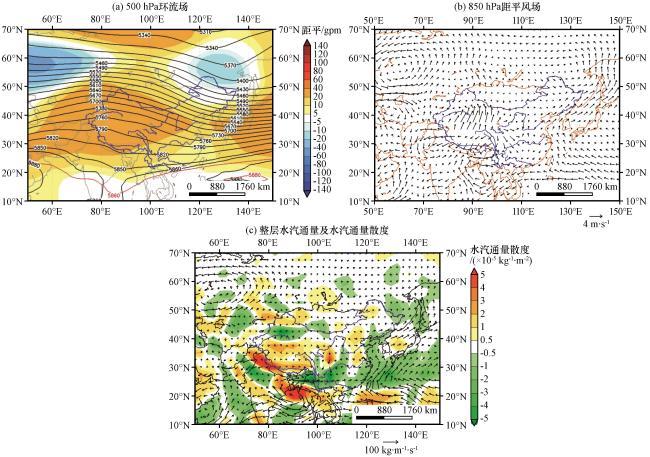
图5 2022年3 -6月500 hPa平均位势高度(等值线, 单位: gpm)及距平场(彩色区, 单位: gpm)(a), 850 hPa距平风场(b, 矢量, 单位: m·s-1), 整层水汽通量(矢量, 单位: kg·m-1·s-1)和水汽通量散度(彩色区, 单位: ×10-5 kg-1·m-2)(c)Fig.5 Mean geopotential height (contour line, unit: gpm) and anomaly field (color area, unit: gpm) at 500 hPa from March to June 2022 (a), anomaly wind field at 850 hPa (b, vector, unit: m·s-1), whole layer water vapor flux (vector, unit: kg·m-1·s-1) and water vapor flux divergence (color area, unit: ×10-5 kg-1· m-2) (c) |
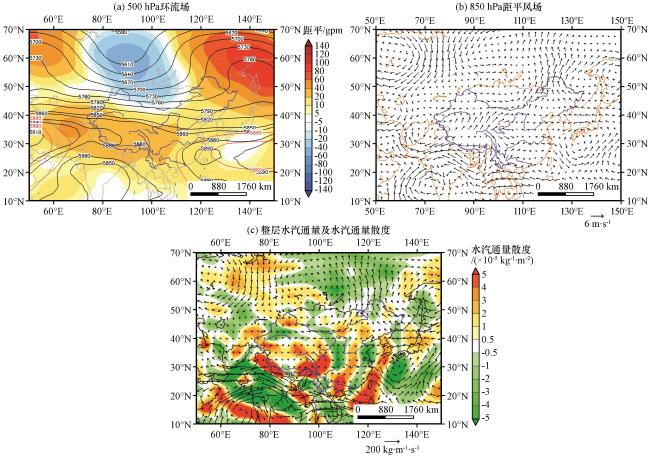
图6 2022年7月500 hPa平均位势高度(等值线, 单位: gpm)及距平场(彩色区, 单位: gpm)(a), 850 hPa距平风场(b, 矢量, 单位: m·s-1), 整层水汽通量(矢量, 单位: kg·m-1·s-1)和水汽通量散度(彩色区, 单位: ×10-5 kg-1·m-2)(c)Fig.6 Mean geopotential height (contour line, unit: gpm) and anomaly field (color area, unit: gpm) at 500 hPa in July 2022 (a), anomaly wind field at 850 hPa (b, vector, unit: m·s-1), whole layer water vapor flux (vector, unit: kg·m-1·s-1) and water vapor flux divergence (color area, unit: ×10-5 kg-1·m-2) (c) |


