
1 引言
2 资料来源与方法介绍
2.1 资料来源
2.2 方法介绍
3 区域性霾日年际变化
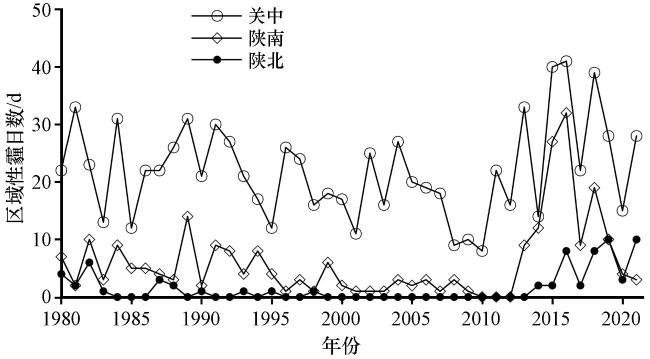
图2 1980 -2021年冬季陕西省各子区区域性霾的年际变化Fig.2 Variations of annual regional haze day in winter over different sub-region in Shaanxi Province from 1980 to 2021 |
表1 2019 -2021年冬季陕西省各子区持续性区域性霾事件列表Table 1 A list of winter persistent regional haze events in each sub-region during 2019 -2021 |
| 子区域 | 序号 | 开始与结束日期 | 持续天数/d |
|---|---|---|---|
| 关中 | 1 | 2019-12-20至2019-12-25 | 6 |
| 2 | 2020-01-02至 2020-01-04 | 3 | |
| 3 | 2020-01-16至 2020-01-18 | 3 | |
| 4 | 2020-01-22至 2020-01-26 | 5 | |
| 5 | 2020-02-05至 2020-02-07 | 3 | |
| 6 | 2020-12-06至 2020-12-09 | 4 | |
| 7 | 2021-02-10至 2021-02-12 | 3 | |
| 8 | 2022-01-03至 2022-01-09 | 7 | |
| 9 | 2022-01-19至 2022-01-25 | 7 | |
| 10 | 2022-02-10至 2022-02-16 | 7 | |
| 陕南 | 1 | 2019-12-31至2020-01-04 | 5 |
| 陕北 | 1 | 2022-01-05至2022-01-09 | 5 |
| 2 | 2022-01-20至2022-01-24 | 5 |
4 关中冬季持续性区域性霾事件对应的大气背景环流
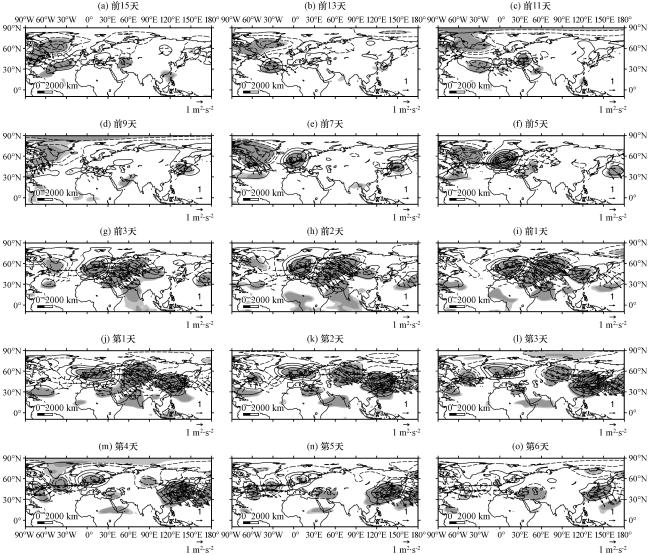
图3 冬季关中126次持续性区域性霾事件出现前15天至第6天500 hPa逐日位势高度异常合成场(等值线, 单位: gpm)和波作用通量(矢量, 单位: m2·s-2)深浅阴影表示通过95%和90%的信度检验 Fig.3 Instantaneous fields of the composite daily Z500 anomalies (contours, interval=10; unit: gpm) and horizontal components of wave activity (arrows, units: m2·s-2) from Day -15 to Day 6 for the 126 winter persistent haze events in Guanzhong.The darker (lighter)shading regions indicate statistical significance exceeding the 95%(90%) confidence level |
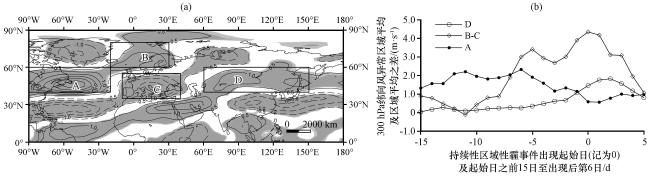
图4 冬季关中126次持续性区域性霾事件出现前15天至第6天300 hPa纬向风异常合成(a, 阴影, 单位: m·s-1)及300 hPa纬向风异常区域A(90°W -20°W, 40°N -60°N)和D(60°E -150°E, 40°N -60°N)平均以及B(20°W -30°E, 60°N -80°N)和C(10°W -40°E, 35°N -55°N)的平均差值时间序列(b)深浅阴影表示通过95%和90%的信度检验 Fig.4 Composite 300 hPa zonal wind anomalies between Day-15 and Day 6 for the 126 winter persistent haze events in Guanzhong (a, the shaded, unit: m·s-1), and composite daily time series of region-averaged 300 hPa zonal wind anomalies in region A(90°W -20°W, 40°N -60°N) and in region D (60°E -150°E, 40°N -60°N) and the difference in region-averaged zonal wind anomalies between region B (20°W -30°E, 60°N -80°N) and regions C (10°W -40°E, 35°N -55°N) (b).The darker (lighter) shading regions indicate statistical significance exceeding the 95% (90%) confidence level |
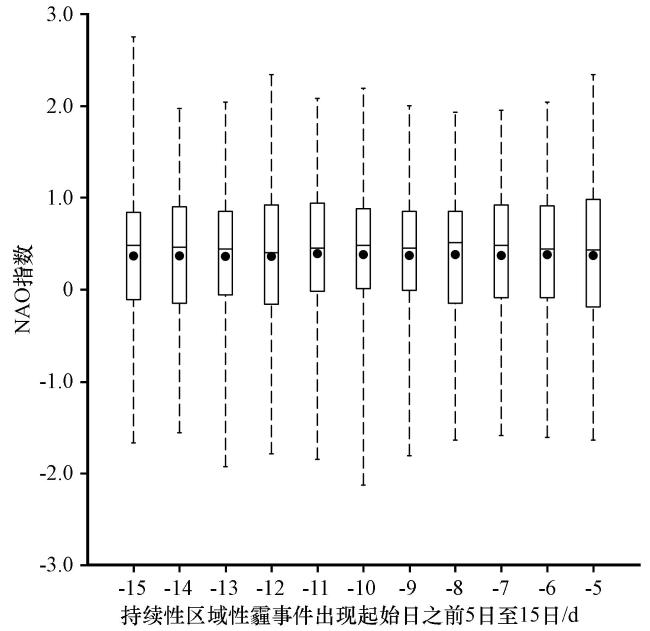
图5 关中冬季126次持续性区域性霾事件前15天至前5天的NAO指数分布矩形内圆点是均值, 横线是中位值, 上下线端是最大值和最小值, 上下边分别是第(75%)和第(25%)四分位置 Fig.5 Statistics of daily NAO index from day -15 to day -5 for the 126 winter persistent haze events in Guanzhong.Within the rectangle, the dots represent the mean, the horizontal line represent the median, the upper and lower lines represent the maximum and minimum values, and the upper and lower edges represent the (75%) and (25%) quartile positions, respectively |
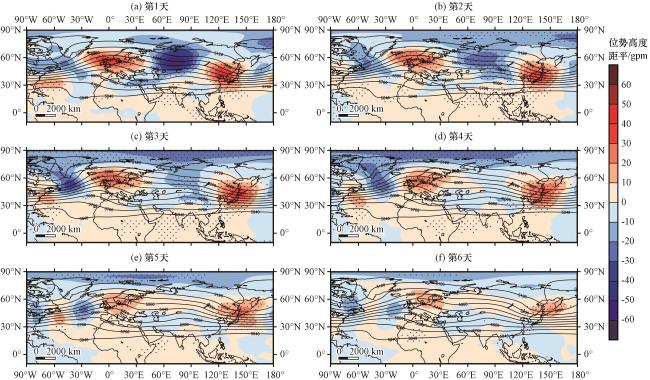
图6 关中冬季126次持续性区域性霾事件第1~6天500 hPa位势高度(等值线, 单位: gpm)及850 hPa距平(彩色区, 单位: gpm)合成打点区域表示通过90%的信度检验 Fig.6 Instantaneous fields of the composite daily Z500 (contour, interval=10; unit: gpm) and the anomalies (color area, unit: gpm) at 850 hPa from day 1 to day 6 for the 126 winter persistent haze events in Guanzhong.The dots regions indicate statistical significance exceeding the 90% confidence level |
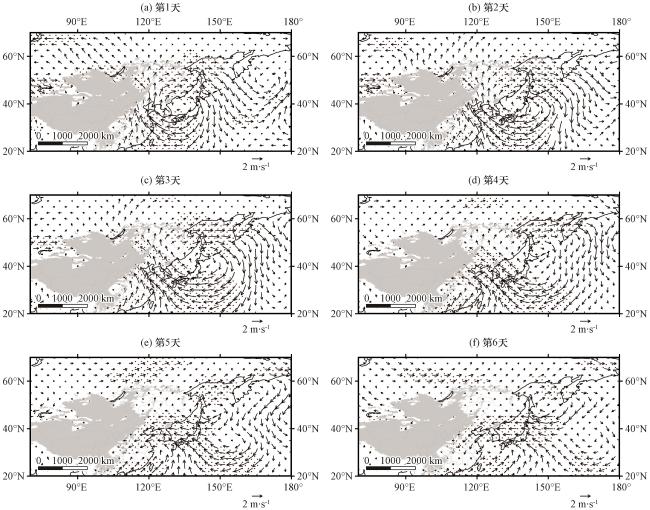
图7 关中冬季126次持续性区域性霾事件第1~6天925 hPa风场异常合成(矢量, 单位: m·s-1)打点区域表示通过了95%的信度检验; 灰色区域表示海拔大于850 m Fig.7 Instantaneous fields of the composite horizontal 925 hPa wind anomaly from day 1 to day 6 for the 126 winter persistent haze events in Guanzhong (vector, unit: m·s-1).The dots regions indicate statistical significance exceeding the 95% confidence level.The grey area covers the region with altitude greater than 850 m |