
1 引言
2 数据来源
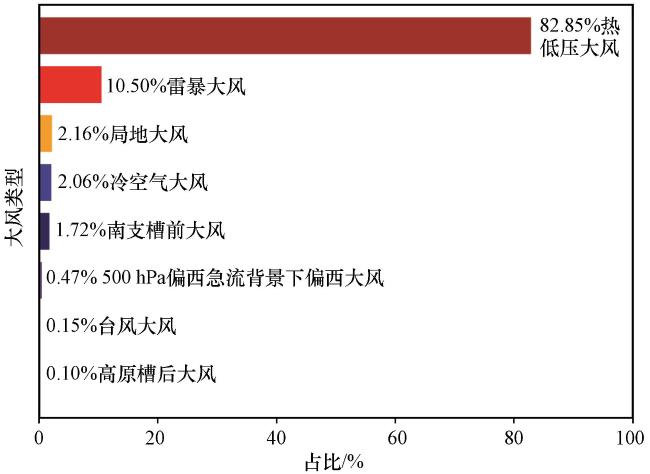
3 大风类型及判定标准
4 大风空间分布特征
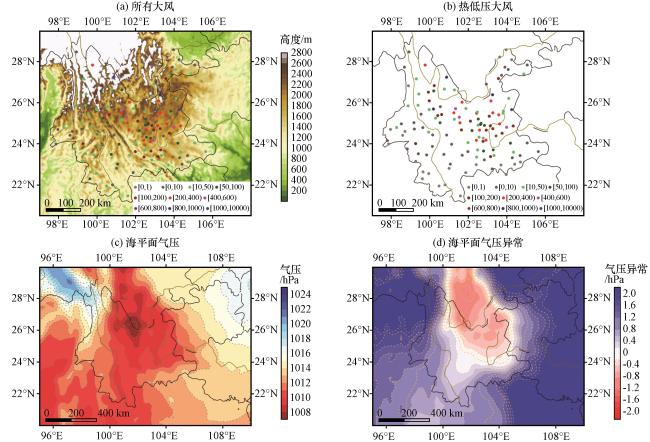
图2 云南125个国家站2013 -2021年发生大风次数(彩色圆点, 单位: 次数)叠加地形(填色, 单位: m)(a)、 发生热低压大风次数(b, 单位: 次数)、 2013 -2021年2 -4月15:00海平面气压平均值(等值线和彩色区, c, 单位: hPa)和相对整个研究时段15:00海平面气压异常值(等值线和彩色区, d, 单位: hPa)Fig.2 The occurring times of all strong winds (colored dots, unit: times) and topography (shading, unit: m) (a), the occurring times of thermal low winds (b, unit: times) at 125 national stations in Yunnan from 2013 to 2021, the composite mean (contour line and coloral area, c, unit: hPa) and anomaly (contour line and coloral area, d, unit: hPa) of sea level pressure at 15:00 during February to April from 2013 to 2021 |
4.1 热低压大风
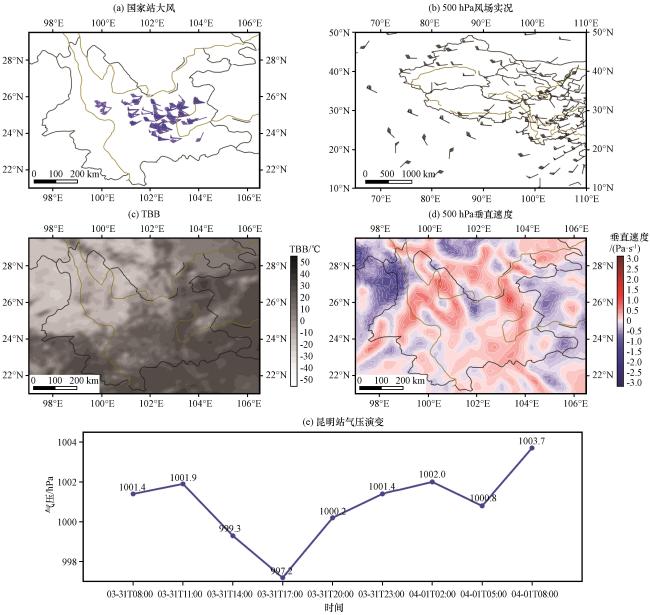
图3 2021年3月31日08:00 -19:59云南国家站17 m·s-1及以上大风(a, 风羽, 单位: m·s-1)、 08:00 500 hPa风场(b, 风羽, 单位: m·s-1)、 15:00 FY-2H-TBB(c, 单位: ℃)、 15:00 500 hPa垂直速度(d, 单位: Pa·s-1)及2021年3月31日08:00至4月1日08:00逐3 h昆明站地面气压演变(e, 单位: hPa)Fig.3 The winds with speed equal to or greater than 17 m·s-1 occurring from 08:00 to 19:59 on March 31, 2021 at national stations in Yunnan (a, wind barbs, unit: m·s-1), the winds on 500 hPa at 08:00 (b, wind barbs, unit: m·s-1), the FY-2H TBB at 15:00 (c, unit: °C), the vertical velocity on 500 hPa at 15:00 (d, unit: Pa·s-1), and the evolution of surface pressure at Kunming every 3 hours from 08:00 on March 31 to 08:00 on April 1, 2021 (e, unit: hPa) |
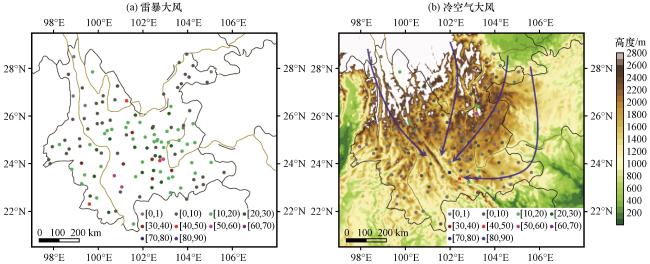
图4 云南125个国家站2013 -2021年发生雷暴大风次数(a, 单位: 次数)和冷空气大风次数(彩色圆点, 单位: 次数)叠加地形(填色, 单位: m)以及进入云南的冷空气常见路径(蓝线箭头)(b)Fig.4 The occurring times of thunderstorm winds (a, unit: times) and cold-air winds (colored dots, unit: times) overlaying the topography (shading, unit: m) and the main pathways of cold air entering Yunnan (blue line arrows) (b) at 125 national stations in Yunnan from 2013 to 2021 |
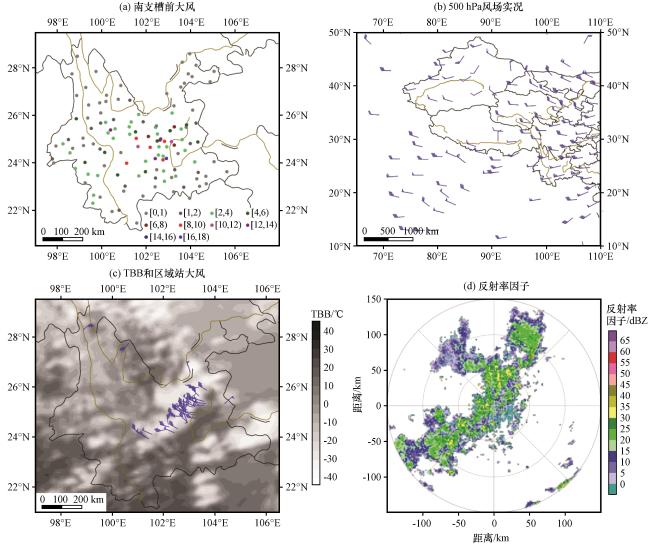
图5 云南125个国家站2013 -2021年发生南支槽前大风次数(a, 单位: 次数)、 2020年3月3日08:00 500 hPa风场(b, 风羽, 单位: m·s-1)、 2020年3月3日17:00 -17:59区域站17 m·s-1及以上大风(风羽, 单位: m·s-1)叠加17:00 FY-2H-TBB(填色, 单位: ℃)(c)和2020年3月3日17:03昆明雷达0.5°仰角反射率因子(d, 单位: dBZ)Fig.5 The occurring times of winds before southern trough at 125 national stations in Yunnan from 2013 to 2021 (a, unit: times), the winds on 500 hPa at 08:00 on March 3, 2020 (b, wind barbs, unit: m·s-1), the winds with speed equal to or greater than 17 m·s-1 occurring from 17:00 to 17:59 on March 3, 2020 at regional stations (wind barbs, unit: m·s-1) and FY-2H TBB (shading, unit: °C) at 17:00 on March 3, 2020 (c), the reflectivity factor of 0.5 elevation of Kunming radar at 17:03 on March 3, 2020 (d, unit: dBZ) |
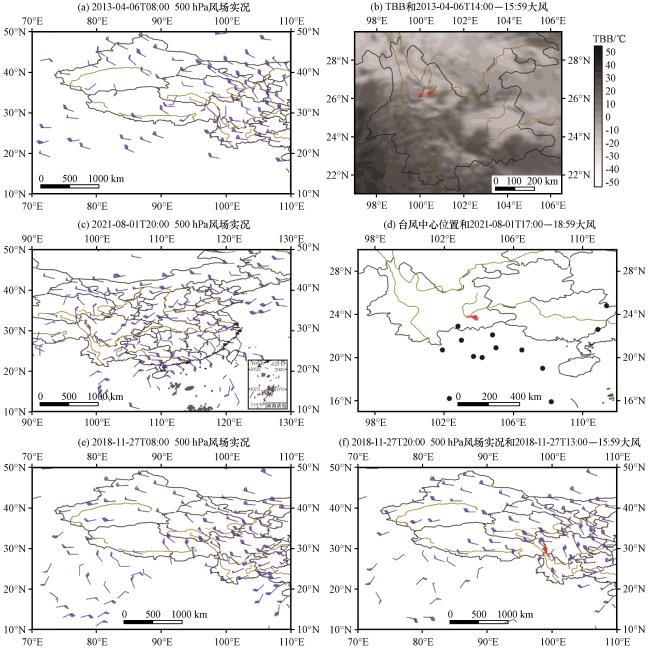
图6 2013年4月6日08:00 500 hPa风场实况(a, 风羽, 单位: m·s-1)、 2013年4月6日14:00 -15:59国家站大风(风羽, 单位: m·s-1)叠加2013年4月6日14:30 FY-2F-TBB(填色, 单位: ℃)(b)、 2021年8月1日20:00 500 hPa风场实况(c, 风羽, 单位: m·s-1)、 2021年8月1日17:00 -18:59国家站大风(风羽, 单位: m·s-1)及所有台风大风发生时台风中心位置(黑色圆点, d)、 2018年11月27日08:00 (e)和20:00 (f) 500 hPa风场实况(风羽, 单位: m·s-1), 20:00实况叠加13:00 -15:59国家站大风(f, 红色风羽, 单位: m·s-1)Fig.6 The winds on 500 hPa at 08:00 on April 6, 2013 (a, wind barbs, unit: m·s-1), the winds with speed equal to or greater than 17 m·s-1 occurring from 14:00 to 15:59 on April 6, 2013 at national stations (wind barbs, unit: m·s-1) and FY-2F TBB (shading, unit: °C) at 14:30 on April 6, 2013 (b), the winds on 500 hPa at 20:00 on August 1, 2021 (c, wind barbs, unit: m·s-1), the winds with speed equal to or greater than 17 m·s-1 occurring from 17:00 to 18:59 on August 1, 2021 at national stations (wind barbs, unit: m·s-1)and the centers of typhoons (black dots) when all typhoon winds occur (d), the winds on 500 hPa at 08:00 (e, wind barbs, unit: m·s-1) and 20:00 (f, wind barbs, unit: m·s-1) overlaying the winds with speed equal to or greater than 17 m·s-1 occurring from 13:00 to 15:59 at national stations (f, red wind barbs, unit: m·s-1) on November 27, 2018 |
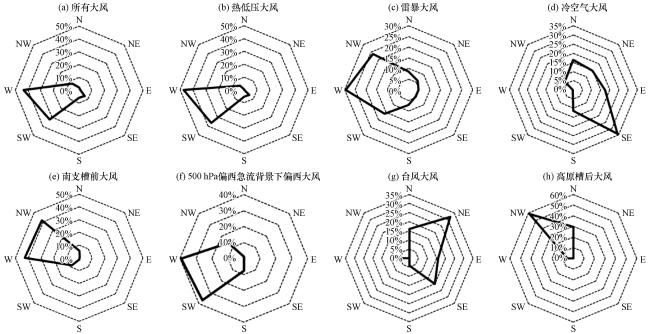
图7 所有大风和不同类型大风风向玫瑰图Fig.7 The rose charts of wind directions for all and different types of strong winds |
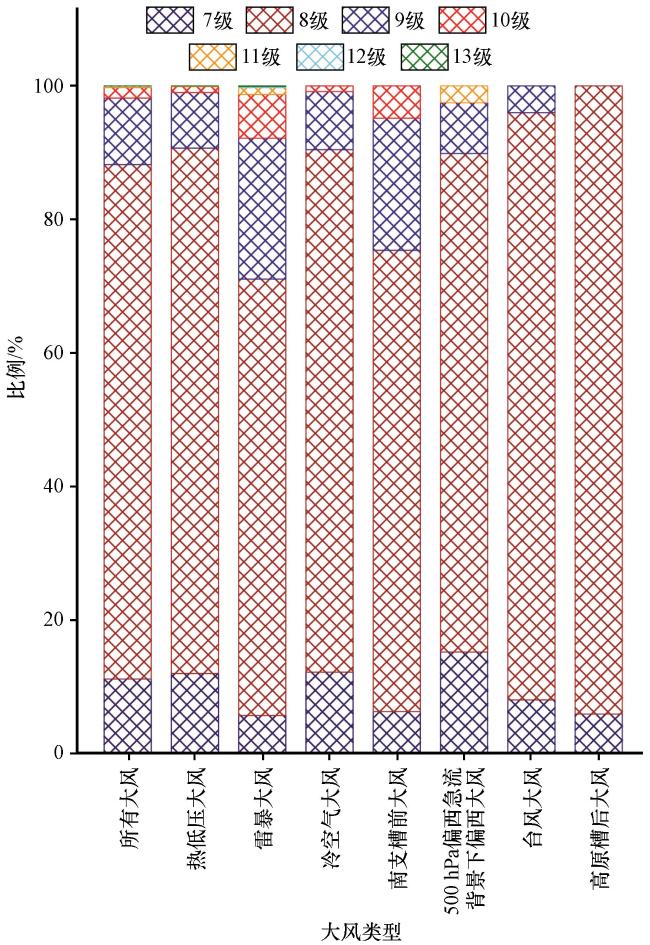
图8 所有大风和不同类型大风不同等级大风发生比例(单位: %)7级风统计的风速区间为[171] m·s-1, 8级为[17.2, 207] m·s-1、 9级为[20.8, 244] m·s-1、 10级为[24.5, 284] m·s-1、 11级为[28.5, 32.6] m·s-1、 12级为[32.7, 36.9] m·s-1、 13级为[37.0, 414] m·s-1 Fig.8 The proportions of winds with different levels for all and different types of strong winds.Unit: %.The wind speed range for level 7 is [171] m·s-1, level 8 is [17.2, 207] m·s-1, level 9 is [20.8, 244] m·s-1, level 10 is [24.5, 284] m·s-1, level 11 is [28.5, 32.6] m·s-1, level 12 is [32.7, 36.9] m·s-1, and level 13 is [37.0, 414] m·s-1 |

图9 所有大风和不同类型大风发生站次年变化Fig.9 The annual variations of occurring times for all and different types of strong winds |
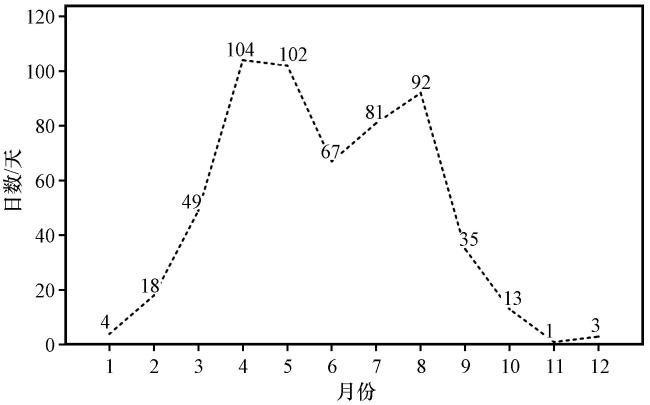
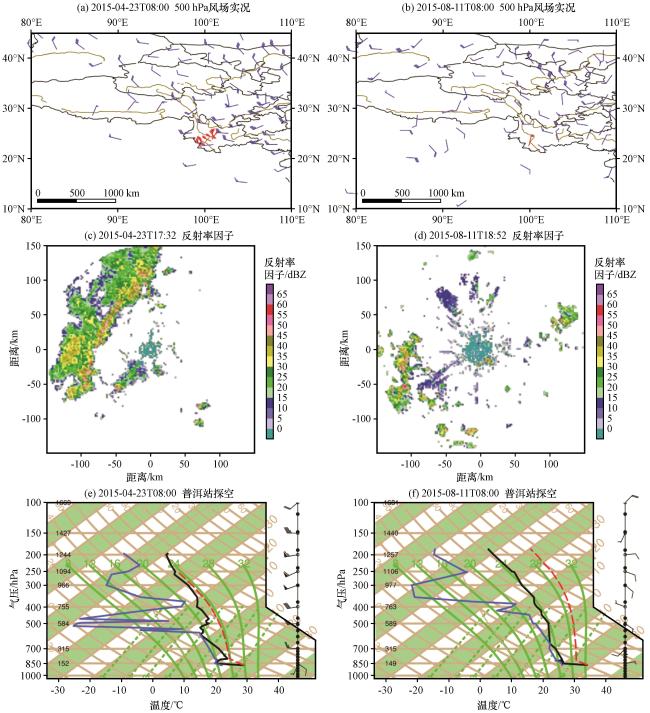
图11 2015年4月23日08:00 500 hPa风场实况(蓝色风羽, 单位: m·s-1)叠加17:00 -17:59普洱区域站7级及以上大风(风速≥13.9 m·s-1, 红色风羽, 单位: m·s-1)(a)、 2015年8月11日08:00 500 hPa风场实况(蓝色风羽, 单位: m·s-1)叠加18:00 -18:59普洱区域站7级及以上大风(红色风羽, 单位: m·s-1)(b)、 2015年4月23日17:32普洱0.5°仰角反射率因子(c, 单位: dBZ)、 2015年8月11日18:52普洱0.5°仰角反射率因子(d, 单位: dBZ)、 2015年4月23日08:00普洱订正探空(e)及2015年8月11日08:00普洱订正探空(f)Fig.11 The winds on 500 hPa at 08:00 on April 23, 2015 (blue wind barbs, unit: m·s-1) and the winds with speed equal to or greater than 13.9 m·s-1 occurring from 17:00 to 17:59 on April 23, 2015 at regional stations over Pu’er (red wind barbs, unit: m·s-1) (a), the winds on 500 hPa at 08:00 on August 11, 2015 (blue wind barbs, unit: m·s-1) and the winds with speed equal to or greater than 13.9 m·s-1 occurring from 18:00 to 18:59 on August 11, 2015 at regional stations over Pu’er (red wind barbs, unit: m·s-1) (b), the reflectivity factor of 0.5 elevation of Pu’er radar at 17:32 on April 23, 2015 (c, unit: dBZ), the reflectivity factor of 0.5 elevation of Pu’er radar at 18:52 on August 11, 2015 (d, unit: dBZ), the revised T-logP of Pu'er at 08:00 on April 23, 2015 (e) and the revised T-logP of Pu'er at 08:00 on August 11, 2015 (f) |
4.2 雷暴大风
4.3 冷空气大风
4.4 南支槽前大风
4.5 其他类型大风
5 大风风向风速特征
5.1 风向特征
5.2 风速特征
表1 所有大风和不同类型大风风速平均值、 25%和75%分位值、 最大值Table 1 The average, 25% and 75% percentile, maximum of wind speeds for all and different types of strong winds |
| 所有 大风 | 热低压 大风 | 雷暴 大风 | 冷空气 大风 | 南支槽前大风 | 500 hPa偏西急流背景下偏西大风 | 台风 大风 | 高原槽后大风 | |
|---|---|---|---|---|---|---|---|---|
| 平均值/(m·s-1) | 18.7 | 18.6 | 19.9 | 18.4 | 19.5 | 18.8 | 18.1 | 18.5 |
| 25%值/(m·s-1) | 17.4 | 17.4 | 17.8 | 17.3 | 17.9 | 17.3 | 17.4 | 17.4 |
| 75%值/(m·s-1) | 19.4 | 19.2 | 21.1 | 18.8 | 20.7 | 19.2 | 18.6 | 18.9 |
| 最大值/(m·s-1) | 39.4 | 39.4 | 38.1 | 26.3 | 26.6 | 31.1 | 20.9 | 20.7 |
6 大风时间演变特征
6.1 年变化特征
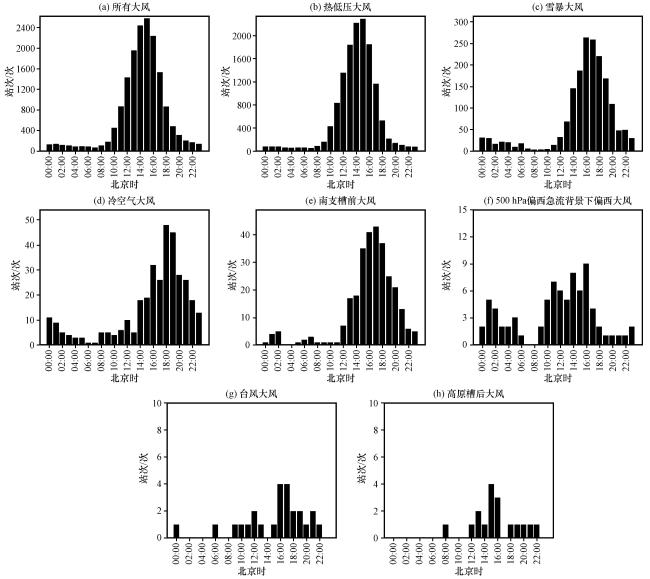
6.2 日变化特征
表2 所有大风和不同类型大风发生站次时间变化特征Table 2 The temporal characteristics of occurring times for all and different types of strong winds |
| 所有 大风 | 热低压大风 | 雷暴 大风 | 冷空气 大风 | 南支槽前大风 | 500 hPa偏西急流背景下偏西大风 | 台风 大风 | 高原槽后大风 | ||
|---|---|---|---|---|---|---|---|---|---|
| 年 变 化 | 主要时段 | 冬春季 | 冬春季 | 春夏季 | 冬春季、 初夏 | 2 -4月 | 11月至次年4月 | 夏秋季 | 全年 |
| 峰值月份 | 3月 | 3月 | 4月和8月/次高峰 | 3 -4月 | 4月 | 2月 | 8 -9月 | - | |
| 日 变 化 | 主要时段 | 白天 | 白天 | 午后 | 午后至凌晨 | 午后 | 午后和凌晨 | 白天 | 白天和刚入夜 |
| 峰值时间 | 15:00 -15:59 | 15:00 -15:59 | 16:00 -17:59 | 18:00 -19:59 | 16:00 -17:59 | 16:00 -16:59 | 16: 00 -17:59 | 15: 00 -16:59 | |
-代表无数据(- represents no data available) |