
1 引言
2 研究区域与观测数据
2.1 站点介绍
2.2 数据来源和仪器介绍
表1 观测所使用的科学仪器介绍Table 1 Description of scientific instruments used in the observations |
| 观测项目 | 仪器 | 仪器精度 | 架设高度(埋设深度)/m |
|---|---|---|---|
| 感热通量 | Campbell公司的CAST3超声风速仪 | ±4.0 cm·s-1 | 3.2 |
| 潜热通量 | LI-COR公司的LI-7500型H2O/CO2分析仪 | ±2% | 3.2 |
| 辐射四分量 | Kipp&Zonen公司的CNR4辐射四分量观测仪 | ±2.5% | 1.5 |
| 土壤热通量 | Hukseflux公司的HFP01热通量传感器 | -15%~5% | 0.05、 0.2 |
| 土壤温度 | Campbell公司的109L型热敏温度探头 | ±0.2 ℃ | 0.05、 0.10、 0.20、 0.40、 0.80、 1.60、 3.20 |
| 土壤湿度 | Campbell公司的CS616 | ±2.5% | 0.05、 0.10、 0.20、 0.40、 0.80、 1.60 |
表2 黄河源玛多站土壤质地Table 2 Soil texture at Mado station, Yellow River source |
| 土层 | 深度/m | 有机质/(kg·m-3) | 黏土/% | 砂土/% |
|---|---|---|---|---|
| 1 | 0.0175 | 85.00 | 26.96 | 38.64 |
| 2 | 0.0451 | 75.12 | 26.96 | 38.64 |
| 3 | 0.0906 | 40.14 | 14.21 | 68.60 |
| 4 | 0.1655 | 31.37 | 21.28 | 65.41 |
| 5 | 0.2891 | 18.14 | 21.28 | 65.41 |
| 6 | 0.4929 | 1.92 | 3.44 | 94.03 |
| 7 | 0.7289 | 1.18 | 2.69 | 93.42 |
| 8 | 1.3828 | 1.10 | 3.97 | 94.17 |
| 9 | 2.2961 | 0.00 | 3.97 | 94.17 |
| 10 | 3.8019 | 0.00 | 4.32 | 91.52 |
2.3 研究方法介绍
2.4 陆面模式CLM5.0介绍
3 实验设计
3.1 CLM5.0土壤加密分层方案
表3 改进后的3种土壤分层方案的土壤节点深度和土壤层次Table 3 Soil node depths and soil horizons for the three improved soil layering schemes |
| 方案 | 土壤节点深度/m | 土壤层次/层 |
|---|---|---|
| 方案一 | 0.007、 0.028、 0.062、 0.118、 0.212、 0.366、 0.619、 1.038、 1.717、 2.865 | 10 |
| 方案二 | 0.007、 0.017、 0.027、 0.045、 0.062、 0.09、 0.118、 0.165、 0.212、 0.289、 0.366、 0.492、 0.619、 0.828、 1.038、 1.382、 1.727、 2.296、 2.284、 3.433 | 20 |
| 方案三 | 0.0004、 0.001、 0.0019、 0.0031、 0.0045、 0.0064、 0.0088、 0.0118、 0.0158、 0.0208、 0.0273、 0.0357、 0.0464、 0.0602、 0.0778、 0.1005、 0.1297、 0.1671、 0.2151、 0.2768、 0.356、 0.4577、 0.5883、 0.7559、 0.9712、 1.2476、 1.6026、 2.0583、 2.6435、 3.3949 | 30 |
3.2 实验设计
4 模拟结果分析
4.1 加密分层方案对玛多站土壤温度的模拟结果
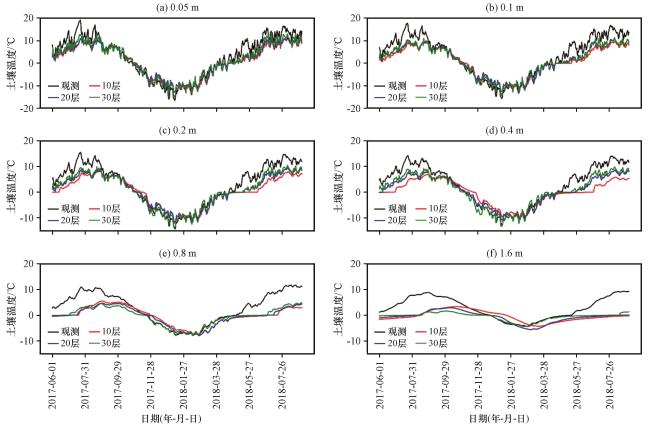
表4 各层土壤温度3种分层方案模拟值与观测值的统计分析Table 4 Statistical analysis of simulated and observed values for three stratification schemes of soil temperature in each layer |
| 统计量 | 分层方案 | 0.05 m | 0.1 m | 0.2 m | 0.4 m | 0.8 m | 1.6 m | 平均 |
|---|---|---|---|---|---|---|---|---|
| R | 10层 | 0.961 | 0.960 | 0.944 | 0.908 | 0.855 | 0.517 | 0.857 |
| 20层 | 0.965 | 0.976 | 0.973 | 0.974 | 0.898 | 0.762 | 0.924 | |
| 30层 | 0.974 | 0.979 | 0.983 | 0.984 | 0.954 | 0.851 | 0.954 | |
| RMSE/℃ | 10层 | 3.577 | 4.059 | 4.113 | 4.841 | 4.589 | 4.812 | 4.331 |
| 20层 | 3.388 | 3.392 | 3.241 | 3.348 | 4.538 | 4.568 | 3.745 | |
| 30层 | 2.706 | 3.210 | 2.698 | 2.716 | 4.178 | 4.498 | 3.334 |
4.2 加密分层方案对玛多站土壤湿度的模拟结果
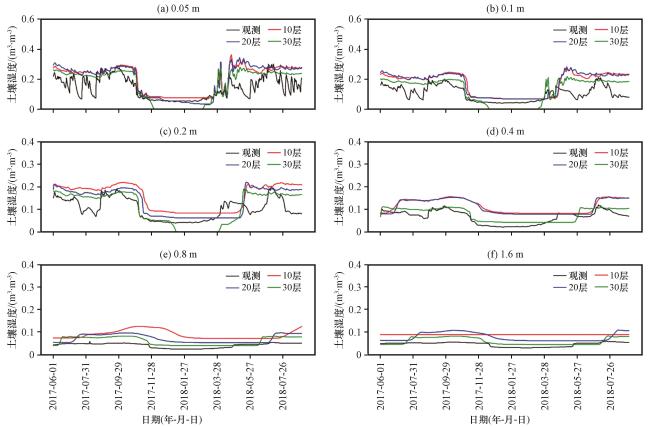
图2 2017 -2018年各层(a~f)土壤湿度3种加密分层方案模拟与观测对比Fig.2 Comparison of simulation and observation of 3 encrypted stratification schemes for soil moisture in each layer (a~f) from 2017 to 2018 |
表5 各层土壤湿度3种分层方案模拟值与观测值的统计分析Table 5 Statistical analysis of simulated and observed values for three stratification schemes of soil moisture in each layer |
| 统计量 | 分层方案 | 0.05 m | 0.1 m | 0.2 m | 0.4 m | 0.8 m | 1.6 m | 平均 |
|---|---|---|---|---|---|---|---|---|
| R | 10层 | 0.765 | 0.717 | 0.671 | 0.627 | 0.603 | 0.518 | 0.650 |
| 20层 | 0.765 | 0.730 | 0.669 | 0.627 | 0.612 | 0.569 | 0.662 | |
| 30层 | 0.771 | 0.786 | 0.729 | 0.815 | 0.816 | 0.704 | 0.770 | |
| RMSE/(m3·m-3) | 10层 | 0.084 | 0.083 | 0.068 | 0.054 | 0.052 | 0.044 | 0.064 |
| 20层 | 0.087 | 0.084 | 0.056 | 0.052 | 0.033 | 0.035 | 0.057 | |
| 30层 | 0.070 | 0.057 | 0.048 | 0.021 | 0.022 | 0.017 | 0.039 |
4.3 加密分层方案对玛多站土壤冻结期与消融期的模拟结果分析
表6 2017 -2018年玛多站土壤冻融时间模拟与观测对比Table 6 Comparison of simulated and observed soil freeze-thaw times at Mado station from 2017 to 2018 |
| 统计量 | 方案 | 0.05 m | 0.1 m | 0.2 m | 0.4 m | 0.8 m | 1.6 m |
|---|---|---|---|---|---|---|---|
| 冻结初日/(月-日) | 观测 | 10-17 | 10-23 | 10-25 | 11-04 | 11-20 | 12-23 |
| 10层 | 10-22 | 11-03 | 11-07 | 11-20 | 11-27 | 01-15 | |
| 20层 | 10-21 | 10-25 | 11-02 | 11-05 | 11-25 | 12-24 | |
| 30层 | 10-19 | 10-24 | 10-25 | 11-01 | 11-21 | 12-23 | |
| 完全冻结初日/(月-日) | 观测 | 10-24 | 11-02 | 11-03 | 11-05 | 11-21 | 12-24 |
| 10层 | 10-28 | 11-07 | 11-13 | 11-21 | 11-29 | 01-18 | |
| 20层 | 10-26 | 11-05 | 11-06 | 11-14 | 11-28 | 12-24 | |
| 30层 | 10-25 | 11-03 | 11-04 | 11-05 | 11-23 | 12-24 | |
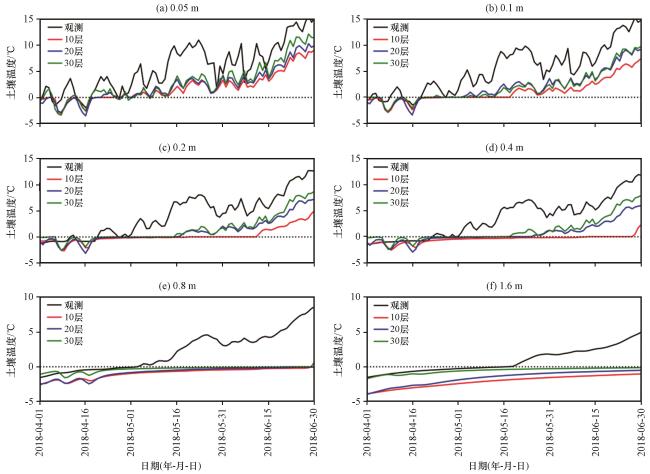
| 消融初日/(月-日) | 观测 | 03-27 | 04-06 | 04-18 | 04-24 | 04-27 | 05-17 |
| 10层 | 04-24 | 05-18 | 06-08 | 06-28 | 07-01 | 07-09 | |
| 20层 | 04-18 | 05-02 | 05-17 | 05-26 | 06-28 | 07-07 | |
| 30层 | 04-02 | 04-20 | 05-14 | 05-18 | 06-27 | 07-06 |
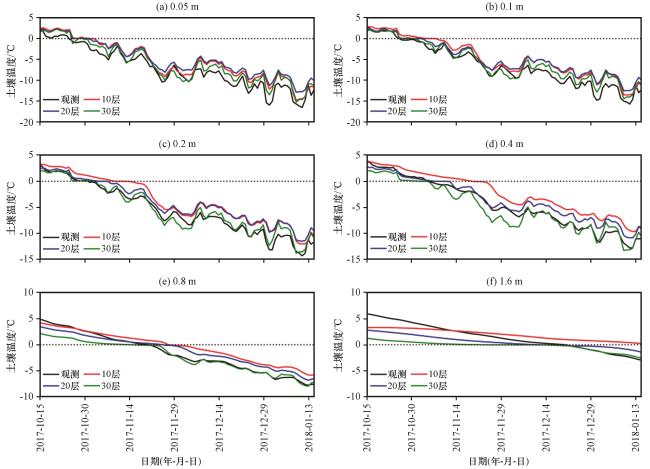
图3 2017 -2018年冻结期各层土壤温度3种加密分层方案模拟与观测对比Fig.3 Comparison of simulations and observations of three encrypted stratification schemes for soil temperatures in each layer during the freezing period from 2017 to 2018 |
表7 冻结期各层土壤温度3种分层方案模拟值与观测值的统计分析Table 7 Statistical analysis of simulated and observed values for three stratification schemes of soil temperature in each layer during the freezing period |
| 统计量 | 方案 | 0.05 m | 0.1 m | 0.2 m | 0.4 m | 0.8 m | 1.6 m | 平均 |
|---|---|---|---|---|---|---|---|---|
| R | 10层 | 0.977 | 0.983 | 0.986 | 0.988 | 0.990 | 0.981 | 0.984 |
| 20层 | 0.982 | 0.988 | 0.992 | 0.994 | 0.985 | 0.989 | 0.988 | |
| 30层 | 0.989 | 0.985 | 0.994 | 0.995 | 0.983 | 0.986 | 0.988 | |
| RMSE/℃ | 10层 | 2.018 | 1.971 | 2.023 | 2.391 | 1.507 | 1.532 | 1.905 |
| 20层 | 2.446 | 2.008 | 1.784 | 1.250 | 1.104 | 1.600 | 1.698 | |
| 30层 | 1.421 | 1.172 | 0.839 | 1.176 | 1.130 | 2.346 | 1.347 |
图4 2017 -2018年消融期各层(a~f)土壤温度3种加密分层方案模拟与观测对比Fig.4 Comparison of simulation and observation of three encrypted stratification schemes for soil temperatures in each layer (a~f) during the ablation period from 2017 to 2018 |
表8 消融期各层土壤温度3种分层方案模拟值与观测值的统计分析Table 8 Statistical analysis of simulated and observed values for three stratification schemes of soil temperature in each layer during the ablation period |
| 统计量 | 方案 | 0.05 m | 0.1 m | 0.2 m | 0.4 m | 0.8 m | 1.6 m | 平均 |
|---|---|---|---|---|---|---|---|---|
| R | 10层 | 0.874 | 0.875 | 0.837 | 0.809 | 0.774 | 0.818 | 0.831 |
| 20层 | 0.876 | 0.890 | 0.873 | 0.861 | 0.820 | 0.857 | 0.862 | |
| 30层 | 0.890 | 0.918 | 0.889 | 0.867 | 0.847 | 0.898 | 0.884 | |
| RMSE/℃ | 10层 | 4.610 | 5.032 | 4.893 | 5.167 | 3.783 | 3.112 | 4.432 |
| 20层 | 4.105 | 4.041 | 3.773 | 3.750 | 3.689 | 2.631 | 3.664 | |
| 30层 | 3.607 | 3.972 | 3.387 | 3.163 | 3.503 | 1.948 | 3.263 |