
1 引言
2 数据来源与方法介绍
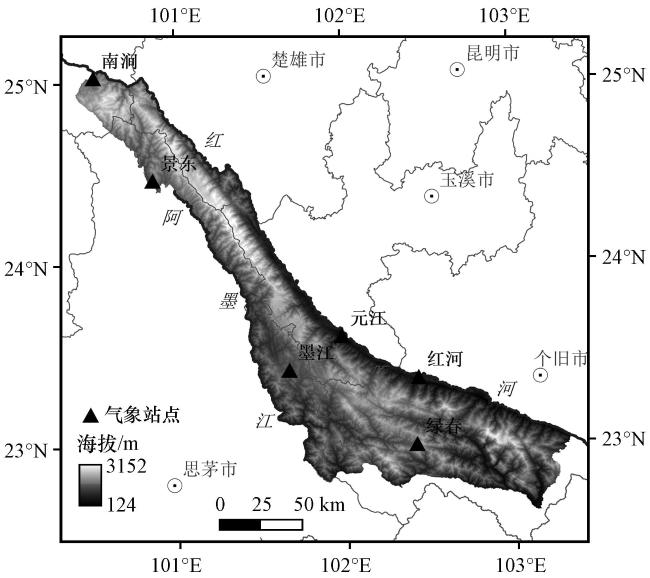
2.1 研究区概况
2.2 数据来源
2.3 研究方法
2.3.1 GWR降尺度
2.3.2 精度验证
2.3.3 趋势分析
2.3.4 线性拟合分析
3 结果分析
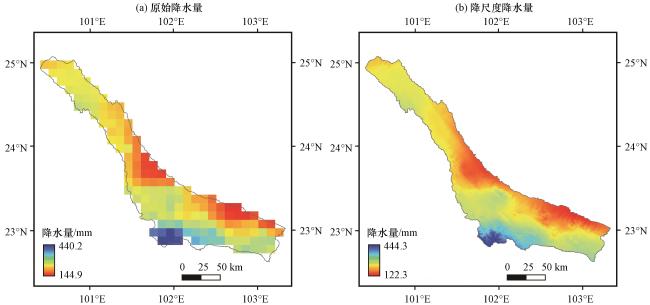
3.1 降水降尺度结果验证
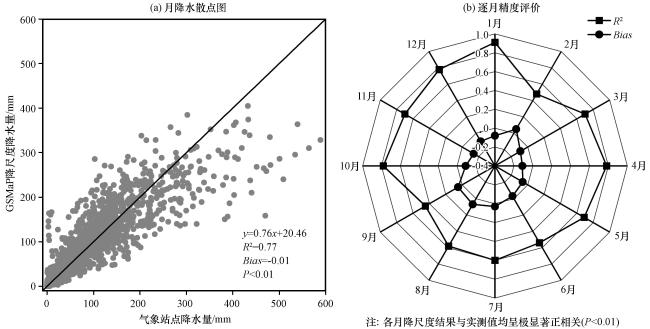
图2 降水降尺度精度评价结果(a)月降水散点分布, (b)逐月精度评价Fig.2 The accuracy validation results of downscaled precipitation data.(a) The scatter plot of downscaled and observed monthly precipitation, (b) The accuracy estimations of downscaled precipitation for every month |
3.2 哀牢山降水时空分布特征
3.2.1 哀牢山年降水空间分布特征
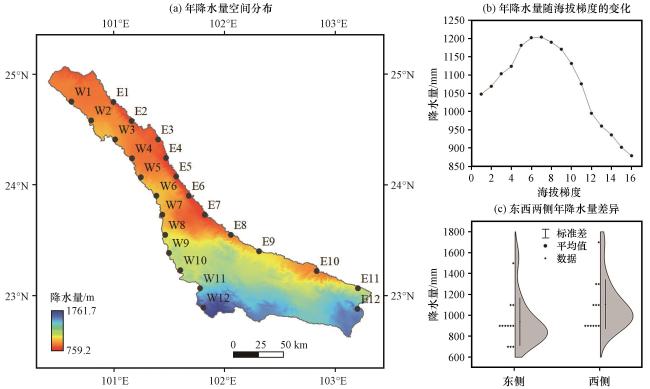
图4 哀牢山年降水量空间分布(a)及其随海拔梯度的变化(b)和东西差异(c)图(b)中海拔梯度为<200 m (1)、 200~400 m (2)、 400~600 m (3)、 600~800 m (4)、 800~1000 m (5)、 1000~1200 m (6)、 1200~1400 m (7)、 1400~1600 m (8)、 1600~1800 m (9)、 1800~2000 m (10)、 2000~2200 m (11)、 2200~2400 m (12)、 2400~2600 m (13)、 2600~2800 m (14)、 2800~3000 m (15)、 >3000 m (16)Fig.4 The spatial distribution (a), the changes along elevation grades (b), and the differences between the west and the east of average annual precipitation (c) in the Ailao Mountain Area.The elevation grades in Fig.4(b) are <200 m (1), 200~400 m (2), 400~600 m (3), 600~800 m (4), 800~1000 m (5), 1000~1200 m (6), 1200~1400 m (7), 1400~1600 m (8), 1600~1800 m (9), 1800~2000 m (10), 2000~2200 m (11), 2200~2400 m (12), 2400~2600 m (13), 2600~2800 m (14), 2800~3000 m (15), >3000 m (16), respectively |
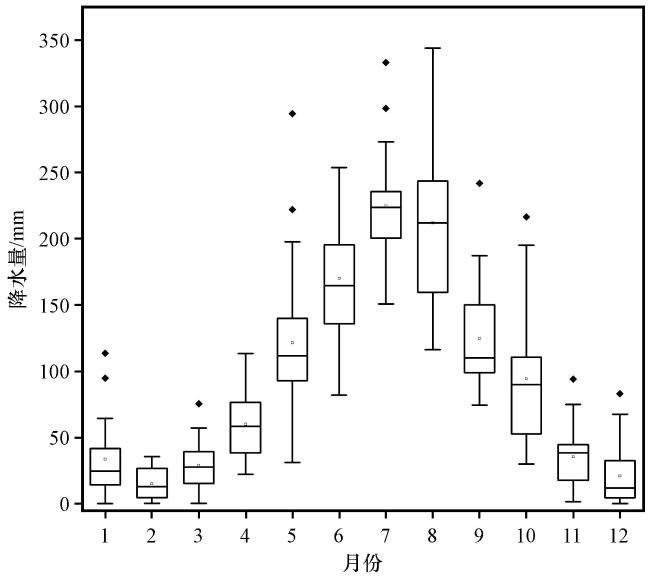
3.2.2 哀牢山月降水时空分布特征

3.3 哀牢山降水时空变化特征
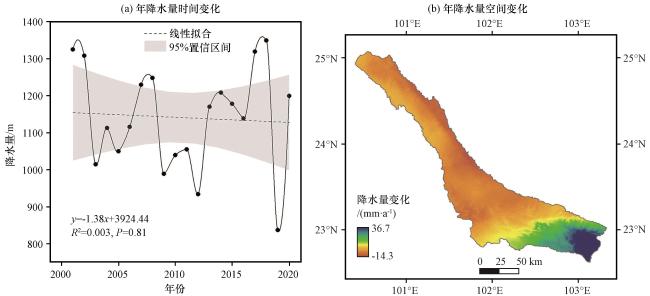
3.3.1 哀牢山年降水时空变化
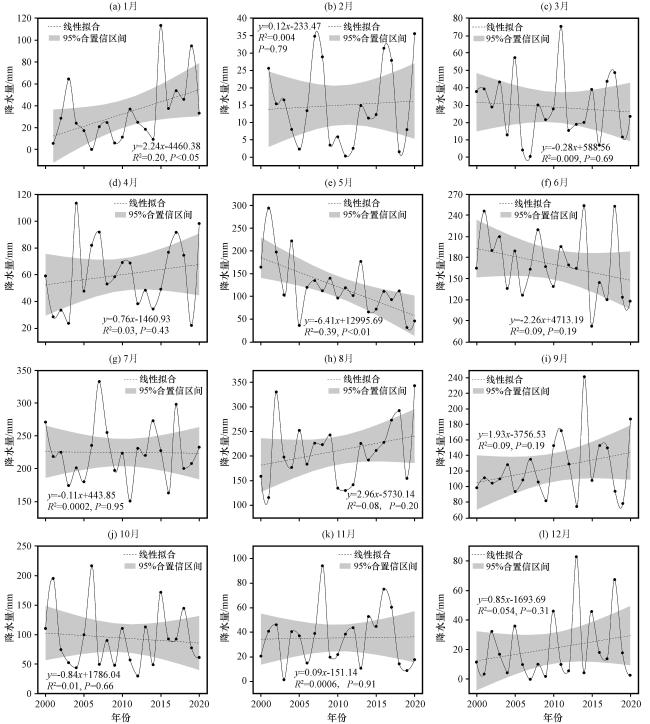
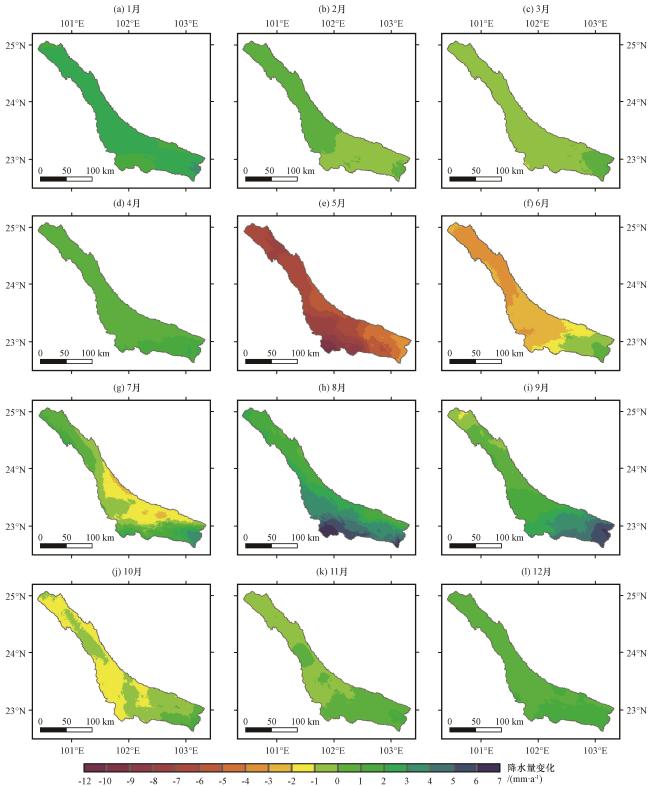
3.3.2 哀牢山月降水时空变化
4 讨论
4.1 GWR降水降尺度方法的有效性
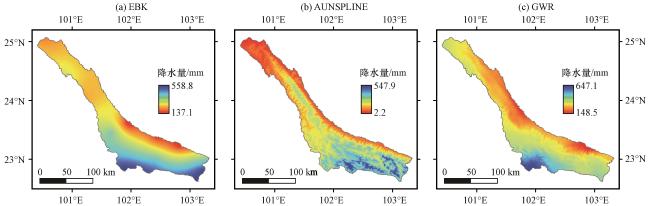
图10 不同插值方法降水量(单位: mm)结果对比图(以2020年8月的数据为例)Fig.10 The comparisons of precipitation results (unit: mm) by different interpolation methods: EBK (Empirical Bayesian Kriging) (a), AUNSPLINE method (b), and GWR downscaling method (c) in this study (taking data in August 2020 as an example) |
表1 2020年8月不同插值方法所得降水量与站点实测数据对比Table 1 The comparisons of precipitation by different interpolation methods and from stations, taking data in August 2020 as an example |
| 站点编号 | 站点数据/mm | EBK/mm | AUNSPLINE/mm | GWR/mm |
|---|---|---|---|---|
| 1 | 425.6 | 413.7 | 145.5 | 346.7 |
| 2 | 113.1 | 137.1 | 37.2 | 247.3 |
| 3 | 186.6 | 195.2 | 62.3 | 283.4 |
| 4 | 170.4 | 179.8 | 46.1 | 165.7 |
| 5 | 432.9 | 428.2 | 301.5 | 404.8 |