
1 引言
2 数据来源与方法介绍
2.1 数据来源
表1 32个CMIP6模式的主要信息Table 1 Main information of 32 CMIP6 models |
| 模式名称 | 所属国家(机构名称) | 水平分辨率(经纬网格数) | 模式名称 | 所属国家(机构名称) | 水平分辨率(经纬网格数) |
|---|---|---|---|---|---|
| ACCESS-CM2 | 澳大利亚(联邦科学与工业研究组织) | 360×300 | GFDL-CM4 | 美国(美国大气海洋局大气物理实验室) | 1440×1080 |
| ACCESS-ESM1-5 | 澳大利亚(联邦科学与工业研究组织) | 360×300 | GFDL-ESM4 | 美国(美国大气海洋局大气物理实验室) | 720×576 |
| AWI-ESM-1-1-LR | 德国(阿尔弗雷德韦格纳研究所) | 387×192 | IITM-ESM | 印度(印度马德拉斯理工学院) | 180×91 |
| CanESM5 | 加拿大(加拿大气候建模和分析中心) | 360×291 | INM-CM4-8 | 俄罗斯(俄罗斯科学院计算数学研究所) | 240×91 |
| CESM2 | 美国(美国国家大气研究中心) | 320×384 | IPSL-CM5A2-INCA | 法国(皮埃尔·西蒙·拉普拉斯研究所) | 182×149 |
| CESM2-FV2 | 美国(美国国家大气研究中心) | 320×384 | IPSL-CM6A-LR | 法国(皮埃尔·西蒙·拉普拉斯研究所) | 362×332 |
| CESM2-WACCM | 美国(美国国家大气研究中心) | 320×384 | IPSL-CM6A-LR-INCA | 法国(皮埃尔·西蒙·拉普拉斯研究所) | 362×332 |
| CESM2-WACCM-FV2 | 美国(美国国家大气研究中心) | 320×384 | KIOST-ESM | 韩国(韩国海洋科学技术研究所) | 360×200 |
| CMCC-CM2-HR4 | 意大利(欧洲-地中海气候变化中心) | 360×291 | MIROC6 | 日本(日本国立海洋研究开发机构等) | 360×256 |
| CMCC-CM2-SR5 | 意大利(欧洲-地中海气候变化中心) | 360×291 | MPI-ESM-1-2-HAM | 德国(德国马克斯·普朗克气象研究所) | 256×220 |
| CMCC-ESM2 | 意大利(欧洲-地中海气候变化中心) | 360×291 | MPI-ESM1-2-HR | 德国(德国马克斯·普朗克气象研究所) | 802×404 |
| EC-Earth3 | 欧洲(欧洲气候中心) | 362×292 | MPI-ESM1-2-LR | 德国(德国马克斯·普朗克气象研究所) | 256×220 |
| EC-Earth3-AerChem | 欧洲(欧洲气候中心) | 362×292 | MRI-ESM2-0 | 日本(日本气象研究所) | 360×363 |
| EC-Earth3-CC | 欧洲(欧洲气候中心) | 362×292 | NorESM2-LM | 挪威(挪威气象研究所和挪威大学等) | 360×384 |
| EC-Earth3-Veg | 欧洲(欧洲气候中心) | 362×292 | NorESM2-MM | 挪威(挪威气象研究所和挪威大学等) | 360×384 |
| EC-Earth3-Veg-LR | 欧洲(欧洲气候中心) | 362×292 | TaiESM1 | 中国(台湾环境变迁研究中心) | 320×384 |
2.2 方法介绍
3 历史时期北极近地面10 m风速的再分析与模式模拟情况
3.1 历史时期北极近地面10 m风速和模式分组结果分析
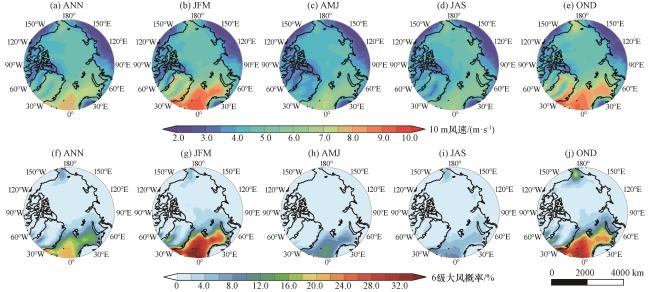
图1 NCEP资料所反映的1979 -2014年北极近地面10 m平均风速(a~e, 彩色区, 单位: m·s-1)和6级大风发生概率(f~j, 彩色区, 单位: %)(a、 f)为年(1 -12月, ANN)平均; (b、 g)为冬季(1 -3月, JFM)平均; (c、 h)为春季(4 -6月, AMJ)平均; (d、 i)为夏季(7 -9月, JAS)平均; (e、 j)为秋季(10 -12月, OND)平均 Fig.1 Spatial distribution of 10 m average wind speed near the surface in Arctic region (a~e, color area, unit: m·s-1) and 6-level gale probability (f~j, color area, unit: %) from 1979 to 2014 in reanalyze data.(a, f) is the annual (January-December, ANN) average, (b, g) is the winter (January-March, JFM) average, (c, h) is the spring (April-June, AMJ) average, (d, i) is the summer (July-September, JAS) average and (e, j) is the autumn (October-December, OND) average |
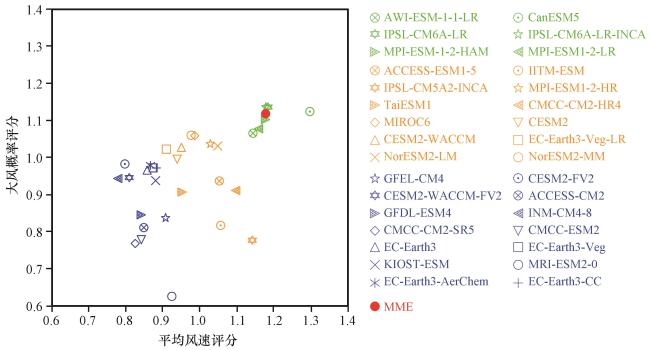
图2 CMIP6模式模拟1979 -2014年平均近地面10 m风速和6级大风概率的评分绿色、 橙色、 蓝色分别为优秀组、 中等组、 较差组模式; MME为所有模式的集合平均 Fig.2 Scoring chart of 1979 -2014 average near-surface wind speed of 10-meters and 6-level gale probability simulation ability of CMIP6 models.The green models are excellent group, the orange models are medium group, the blue models are poor group, and MME is the ensemble of all models |
表2 32个模式分组情况Table 2 Grouping situation of 32 models |
| 模式组别 | 模式名称 |
|---|---|
| 优秀组模式(Excellent) | AWI-ESM-1-1-LR、 CanESM5、 IPSL-CM6A-LR、 IPSL-CM6A-LR-INCA、 MPI-ESM-1-2-HAM、 MPI-ESM1-2-LR |
| 中等组模式(Middle) | ACCESS-ESM1-5、 IITM-ESM、 IPSL-CM5A2-INCA、 MPI-ESM1-2-HR、 TaiESM1、 CMCC-CM2-HR4、 MIROC6、 CESM2、 CESM2-WACCM、 EC-Earth3-Veg-LR、 NorESM2-LM、 NorESM2-MM |
| 较差组模式(Poor) | GFDL-CM4、 CESM2-FV2、 CESM2-WACCM-FV2、 ACCESS-CM2、 GFDL-ESM4、 INM-CM4-8、 CMCC-CM2-SR5、 CMCC-ESM2、 EC-Earth3、 EC-Earth3-Veg、 KIOST-ESM、 MRI-ESM2-0、 EC-Earth3-AerChem、 EC-Earth3-CC |
3.2 各组模式模拟历史时期北极近地面10 m风速的结果分析
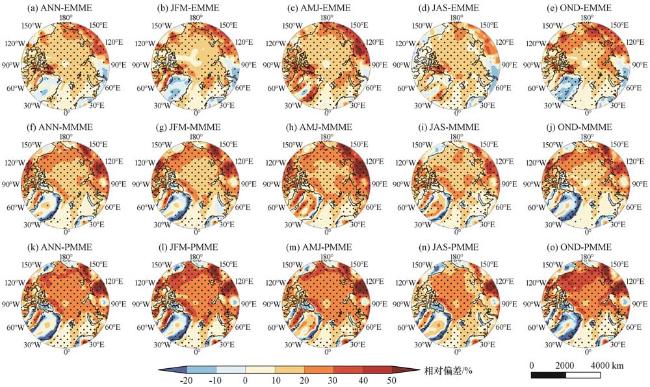
图3 优秀(a~e)、 中等(f~j)和较差组(k~o)模式模拟的1979 -2014年平均近地面10 m风速的相对偏差(单位: %)(a、 f、 k)为年(ANN)平均, (b、 g、 l)为冬季(JFM)平均, (c、 h、 m)为春季(AMJ)平均, (d、 i、 n)为夏季(JAS)平均, (e、 j、 o)为秋季(OND)平均; EMME、 MMME和PMME为优秀、 中等和较差组模式集合平均结果 Fig.3 Excellent (a~e), medium (f~j) and poor group (k~o) models’ simulation of the relative deviation of the average near-surface wind speed of 10 m from 1979 to 2014.Unit: %.(a, f, k) is the annual (ANN) average, (b, g, l) is the winter (JFM) average, (c, h, m) is the spring (AMJ) average, (d, i, n) is the summer (JAS) average and (e, j, o) is the autumn (OND) average.EMME, MMME and PMME are the average results of excellent, medium and poor group models |
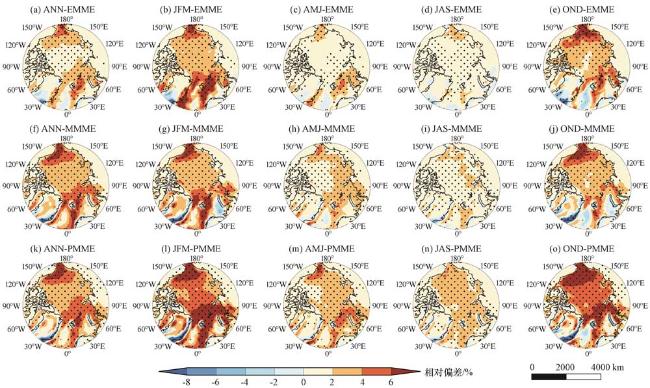
图4 优秀(a~e)、 中等(f~j)和较差组(k~o)模式模拟的1979 -2014年6级大风发生概率的相对偏差(单位: %)(a、 f、 k)为年(ANN)平均, (b、 g、 l)为冬季(JFM)平均, (c、 h、 m)为春季(AMJ)平均, (d、 i、 n)为夏季(JAS)平均, (e、 j、 o)为秋季(OND)平均; EMME、 MMME和PMME为优秀、 中等和较差组模式集合平均结果 Fig.4 Excellent (a~e), medium (f~j) and poor group (k~o) models’ simulation of the relative deviation of the occurrence probability of gale of magnitude 6 from 1979 to 2014.Unit: %.(a, f, k) is the annual (ANN) average, (b, g, l) is the winter (JFM) average, (c, h, m) is the spring (AMJ) average, (d, i, n) is the summer (JAS) average and (e, j, o) is the autumn (OND) average.EMME, MMME and PMME are the average results of excellent, medium and poor group models |
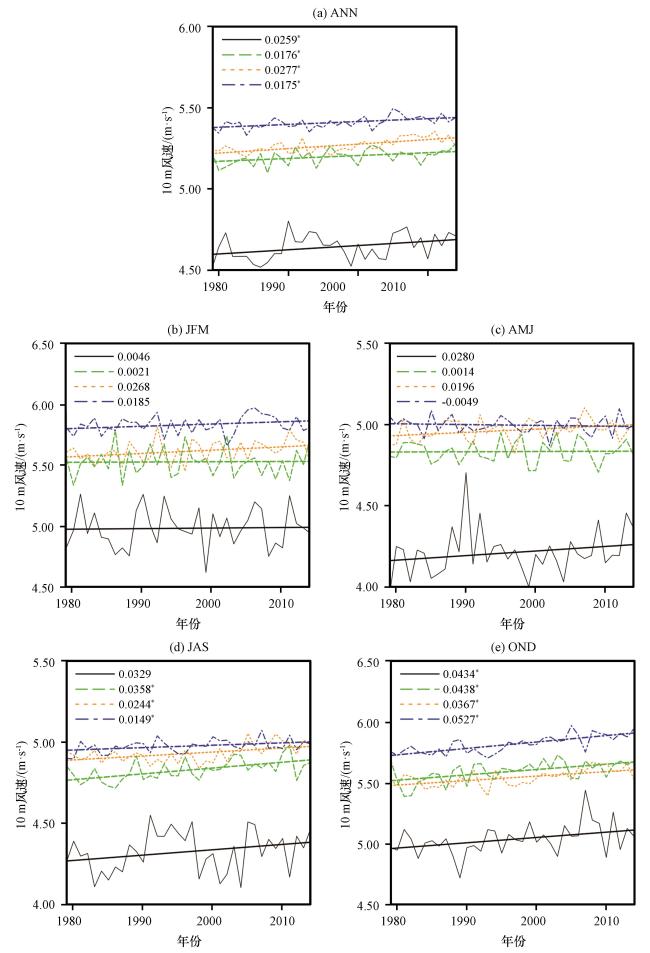
图5 1979 -2014年北极地区年平均(a)、 冬季(b)、 春季(c)、 夏季(d)、 秋季(e)平均的近地面10 m风速年变化和长期趋势[单位: m·s-1·(10a)-1]*表示通过了0.05显著水平的显著性检验; 黑色实线为NCEP再分析数据, 绿色、 橙色、 蓝色线条分别为优秀、 中等、 较差组模式模拟集合均值 Fig.5 The annual variation and long-term trend of wind speed near the surface of 10-meters in the Arctic region of the annual (a), winter (b), spring (c), summer (d) and autumn (e) average from 1979 to 2014, and the trend unit is m·s-1·(10a)-1.* indicating that the trend has passed the significance test of 0.05 significance level.The solid black line is NCEP reanalysis data, and the green, orange and blue lines are the ensemble values of excellent, medium and poor model simulation sets respectively |
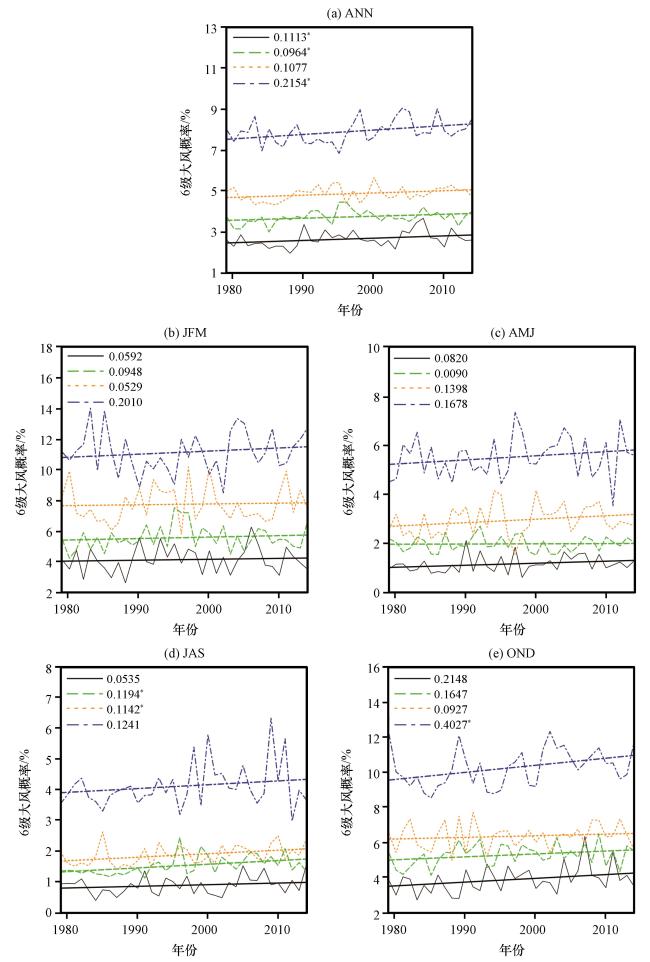
图6 1979 -2014年北极地区年平均(a)、 冬季(b)、 春季(c)、 夏季(d)、 秋季(e)平均的6级大风发生概率年变化和长期趋势[单位: %·(10a)-1]*表示通过了0.05显著水平的显著性检验; 黑色实线为NCEP再分析数据, 绿色、 橙色、 蓝色线条分别为优秀、 中等、 较差组模式模拟集合均值 Fig.6 The annual variation and long-term trend [unit: %·(10a)-1] of 6-level gale probability in the Arctic region of the annual (a), winter (b), spring (c), summer (d) and autumn (e) average from 1979 to 2014.* indicating that the trend has passed the significance test of 0.05 significance level.The solid black line is NCEP reanalysis data, and the green, orange and blue lines are the ensemble values of excellent, medium and poor model simulation sets respectively |
4 未来不同共享社会经济路径情景下北极近地面风速变化预估
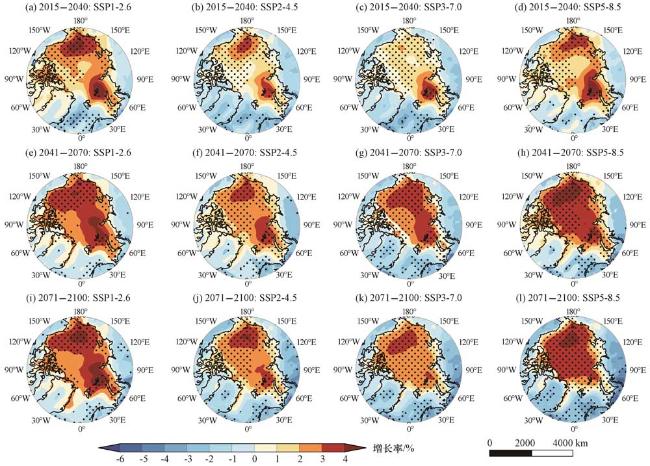
图7 优秀组模式模拟的21世纪不同未来共享社会经济路径情景相较于历史时期(1979 -2014年)近地面10 m平均风速增长率(单位: %)(a~d)为21世纪近期; (e~h)为中期; (i~l)为远期; 打点区域通过了95%的显著性检验; SSP1-2.6、 SSP2-4.5、 SSP3-7.0和SSP5-8.5为4个不同的排放情景 Fig.7 The average wind speed growth rate of 10-meters near the ground in different future sharing socio-economic paths in 21st century compared with the historical period (1979 -2014) under the simulation results of the excellent group model set.Unit: %.(a~d) is the near period of the 21st century, (e~h) is the middle period, (i~l) is the far period, dot area passed 95% significance test.SSP1-2.6, SSP2-4.5, SSP3-7.0 and SSP5-8.5 are four different emission scenarios |
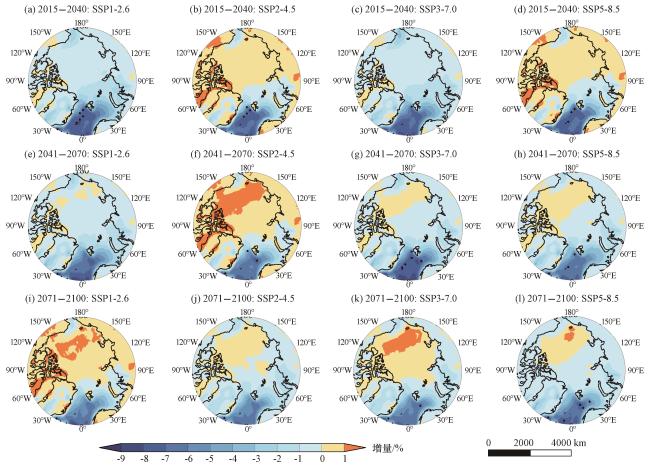
图8 优秀组模式模拟的21世纪不同未来共享社会经济路径情景相较于历史时期(1979 -2014年)的6级大风概率增量(单位: %)(a~d)为21世纪近期; (e~h)为中期; (i~l)为远期; 打点区域通过了95%的显著性检验; SSP1-2.6、 SSP2-4.5、 SSP3-7.0和SSP5-8.5为4个不同的排放情景 Fig.8 The probability increments of 6-level gale in different future sharing socio-economic paths in 21st century compared with the historical period (1979 -2014) under the simulation results of the excellent group model set.Unit: %.(a~d) is the near period of the 21st century, (e~h) is the middle period, (i~l) is the far period, dot area passed 95% significance test.SSP1-2.6, SSP2-4.5, SSP3-7.0 and SSP5-8.5 are four different emission scenarios |
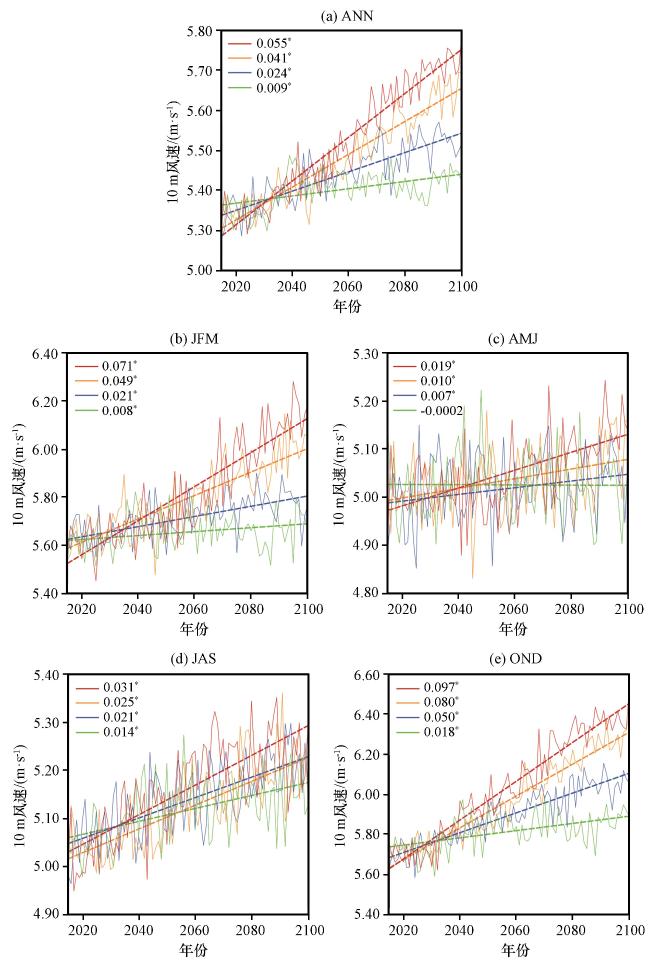
图9 2015 -2100年不同未来共享社会经济路径下北极区域平均的近地面10 m风速的年变化和长期趋势[单位: m·s-1·(10a)-1]*表示通过了0.05显著水平的显著性检验; (a)为年平均, (b)~(e)分别为冬、 春、 夏、 秋季的平均; 绿色、 蓝色、 橙色、 红色线条分别为SSP1-2.6、 SSP2-4.5、 SSP3-7.0和SSP5-8.5情景 Fig.9 The annual variation and long-term trend [unit: m·s-1·(10a)-1] of the average near-surface wind speed of 10 meters in the Arctic region under different future shared socio-economic paths in 2015 -2100.* indicating that the trend has passed the significance test of 0.05 significance level.In Fig.9, (a) is the annual average, and (b)~(e) are the average of winter, spring, summer and autumn respectively.The green, blue, orange and red lines are SSP1-2.6, SSP2-4.5, SSP3-7.0 and SSP5-8.5 respectively |
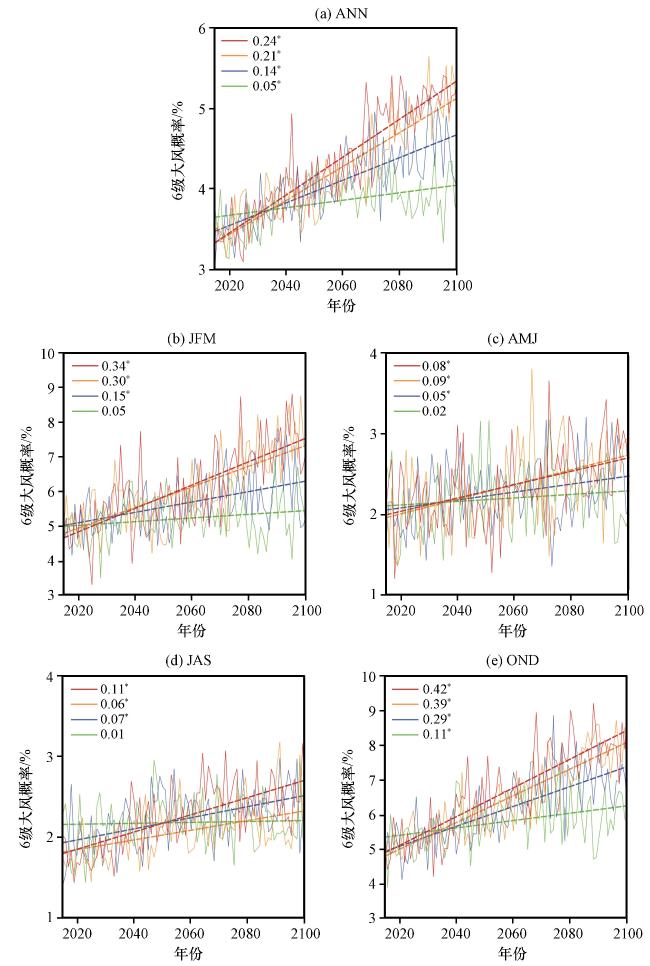
图10 2015 -2100年不同未来共享社会经济路径下北极区域平均的6级大风发生概率的年变化和长期趋势[单位: %·(10a)-1]*表示通过了0.05显著水平的显著性检验; (a)为年平均, (b)~(e)分别为冬、 春、 夏、 秋季的平均; 绿色、 蓝色、 橙色、 红色线条分别为SSP1-2.6、 SSP2-4.5、 SSP3-7.0和SSP5-8.5情景 Fig.10 The annual variation and long-term trend [unit: %·(10a)-1] of the average occurrence probability of 6-level gale in the Arctic region under different shared socio-economic paths in the future from 2015 to 2100.* Indicating that the trend has passed the significance test of 0.05 significance level.In Fig.9, (a) is the annual average, and (b)~(e) are the average of winter, spring, summer and autumn respectively.The green, blue, orange and red lines are SSP1-2.6, SSP2-4.5, SSP3-7.0 and SSP5-8.5, respectively |
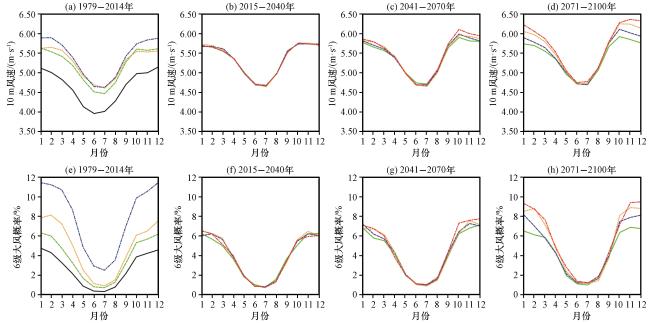
图11 北极区域平均的近地面10 m风速(a~d)和6级大风发生概率(e~h)季节变化(a、 e)为历史时期, 黑色实线为NCEP再分析数据, 绿色、 橙色、 蓝色线条分别为优秀、 中等、 较差组模式模拟集合均值; (b、 f)为21世纪近期; (c、 g)为中期; (d、 h)为远期。绿色、 蓝色、 橙色、 红色线条分别为SSP1-2.6、 SSP2-4.5、 SSP3-7.0和SSP5-8.5情景 Fig.11 Seasonal variation of the average 10-meters wind speed (a~d) and the average 6-level gale probability (e~h) in the Arctic region.(a, e) is historical period, the solid black line is NCEP reanalysis data, and the green, orange and blue lines are the ensemble values of the simulation sets of excellent, medium and poor groups respectively.(b, f) is the near period of 21st century, (c, g) is the middle period, and (d, h) is the far period, the green, blue, orange and red lines are SPS1-2.6, SSP2-4.5, SPS3-7.0 and SPS5-8.5 respectively |
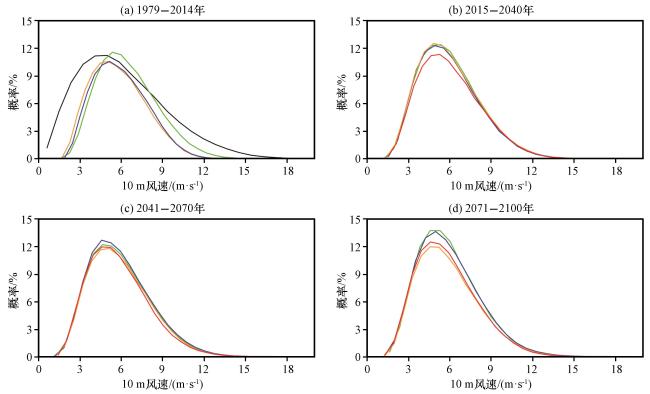
图12 代表点位(69.3°N, 16.1°E)的近地面10 m日风速的概率密度分布对比(a)为历史时期, 黑色实线为NCEP再分析数据, 绿色、 橙色、 蓝色线条分别为优秀、 中等、 较差组模式模拟集合均值; (b)为21世纪近期; (c)为中期; (d)为远期。绿色、 蓝色、 橙色、 红色线条分别为SSP1-2.6、 SSP2-4.5、 SSP3-7.0和SSP5-8.5情景 Fig.12 Comparison of probability density distribution of daily wind speed at 10m near the surface of representative point (69.3°N, 16.1°E).(a) is historical period, the solid black line is NCEP reanalysis data, and the green, orange and blue lines are the average values of the simulation sets of excellent, medium and poor groups respectively.(b) is the near period of 21st century, (c) is the middle period, and (d) is the far period, the green, blue, orange and red lines are SPS1-2.6, SSP2-4.5, SPS3-7.0 and SPS5-8.5 respectively |