
1 引言
2 资料来源与方法介绍
2.1 数据和站点介绍

2.2 数据预处理
表1 不同高度不同稳定条件的可用湍流数据数量Table 1 The number of available segments at different levels and under different stable conditions |
| 高度/m | 不稳定(-10<ζ<-0.05) | 中性(-0.05<ζ<0.05) | 稳定(0.05<ζ<10) |
|---|---|---|---|
| 20 | 221 | 50 | 201 |
| 38 | 195 | 12 | 131 |
| 56 | 146 | 3 | 104 |
2.3 方法介绍
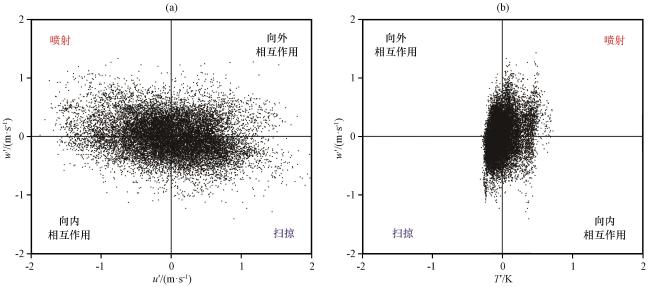
2.3.1 象限分析
2.3.2 传输效率
3 结果分析
3.1 喷射-扫掠运动特征
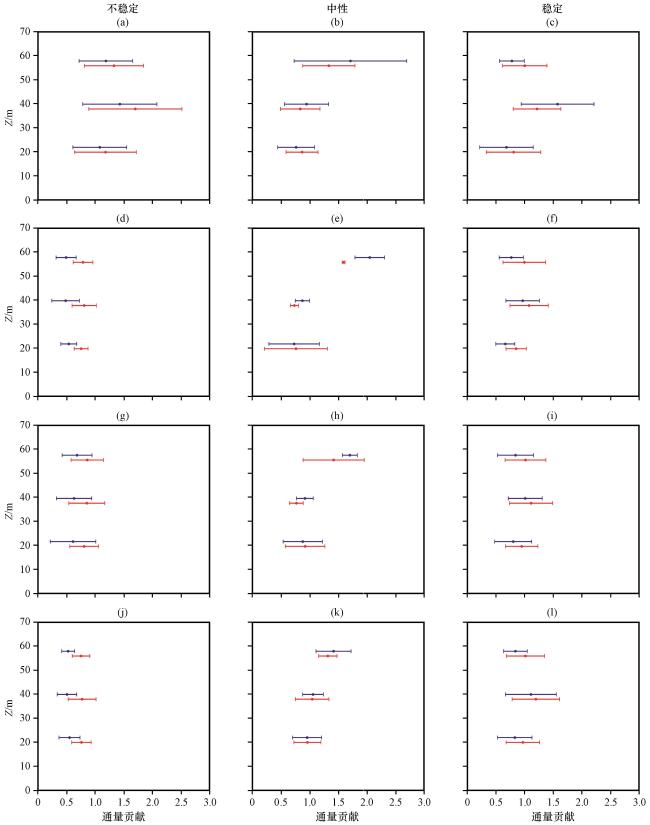
图3 三层高度(20 m、 38 m和56 m)处不同稳定条件下的动量通量(a~c)、 感热通量(d~f)、 潜热通量(g~i)和二氧化碳通量(j~l)的喷射(红点)和扫掠(蓝点)的通量贡献为了方便比较, 蓝点向上移动了2 m Fig.3 Flux contributions of ejection (red dots) and sweep (blue dots) of momentum flux (a~c), sensible heat flux (d~f), latent heat flux (g~i) and CO2 flux (j~l) under different stable conditions at three levels (20 m, 38 m and 56 m).For the convenience of comparison, the blue dots move upward by 2 meters |
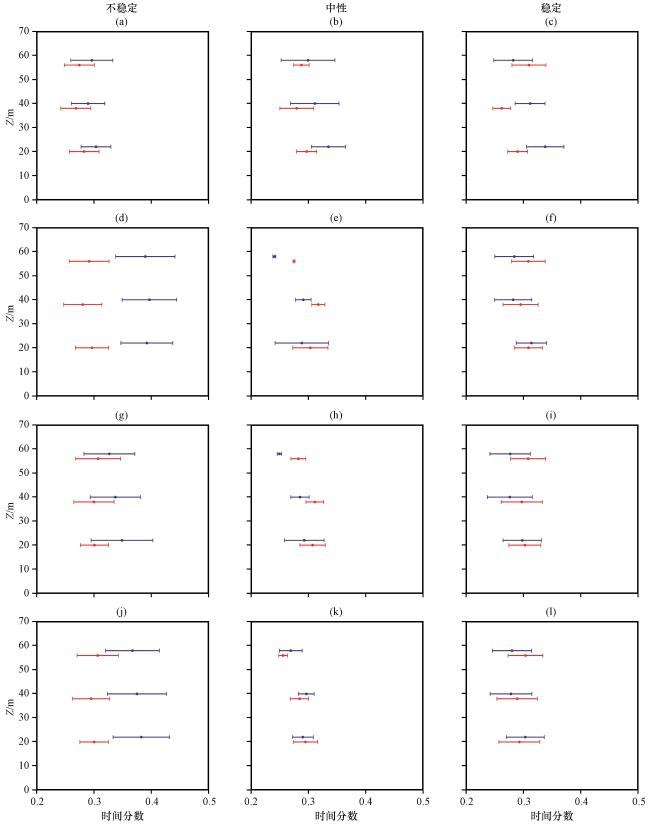
图4 三层高度(20 m、 38 m和56 m)处不同稳定条件下的动量通量(a~c)、 感热通量(d~f)、 潜热通量(g~i)和二氧化碳通量(j~l)的喷射(红点)和扫掠(蓝点)的时间分数为了方便比较, 蓝点向上移动了2 m Fig.4 Time fractions of ejection (red dots) and sweep (blue dots) of momentum flux (a~c), sensible heat flux (d~f), latent heat flux (g~i) and CO2 flux (j~l) under different stable conditions at three levels (20, 38 and 56 meters).For the convenience of comparison, the blue dots move upward by 2 meters |
3.2 喷射-扫掠运动的统计特征
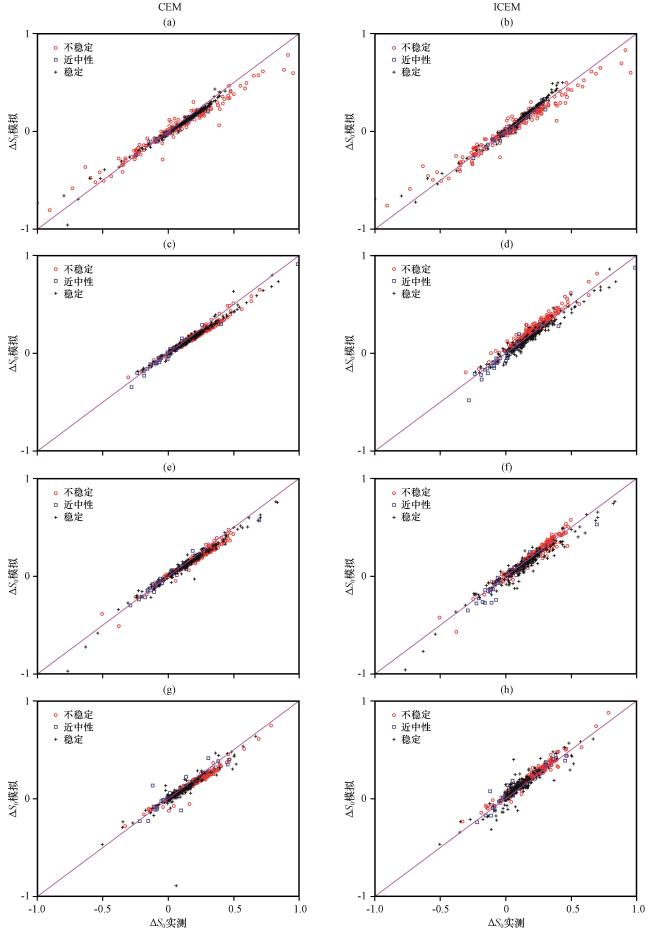
图5 20 m处的不同稳定条件下, 对动量通量(a~b)、 感热通量(c~d)、 潜热通量(e~-f)和二氧化碳通量(g~h)的喷射和扫掠的相对重要性进行测量和模拟Fig.5 Under different stable conditions at 20 meters, the relative importance of ejection and sweep of momentum flux (a~b), sensible heat flux (c~d), latent heat flux (e~f) and CO2 flux (g~h) was measured and modelled |
表2 CEM和ICEM模拟 的平均值, 模拟 平均值与观测 平均值的比率, 以及模拟 的均方根误差(RMSE)Table 2 The average value of CEM and ICEM modelled , the ratio between the average value of modelled and the average value of measured , and the root-mean-square error (RMSE) of the modelled |
| 参数 | 高度/m | 动量 | 热量 | 水汽 | CO2 | ||||
|---|---|---|---|---|---|---|---|---|---|
| CEM | ICEM | CEM | ICEM | CEM | ICEM | CEM | ICEM | ||
| |ΔS|平均值 | 20 | 0.18 | 0.2 | 0.19 | 0.21 | 0.18 | 0.2 | 0.15 | 0.19 |
| 38 | 0.3 | 0.29 | 0.25 | 0.31 | 0.22 | 0.24 | 0.22 | 0.28 | |
| 56 | 0.34 | 0.37 | 0.27 | 0.32 | 0.23 | 0.25 | 0.22 | 0.27 | |
| |ΔS|平均值比率 | 20 | 0.87 | 0.99 | 0.89 | 1.03 | 0.88 | 0.96 | 0.87 | 1.13 |
| 38 | 0.87 | 0.84 | 0.94 | 1.17 | 0.94 | 1.06 | 0.95 | 1.2 | |
| 56 | 0.94 | 1.01 | 0.96 | 1.15 | 0.97 | 1.03 | 1.02 | 1.26 | |
| |ΔS|均方根误差 | 20 | 0.13 | 0.13 | 0.1 | 0.05 | 0.04 | 0.05 | 0.07 | 0.06 |
| 38 | 0.11 | 0.12 | 0.04 | 0.1 | 0.05 | 0.08 | 0.07 | 0.1 | |
| 56 | 0.12 | 0.13 | 0.04 | 0.08 | 0.05 | 0.06 | 0.13 | 0.11 | |
3.3 动量和标量的湍流传输效率
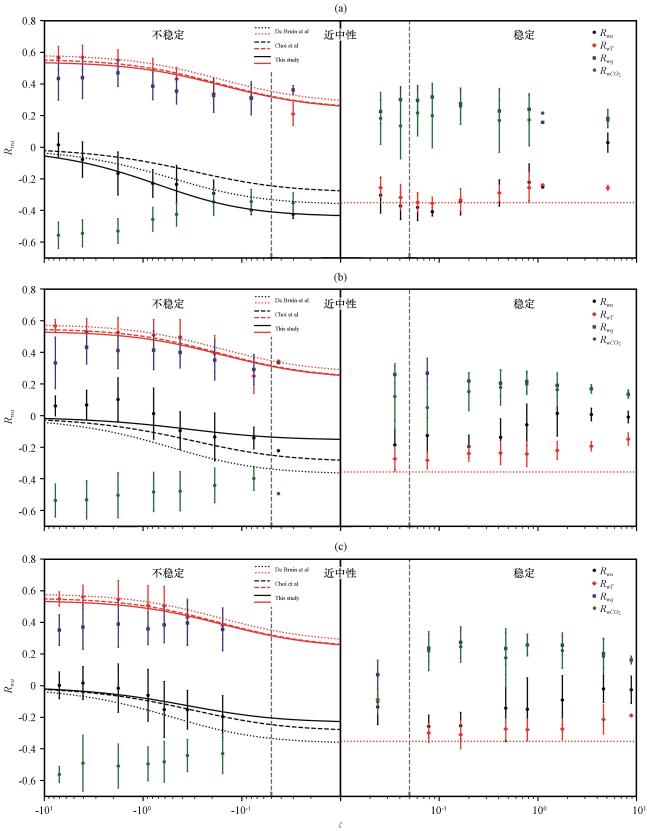
表3 传输效率的Monin Obukhov相似函数系数Table 3 Monin Obukhov similarity function coefficient of transmission efficiency |
| 系数 | De Bruin et al(1993) | Choi et al(2004) | 本研究 | ||
|---|---|---|---|---|---|
| 20 m | 38 m | 56 m | |||
| Cu 1 | 2.2 | 3.13 | 1.9 | 5.2 | 2.96 |
| Cu 2 | 3 | 8 | 1.5 | 5 | 6 |
| Cw 1 | 1.25 | 1.12 | 1.2 | 1.3 | 1.46 |
| Cw 2 | 3 | 2.8 | 3 | 4 | 3.1 |
| CT 1 | 2.9 | 3.7 | 3.5 | 3.5 | 3.5 |
| CT 2 | 28.4 | 34.5 | 35 | 35 | 35 |