
1 引言
2 研究区域与数据方法介绍
2.1 研究区域概况

2.2 数据情况
表1 四个高分辨率CMIP6模式基本信息Table 1 The basic information about four high resolution CMIP6 models |
| 模式名称 | 国家 | 研究机构 | 分辨率 |
|---|---|---|---|
| AWI-CM-1-1-MR | 德国 | AWI | ~0.94°×0.94° |
| EC-Earth3 | 欧洲联合 | AEMET | ~0.70°×0.70° |
| EC-Earth3-CC | 欧洲联合 | AEMET | ~0.70°×0.70° |
| MPI-ESM1-2-HR | 德国 | MPI | ~0.94°×0.94° |
EC-Earth3-CC模式没有提供SSP1-2.6和SSP3-7.0数据(The EC-Earth3-CC model does not provide data for SSP1-2.6 and SSP3-7.0) |
表2 CMIP6未来共享社会经济路径情景基本信息Table 2 The basic information about CMIP6 future shared socio-economic pathway scenario |
| 情景名称 | 情景类型 | 辐射强迫/(W•m-2)(至2100年) | 情景类型 |
|---|---|---|---|
| SSP1-2.6 | 低强迫情景 | 2.6 | 低辐射强迫、 低社会脆弱性和低减排压力的综合情景 |
| SSP2-4.5 | 中等 | 4.5 | 中等辐射强迫与中等社会脆弱性的综合情景 |
| SSP3-7.0 | 中等至高强迫情景 | 7.0 | 相对高的人为辐射强迫与高社会脆弱性的综合情景 |
| SSP5-8.5 | 高强迫情景 | 8.5 | 高的人为辐射强迫与高社会脆弱性的综合情景 |
2.3 研究方法
3 若尔盖生态区气温和降水模拟情况
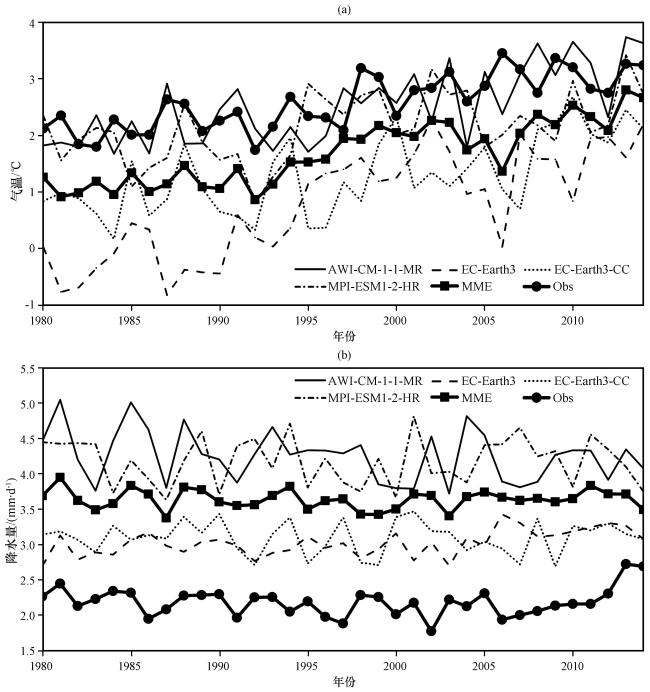
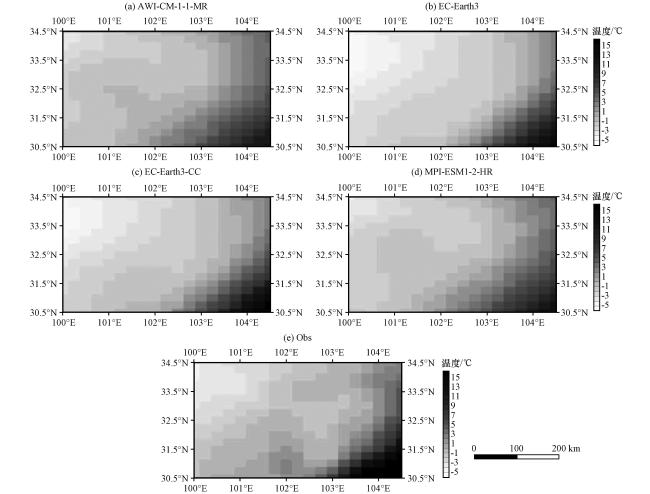
图3 若尔盖生态区1980 -2014年CMIP6模式AWI-CM-1-1-MR、 EC-Earth3、 EC-Earth3-CC和MPI-ESM1-2-HR, 与CN05.1观测数据(Obs)多年平均气温分布(单位: ℃)Fig.3 The multi-year average temperature distribution based on the CMIP6 models AWI-CM-1-1-MR, EC-Earth3, EC-Earth3-CC, and MPI-ESM1-2-HR compared with the CN05.1 observational data (Obs) in the Zoige ecological region during 1980 -2014.Unit: ℃ |
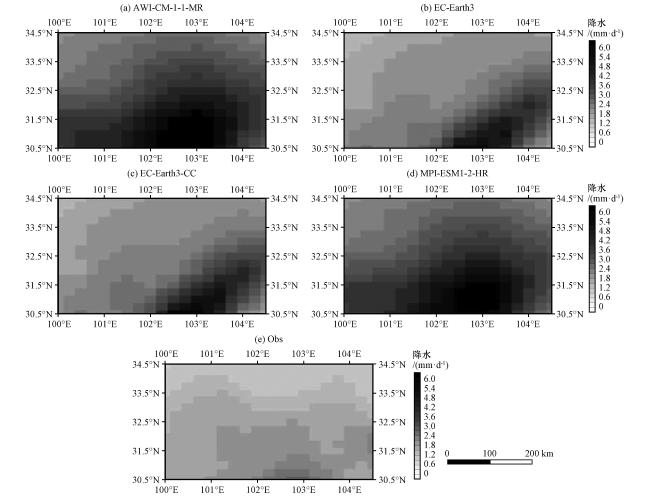
图4 若尔盖生态区1980 -2014年CMIP6模式AWI-CM-1-1-MR、 EC-Earth3、 EC-Earth3-CC和MPI-ESM1-2-HR, 与CN05.1观测数据(Obs)多年平均降水分布(单位: mm·d-1)Fig.4 The multi-year average precipitation distribution based on the CMIP6 models AWI-CM-1-1-MR, EC-Earth3, EC-Earth3-CC, and MPI-ESM1-2-HR compared with the CN05.1 observational data (Obs) in the Zoige ecological region during 1980 -2014.Unit: mm·d-1 |
表3 1980 -2014年若尔盖生态区CMIP6模式气温模拟结果与CN05.1观测资料统计关系Table 3 The statistical relationship between the temperature simulation results of CMIP6 models and the CN05.1 observational data in the Zoige ecological region during 1980 -2014 |
| 模式名称 | 时间相关系数 | 空间相关系数 | 均方根误差 | 模拟场与观测场标准差之比 |
|---|---|---|---|---|
| AWI-CM-1-1-MR | 0.80 | 0.95 | 1.54 | 0.76 |
| EC-Earth3 | 0.86 | 0.98 | 1.98 | 0.95 |
| EC-Earth3-CC | 0.71 | 0.98 | 1.51 | 0.96 |
| MPI-ESM1-2-HR | 0.68 | 0.95 | 1.53 | 0.81 |
表4 1980 -2014年若尔盖生态区CMIP6模式降水量模拟结果与CN05.1观测资料统计关系Table 4 The statistical relationship between the precipitation simulation results of CMIP6 models and the CN05.1 observational data in the Zoige ecological region during 1980 -2014 |
| 模式名称 | 时间相关系数 | 空间相关系数 | 均方根误差 | 模拟场与观测场标准差之比 |
|---|---|---|---|---|
| AWI-CM-1-1-MR | 0.62 | 0.85 | 2.19 | 2.66 |
| EC-Earth3 | 0.28 | 0.73 | 1.05 | 2.24 |
| EC-Earth3-CC | 0.41 | 0.74 | 1.12 | 2.31 |
| MPI-ESM1-2-HR | 0.50 | 0.85 | 2.11 | 2.59 |
4 若尔盖生态区未来不同情景气温和降水预估情况
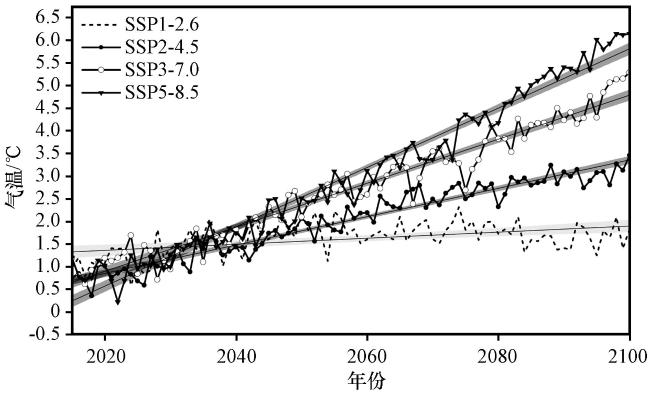
图5 对比于1980 -2014年历史时期, 2015 -2100年CMIP6高分辨率模式MME四种SSP情景下若尔盖生态区气温预估时间序列图细直线为变化趋势, 阴影区域为95%的置信区间 Fig.5 The temperature projection time series for the Zoige ecological region from 2015 to 2100 under MME of four SSP scenarios of CMIP6 high-resolution models, compared to the historical period of 1980 -2014.Thin lines represent the trend of change, and the shaded areas indicate the 95% confidence interval |
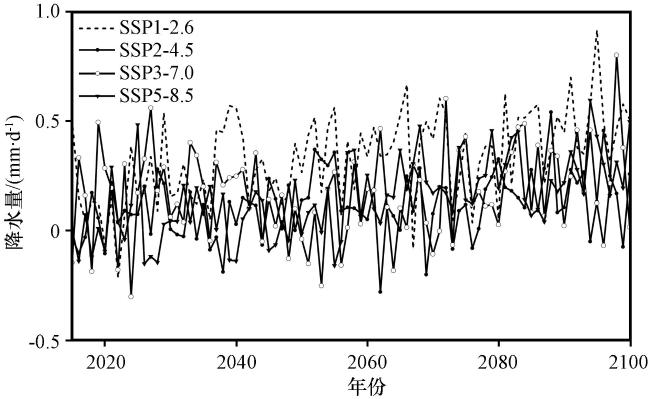
图6 对比于1980 -2014年历史时期, 2015 -2100年CMIP6高分辨率模式MME在四种SSP情景下若尔盖生态区降水预估时间序列图Fig.6 The precipitation projection time series for the Zoige ecological region from 2015 to 2100 under MME of four SSP scenarios of CMIP6 high-resolution models, compared to the historical period of 1980 -2014.Thin lines represent the trend of change, and the shaded areas indicate the 95% confidence interval |
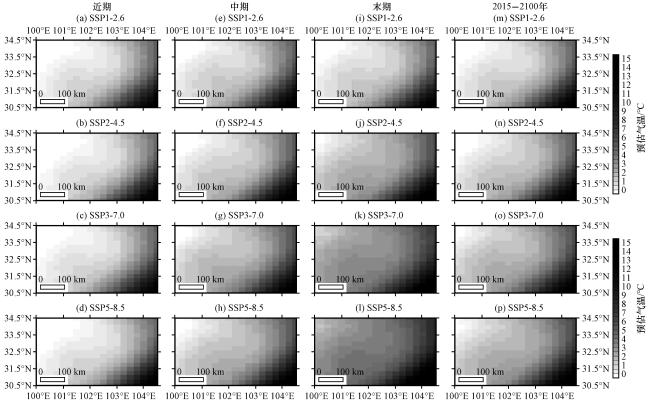
图7 若尔盖生态区四种情景SSP1-2.6、 SSP2-4.5、 SSP3-7.0和SSP5-8.5未来近期(2015 -2040年, 第一列)、 中期(2041 -2060年, 第二列)、 末期(2081 -2100年, 第三列)和整个时期(2015 -2100年, 第四列)CMIP6模式气温多模式平均预估结果空间分布(单位: ℃)Fig.7 Spatial distribution of multi-model average temperature projection of CMIP6 models under four scenarios-SSP1-2.6, SSP2-4.5, SSP3-7.0, and SSP5-8.5 for the near term (2015 -2040, first column), the middle term (2041 -2060, second column), the end term (2081 -2100, third column) and the entire period (2015 -2100, fourth column) in the Zoige ecological region.Unit: °C |
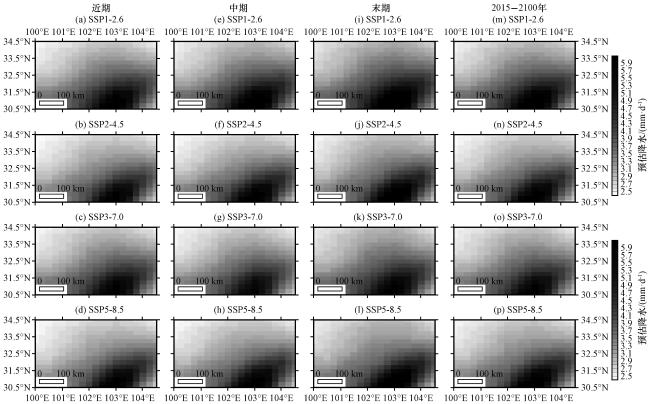
图8 若尔盖生态区四种情景SSP1-2.6、 SSP2-4.5、 SSP3-7.0和SSP5-8.5未来近期(2015 -2040年, 第一列)、 中期(2041 -2060年, 第二列)、 末期(2081 -2100年, 第三列)和整个时期(2015 -2100年, 第四列)CMIP6模式降水多模式平均预估结果空间分布(单位: mm·d-1)Fig.8 Spatial distribution of multi-model average precipitation projection of CMIP6 models under four scenarios-SSP1-2.6, SSP2-4.5, SSP3-7.0, and SSP5-8.5, for the near term (2015 -2040, first column), the middle term (2041 -2060, second column), the end term (2081 -2100, third column) and the entire period (2015 -2100, fourth column) in the Zoige ecological region (unit: mm·d-1) |
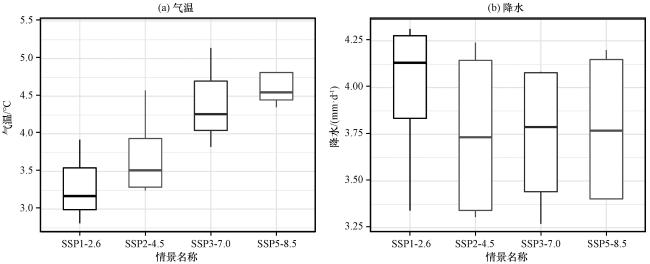
图9 若尔盖生态区2015 -2100年温度(单位: ℃)和降水(单位: mm·d-1)CMIP6多模式预估结果箱须图上、 中、 下的横线分别代表上四分位数, 中位数, 下四分位数; 上下线段分别为最大值和最小值 Fig.9 The boxplot of temperature (unit: °C) and precipitation (unit: mm·d⁻¹) based on CMIP6 models for the Zoige ecological region, where the upper, middle, and lower horizontal lines represent the upper quartile, median, and lower quartile, respectively; the upper and lower whiskers indicate the maximum and minimum values of the data |