
1 引言
中国冻土面积位居世界第三, 其中季节性冻土主要位于30°N以北, 约占全国国土面积的53.5% (郑丽萍等, 2022)。土壤冻融过程中的水热动态变化是地表水循环中的关键环节( Gu et al, 2005; Zhang et al, 2019), 它能够改变土壤水分运移规律, 导致特殊的水文过程, 对地表的水源涵养功能产生深远影响。在水资源管理、 农业发展以及人类社会活动中, 这一过程扮演着至关重要的角色, 如在土壤融化阶段, 深层冻结的土层会阻止水分入渗, 快速形成地表径流, 这部分水量是干旱半干旱地区宝贵的水资源, 对缓解春季干旱具有重要意义(Wang et al, 2017) 。此外冻融过程中土壤水分的频繁相变导致土壤释放和吸收相变潜热, 影响地表能量交换(Luo et al, 2016; Yang and He, 2019), 进而引起地表蒸散发的变化。因此, 明确土壤冻融过程中不同阶段的水量平衡特征对厘清高寒山区季节冻土的水文过程具有重要意义。
目前, 关于土壤冻融过程中水热动态变化特征的研究大多依赖于野外观测数据, 并采用描述性统计分析方法(黄葭悦等, 2023; 冉洪伍等, 2019; 戴黎聪等, 2020; 尚伦宇等, 2010; 于炜, 2011), 利用模型模拟的研究相对较少, 尤其在高寒地区, 受极端气候、 复杂地形、 观测不足等因素的限制, 传统的观测分析手段难以有效地再现高寒地区土壤冻融作用下水热要素变化引起的水量平衡过程。而野外长时序定位观测与基于物理过程的机理模型相结合的手段在该方面研究中具有明显优势。SHAW(Simultaneous Heat and Water)模型综合考虑了冻融期土壤水热物理传输过程, 目前已广泛应用于陆面能量通量和土壤水热模拟(郑丽萍等, 2022; 刘杨等, 2013; 郭林茂, 2020; 王驰等, 2017; 赵林等, 2008; 郭林茂等, 2020; 谢婷等, 2022)、 农田小气候要素和农田水量平衡模拟(陈军武, 2018; 肖薇等, 2005; Flerchinger and Saxton, 1989; Flerchinger et al, 1998)、 节水灌溉制度模拟(李瑞平等, 2010)、 土壤水分储量及通量模拟研究(张法伟等, 2023)以及积雪覆盖下的土壤热过程模拟(王子龙等, 2023)等, 但是利用SHAW模型模拟土壤冻融过程中水量平衡特征的研究仍相对有限。此外, 不同土壤冻融阶段的水量平衡特征差异明显, 且由于研究重点的不同, 不同研究中土壤冻融阶段的划分也有所差异, 如冉洪伍等(冉洪伍等, 2019)针对藏北高寒草地土壤冻融过程中水热变化特征进行分析时将土壤冻融过程划分为初冻期、 稳定冻结期、 消融前期和消融后期四个阶段, 戴黎聪等(2020)对青藏高原季节冻土区土壤冻融过程水热耦合特征分析时将土壤冻融过程划分为三个阶段: 冻结初期、 冻结稳定期和融化期。目前, 有关冻融阶段起始和终止的划分尚无统一标准, 如张弋等(张戈等, 2023)根据表层0.05 m土壤层的日最高温度和最低温度进行划分, 薛伟等(薛伟等, 2023)根据土壤冻融深度特征来进行冻融阶段的划分。
祁连山地处黄土高原和青藏高原的过渡带, 是河西走廊极为重要的水源产流地, 其出山口径流量几乎为流域水资源的总量(Chen et al, 2003), 而浅山区作为重要的组成部分, 其水资源量由于缺乏精确估算, 一直未纳入区域水资源评估体系。然而该区由于海拔落差较大, 相关的生态水文观测较少, 土壤水热动态与地表径流和深层渗漏的关系难以量化, 不同冻融阶段的水量平衡特征不明确, 导致对降水、 地表径流、 地下水等水文过程的认知不足, 进而限制了对该区水资源形成和转化机制的理解。
因此, 本研究基于祁连山浅山区典型小流域大口子沟垭口观测点2019年8月至2023年3月的观测数据, 利用SHAW模型准确模拟该区土壤水热动态变化的基础上, 依据土壤温度将土壤冻融过程划分为冻结发展期、 完全冻结期、 融化发展期和完全融化期, 分析不同冻融阶段的水量平衡特征, 为祁连山地区水资源形成和转化提供数据支持和理论依据。
2 数据来源与方法介绍
2.1 站点介绍
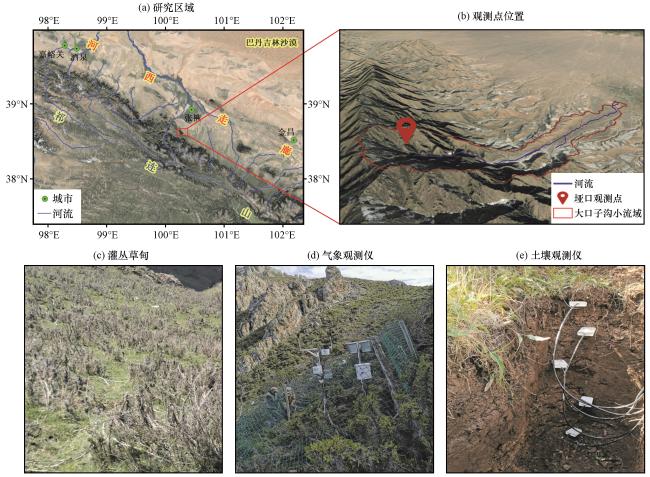
研究区位于甘肃省张掖市甘州区花寨乡大口子沟小流域, 地理位置介于38°36′38.27″N -38°39′15.11″N, 100°15′22.43″E -100°19′39.63″E之间。该小流域地形呈狭长沟壑型, 西南-东北走向, 总面积约为6.59 km2, 长约7.2 km, 最宽处约1.4 km, 海拔范围2109~3558 m, 海拔高差达到1450 m, 地形坡度6°~60°, 日平均气温为-0.97 ℃。区域内的气候类型自低海拔至高海拔依次为山地草原气候带、 山地森林草原气候带及亚高山灌丛草甸气候带, 海拔范围分别为2109~2500 m、 2500~3400 m、 3400~3560 m。该区冰川不发育, 有季节性冻土分布, 是典型的祁连山浅山区小流域。
2.2 数据来源和仪器介绍
本研究的气象与土壤温湿度数据源于大口子沟垭口观测点(图1), 该观测点海拔为3450 m, 坡度约58°, 土壤类型为山地灰褐土, 植被类型为灌丛草甸, 年均气温为-1.46 ℃, 年均降水量为346.56 mm。气象数据采用HOBO U30自动气象站进行观测, 观测的气象要素包括: 降水、 气温、 太阳总辐射、 光合有效辐射、 相对湿度、 风速风向、 大气压、 表层土壤温湿度、 露点温度, 观测间隔时间为30 min。土壤温湿度数据则采用Campbell CS655土壤温湿度传感器进行观测, 本文中土壤湿度是指土壤中液态水的体积含水量, 观测间隔时间为60 min, 传感器分5层布设, 深度分别为0.15 m、 0.25 m、 0.55 m、 0.85 m和1.00 m。
2.3 研究方法
2.3.1 模型介绍与设置
SHAW 模型为Flerchinger和Saxton于1989年开发的一维水热耦合模型(Flerchinger et al, 2012), 是模拟融雪和土壤冻融中最详细的模型之一, 该模型综合考虑了冻融期土壤水热物理传输过程, 对冻融过程不同阶段的土壤水热动态模拟结果更接近于实际观测(阳勇等, 2013)。SHAW模型中计算土壤水热的主要控制方程如公式(1 )~(3 )所示, 其中考虑冻土层液体对流换热和蒸汽潜热下的土壤基质中温度分布状态方程为:
式中: 为融化潜热(单位: J·kg-1); 为汽化潜热(单位: J·kg-1) 和T为体积热容(单位: J·kg-1·℃-1)和土壤温度(单位: ℃); 为冰的密度(单位: kg· m-3); 为体积含冰量(单位: m3·m-3) 为土壤导热系数(单位: W·m-1·℃-1); 为水的密度; 为水的比热容(单位: J·kg-1·℃-1) 为液态水通量(单位: m·s-1); 为水蒸气通量(单位: kg·m-2·s-1); 为水蒸气密度(单位: kg·m-3)。
考虑冻融条件下的土壤水通量方程为:
式中: K为不饱和水力传导系数(单位: m·s-1); 是土壤水势(单位: m); U是水通量的源汇项(单位: m3·m-3·s-1)。其中 的计算公式如下:
式中: 为空气进入势(单位: m); b为孔径分布指数; θs 为饱和体积含水量(单位: m3·m-3)。
模型输入的气象驱动数据包括最高温度(单位: ℃)、 最低温度(单位: ℃)、 露点温度(单位: ℃)、 平均风速(单位: m·s-1)、 日降水量(单位: mm)、 平均日太阳辐射(单位: W·m-2)。土壤下边界温湿度的初始分布均采用实测值, 各层土壤的容重和颗粒组成采用实测值, 饱和导水率、 空气进入势 、 饱和含水率和孔径分布指数b依据土壤的容重、 颗粒组成等特征和文献资料设定初始值(郭林茂等, 2020; 阳勇等, 2013; 郭东林和杨梅学, 2010; 陈瑞等, 2020), 然后根据SHAW模型土壤水热的拟合值与观测值的接近程度进行参数优化。通过调整各层土壤参数使模拟值与观测值达到最大程度的契合, 最终参数见表1。
表1 SHAW模型中各层土壤参数Table 1 Soil parameters for different layers in SHAW model |
| 土壤深度 /m | 砂粒含量 /% | 粉粒含量 /% | 粘粒含量 /% | 容重 /(kg·m-3) | 饱和导水率 /(cm·h-1) | 空气进入势 /m | 饱和含水率 /(m3·m-3) | 孔径分布 指数 |
|---|---|---|---|---|---|---|---|---|
| 0.15 | 30.33 | 65.02 | 5.64 | 1025.6 | 2.0 | -0.18 | 0.88 | 3.3 |
| 0.25 | 30.06 | 65.06 | 5.88 | 1027.1 | 2.0 | -0.18 | 0.83 | 4.2 |
| 0.55 | 30.28 | 65.13 | 5.58 | 1000.3 | 2.0 | -0.19 | 0.85 | 3.5 |
| 0.85 | 30.52 | 66.00 | 5.49 | 1141.2 | 2.4 | -0.08 | 0.89 | 5.2 |
| 1.00 | 30.70 | 65.11 | 5.19 | 1122.6 | 3.0 | -0.08 | 0.76 | 5.0 |
2.3.2 模拟结果评价指标
本研究中采用Pearson相关系数R、 纳什效率系数NSE、 均方根误差RMSE对 SHAW 模型的模拟效果进行评价, 计算公式如下:
式中: N为观测天数; Ei 和Mi 为分别为第 天的模拟值和观测值; 为观测值的平均值。相关系数R和纳什效率系数NSE越接近于1, 均方根误差RMSE越接近于0, 模拟效果越好。
3 结果
3.1 气象因子变化特征
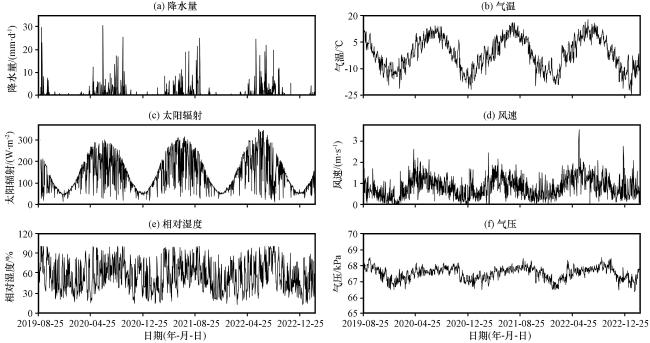
图2展示了降水量、 气温、 太阳辐射、 风速、 相对湿度、 气压等气象因子的日变化过程, 如图2(a)所示, 降水量的年内变化表现为“峰型”趋势, 整体波动较大, 年总降水量平均值为346.56 mm, 主要集中在5 -10月, 占总降水量的 91.03%, 最大日降水量达到30.4 mm。2019 -2023年气温变化趋势如图2(b)所示, 整体来看, 年内气温呈先增加后减小的趋势, 从1月开始气温持续升高, 到7月达到最大值, 7月以后开始下降, 下降幅度与升高幅度相差不大, 最低温为-24.24 ℃, 最高温为17.73 ℃, 年平均产气温为-1.46 ℃。图2(c)展示了日太阳辐射的年内变化, 整体变化趋势为1 -7月增加, 7 -12月逐渐减小。特别地, 在10月至次年3月期间, 日太阳辐射波动较小, 而在4 -9月波动较大。日风速的年内变化[图2(d)]呈现增加-减少-增加的趋势, 4 -6月风速较大, 日风速最大达到3.52 m·s-1, 11 -12月份风速较小。由图2(e)可以看出, 相对湿度年内波动较大, 最大值为100%, 最小值为13.41%。图2(f)揭示了气压的年内变化, 整体上在67 kPa上下浮动, 呈现先减小后增加再减小的特征。
3.2 土壤水热模拟结果评价
土壤冻融过程的实质是由于土壤温度变化所引起的土壤水分发生相变(陈瑞等, 2020), 从而改变土壤水分运动参数和土壤水势, 进而影响土壤水分运动, 因此选择土壤温湿度来验证SHAW模型模拟土壤冻融过程水量平衡特征的准确性。0.15~0.85 m土壤温度的模拟值与实测值对比结果表明(图3), 不同深度土壤温度的模拟值与实测值动态过程趋同, 拟合效果良好, 模拟值能很好地反映不同深度土壤剖面温度的动态变化过程, 不同深度土壤温度模拟值与实测值之间的相关系数R≥0.97, 纳什效率系数NSE≥0.88, 均方根误差RMSE≤1.89 ℃(表2)。从表2不同深度土壤温度模拟效果评价结果来看, 深层土壤(0.55~0.85 m)的模拟效果较上层土壤(0.15~0.25 m)更好, 造成这种差异的主要原因可能是气温对土壤温度的控制作用随着土壤深度的增加而减弱以及表层植被覆盖度等外界环境的变化, 导致表层土壤温度模拟结果具有更大的不确定性。值得注意的是0.15~0.85 m深度范围内, 冬季和春季的土壤温度模拟值略低于实测值, 夏季土壤温度的模拟值略高于实测值, 这一现象可能由几个因素引起, 首先, SHAW模型在模拟夏季土壤含水量的随机性变化时存在一定的局限性, 土壤含水量的波动会直接影响土壤比热容的动态变化, 当水分模拟值小于实测值时土壤比热容模拟较小, 导致土壤温度模拟值偏高(李乃玉等, 2024; 张乐乐等, 2016), 另一原因是模型中降雪温度的设置偏高, 导致冬季和春季模拟的积雪层厚度偏小, 减弱了积雪层对土壤的保温作用(王子龙等, 2023), 导致冬季和春季的土壤温度模拟值低于实测值。
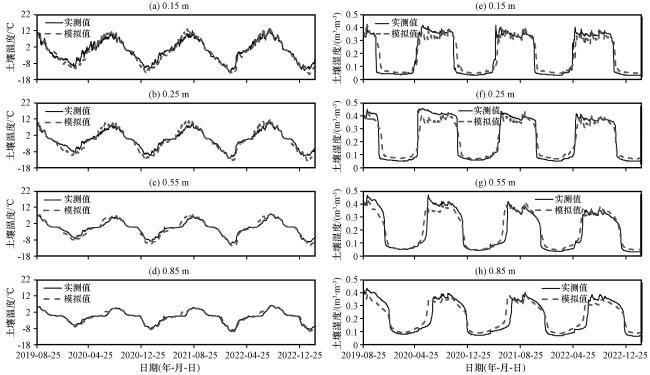
图3 大口子沟垭口观测点2019 -2023年不同深度土壤温度(a~d)、 土壤湿度(e~h)模拟值与实测值比较Fig.3 Comparison of simulated and measured soil temperature (a~d) and moisture (e~h) at different depths in the Dakouzi from 2019 to 2023 |
表2 大口子沟垭口观测点2019 -2023年不同深度土壤温湿度模拟效果评价Table 2 Assessment of soil temperature and moisture simulation performance at different depths in the Dakouzi during 2019 -2023 |
| 气象因子 | 土层深度/m | R | NSE | RMSE/℃ |
|---|---|---|---|---|
| 土壤 温度 | 0.15 | 0.97 | 0.92 | 1.88 |
| 0.25 | 0.98 | 0.88 | 1.89 | |
| 0.55 | 0.98 | 0.90 | 1.37 | |
| 0.85 | 0.98 | 0.96 | 0.78 | |
| 土层深度/m | R | NSE | RMSE/(m3·m-3) | |
| 土壤 湿度 | 0.15 | 0.94 | 0.88 | 0.05 |
| 0.25 | 0.97 | 0.92 | 0.05 | |
| 0.55 | 0.96 | 0.90 | 0.05 | |
| 0.85 | 0.94 | 0.93 | 0.05 |
不同深度土壤湿度模拟值与实测值的对比结果如图3所示, 不同深度土壤湿度的模拟值均与实测值动态变化基本一致, 模拟值能够反映不同深度土壤剖面湿度的动态变化过程。土壤湿度的模拟效果评价结果显示总体模拟效果较好, 不同深度土壤湿度模拟值与实测值之间的相关系数R≥0.94, 纳什效率系数NSE≥0.88, 均方根误差RMSE≤0.05 m3·m-3(表2)。从不同深度的模拟结果来看, 中下层土壤(0.25~0.85 m)湿度模拟效果优于表层土壤(0.15 m), 尤其在夏秋季表现明显, 原因是夏秋季降水和蒸散发强烈, 表层土壤在降水和蒸散发共同作用下波动更加剧烈。此外, 表层土壤结构和孔隙的分布受植被根系的影响较大, 而在模型参数设定中对应特定层土壤采用均一化处理, 使得土壤水分的随机性变化无法体现。综合各深度土壤湿度模拟的动态变化特征及评价参数来看, SHAW模型对于土壤湿度模拟精度依然较高, 即SHAW模型总体上能很好地体现不同深度土壤湿度动态变化规律。
3.3 土壤冻融过程水量平衡模拟结果
3.3.1 土壤冻融过程水热特征
本文假定当表层土壤温度降至0 ℃以下时, 土壤开始冻结, 当所有土层温度全部降至0 ℃以下时土壤进入完全冻结期。相应地, 当表层土壤温度回升至0 ℃以上时, 土壤开始融化, 标志着完全冻结期结束, 开始进入融化发展期。当所有土层温度均达到0 ℃以上进入完全融化期。图4统计结果显示, 2019 -2023年表层土壤开始冻结的日期分别是2019年11月10日、 2020年11月3日、 2021年11月4 日, 冻结发展时长分别为64天、 57天、 55天, 平均时长为59天; 土壤层完全冻结的日期分别为2020年1月13日、 2020年12月30日、 2021年12月29日, 持续时长分别为111天、 131天、 129天, 平均时长为124天; 表层土壤开始融化的日期分别为2020年5月3日、 2021年5月10日、 2022年5月7日, 融化发展期时长分别为65天、 61天、 68天, 平均时长65天; 土壤层完全融化的日期分别为2020年7月7日、 2021年7月10日、 2022年7月14日, 时长分别为119天、 117天、 115天, 平均时长为117天。统计结果表明灌丛草甸土壤冻融过程具有显著的季节性特征, 其中完全冻结期持续时间最长, 冻结发展期持续时间最短。
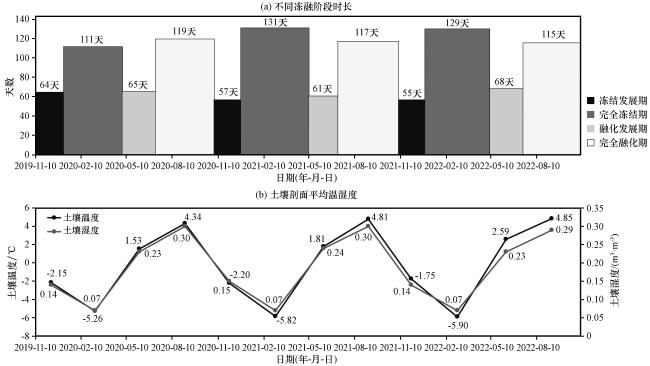
2019 -2023年0~1.00 m土壤剖面温度动态变化特征如图5(a)所示, 其中红线表示0 ℃等温线, 其出现与消失的时间分别表示冻结发展期和融化发展期的开始与结束。由图5(a)可以看出, 土壤冻融过程中各层土壤温度经历了降温-升温-降温循环, 并且降温和升温均是从表层向深层发展, 表明土壤冻融过程呈现出单向冻结单向融化的特征。在3次土壤冻融过程中, 随土壤深度的增加土壤温度变化的速度逐渐减小, 深层土壤温度变化更加稳定。在完全冻结期, 土壤温度随深度增加而上升, 在完全融化期, 土壤温度随深度的增加逐渐降低, 土壤温度的最高值与最低值均出现在土壤表层。完全融化期的等温线较完全冻结期密集, 表明完全融化期的土壤温度波动更大, 而完全冻结期土壤温度相对稳定。图4的统计数据进一步证实了融化发展期和完全融化期的土壤剖面平均温度显著高于冻结发展期和完全冻结期, 同时指出完全冻结期土壤剖面平均温度从2019 -2023年逐渐降低, 而完全融化期土壤剖面平均温度从2019 -2023年逐渐升高。
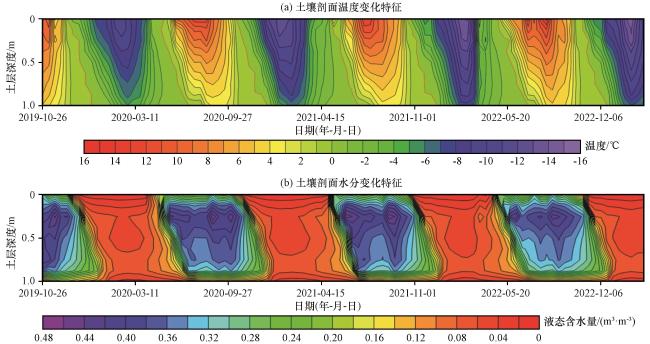
根据2019 -2023年0~1.00 m土壤剖面液态含水量变化特征[图5(b)]可以看出, 在整个冻融过程中, 融化发展期和完全融化期的土壤液态含水量明显高于冻结发展期和完全冻结期。根据图5可知土壤温度从2 ℃开始降温时, 土壤中液态含水量急剧减少, 土壤温度从-2 ℃开始升温时, 液态含水量迅速增加。液态含水量最大值出现在融化发展期和完全融化期0.2~0.25 m土壤层中, 因为土壤层完全融化以后, 地表降水下渗进入土壤, 表层土壤水分由于蒸散发而减少, 深层土壤水分由于深层渗漏而减少, 0.2~0.25 m土壤层由于灌丛草甸根系的吸水能力使得土壤水分集中。结合图4可知, 完全融化期的液态含水量明显高于其他时期, 完全冻结期的液态含水量最小, 2019 -2023年不同冻融阶段同时期的土壤液态含水量基本一致, 年际变化不大。
3.3.2 土壤冻融过程水量平衡特征
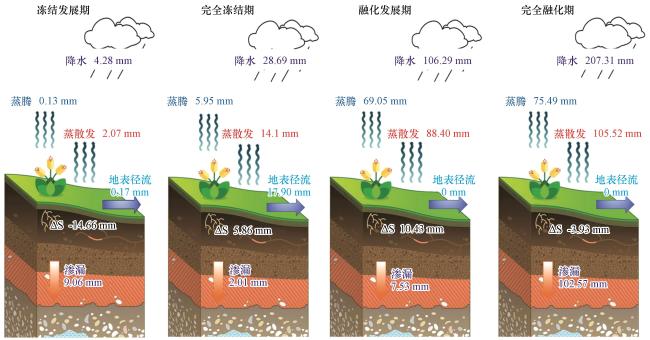
为了探究不同冻融阶段灌丛草甸土壤的水量平衡差异, 将三次冻融过程不同阶段的水量平衡数据平均化处理, 得到冻融过程中不同阶段水量平衡主要要素如图6所示, 图中Δs表示土壤液态含水量变化, Δs为正表示这一时期的土壤水分增加, Δs为负表示这一时期的土壤水分减少。灌丛草甸土壤年均总降水量为346.57 mm, 年均蒸散发为210.09 mm, 其中年均植被蒸腾为150.62 mm, 年均深层渗漏为121.17 mm, 地表径流为18.07 mm。进一步分析显示灌丛草甸土壤年均蒸散发占总降水的60.62%, 深层渗漏占34.96%, 地表径流占5.21%, 对比各支出量占降水量比例可知灌丛草甸土壤中蒸散发是水分支出的主要途径, 其次为深层渗漏, 而地表径流的支出相对较小。
如图6所示, 灌丛草甸土壤冻结发展期的降水量仅4.28 mm, 占年总降水量的1.23%。土壤从表层向深层冻结过程中, 早期冻结的表层土壤阻碍了表层土壤蒸散发, 因此仅有2.07 mm的水分通过蒸散发返回大气。随着表层土壤的冻结, 上层土壤水分向表层冻结锋迁移(Taylor and Luthin, 1978), 并在土壤表层冻结成冰, 而下层土壤冻结较晚, 液态水向深层迁移形成9.06 mm的深层渗漏, 由于土壤层下为砾石, 这部分液态水可能形成地下径流。冻结发展期结束时土壤水分(ΔS)呈负均衡状态, 液态含水量净减少了14.66 mm。在完全冻结期, 降水逐渐增多至28.69 mm, 占年总降水量的8.28%, 主要形式为降雪。完全冻结期部分积雪存在消融现象, 从而引起部分水量通过蒸散发消耗(14.10 mm)。剩余融雪水中17.90 mm的水量形成地表径流, 其他融雪水全部缓慢下渗补给土壤水分。由于完全冻结期大部分土壤水分冻结, 仅存在少量液态水, 水分迁移量小, 深层渗漏量仅2.01 mm。完全冻结期结束时土壤水分(ΔS)呈正均衡状态, 水分含量净增加了5.86 mm, 补给来源主要为融雪水。
灌丛草甸土壤融化发展期降水量显著增加, 达到106.29 mm, 占年总降水量的30.67%。融化发展期表层土壤最先融化促进了蒸散发, 并且融化发展期在5-7月份, 正是植被生长季, 植被生长旺盛, 因此这一阶段的蒸散发为88.40 mm, 其中蒸腾量为69.05 mm, 占蒸散发的78.11%。而深层土壤融化较晚, 阻碍了水分迁移, 导致这一阶段的深层渗漏量仅7.53 mm。土壤水分(ΔS)在这一时期结束时呈正均衡状态, 净增加了10.43 mm。灌丛草甸土壤完全融化期降水量为207.31 mm, 占年总降水量的59.82%, 是四个时期中降水的最大值, 基本全部下渗补给土壤水分, 未产生地表径流。完全融化期土壤水分(ΔS)呈负均衡状态, 上层土壤水分中105.52 mm的水量通过蒸散发消耗, 其中植被蒸腾消耗水量为75.49 mm, 占总蒸散发的71.54%。深层土壤水分102.57 mm通过深层渗漏消耗, 也是四个时期中深层渗漏的最大值。表层蒸散发和深层渗漏共同作用导致这一时期结束时土壤水分含量净减少了3.93 mm。
4 讨论
4.1 土壤冻融过程模拟及阶段划分
本研究中SHAW模型对土壤冻融过程中水热变化特征的模拟效果较好, 表明SHAW模型适合于祁连山浅山区季节冻土区0~1.00 m土壤冻融过程中水热传输的模拟, 模拟结果能够用于评估不同土壤冻融阶段的水量平衡特征。本研究根据表层土壤和所有土壤层日平均温度将土壤冻融过程划分为四个阶段: 冻结发展期、 完全冻结期、 融化发展期、 完全融化期, 这与王贺(2023)分析季节性冻融作用下长白山区地下水形成与演化时采用的划分方法一致, 而与其他研究中按照土壤冻结特征将冻融过程划分为不稳定冻结、 稳定冻结、 消融解冻三个阶段(陈军锋等, 2013a, 2013b; 郑秀清等, 2009; 苗春燕等, 2008; Miao et al, 2017; 王心亮等, 2023), 忽略了完全融化期的方法不一致, 但是根据图5土壤剖面温度特征图可知, 灌丛草甸土壤完全融化期持续约117天, 占整个冻融期的32.05%, 并且四个冻融阶段的水文过程差异明显, 因此本文为探究不同土壤冻融阶段的水量平衡特征, 将冻融过程分为冻结发展期、 完全冻结期、 融化发展期、 完全融化期四个阶段是合理的。在土壤冻融过程中, 土壤剖面温度和液态含水量变化趋势基本一致(胡国杰等, 2014), 呈现“U”型分布, 即融化发展期和完全融化期的土壤温度和液态含水量显著高于冻结发展期和完全冻结期, 并且冻结期土壤温度和液态含水量的变化相对平稳, 这与众多研究者(白云, 2020; 高泽永等, 2014)的研究结论一致, 浅层土壤液态含水量在融化发展期和完全融化期受外界降水、 深层渗漏、 蒸散发等影响, 波动较大, 而深层土壤液态含水量相对稳定(Fang et al, 2016)。
4.2 土壤冻融过程中的水量平衡特征
大口子沟垭口观测点的降水量从冻结发展期到完全融化期逐渐增多, 完全融化期的降水量达到最大值, 年总降水量的90.49%集中在融化发展期和完全融化期。整个土壤冻融过程中蒸散发总量为210.09 mm, 其中92.30%集中在融化发展期和完全融化期。这两个阶段的蒸散发主要以植被蒸腾为主, 植被蒸腾量分别占蒸散发的78.11%和71.54%, 因为融化发展期和完全融化期植被生长旺盛, 一方面, 植被对降水具有较强的截留作用, 并且地表植被覆盖能显著降低裸地蒸发, 另一方面, 植被的蒸腾作用会促进土壤水分向大气中的散失(李海防等, 2013)。相比之下, 冻结发展期和完全冻结期由于表层土壤冻结, 阻碍了表层土壤蒸发, 而这两个阶段植被蒸腾量也非常小, 因此这两个阶段的蒸散发仅占年总蒸散发的7.70%。
整个土壤冻融过程中的地表径流几乎全部集中在完全冻结期, 这一阶段没有植被拦截降水, 土壤表层冻结水分入渗困难, 因此融雪水可快速形成地表径流。冻结发展期虽然表层土壤冻结, 但是降水较少, 经积雪层拦截和地表蒸散发消耗, 仅产生地表径流0.17 mm。融化发展期和完全融化期的降水经植被拦截后全部入渗补给土壤水分, 未产生地表径流。与地表径流不同的是, 深层渗漏在土壤冻融过程的每个阶段均有产生。本研究模拟深层(100 cm处)渗漏为121.17 mm, 占年总降水量的34.96%, 远高于先前研究中深层土壤水分渗漏量约相当于年降水5%的结论(Dai et al, 2019), 其中有102.57 mm的深层渗漏发生在完全融化期, 产生这种现象的原因一是深层渗漏对降水响应具有滞后性和延迟性(李卫等, 2015; 张国盛, 2002), 土壤深处渗漏的产生通常是多次降水过程累积的结果, 融化发展期和完全融化期降水均较多, 因此完全融化期土壤蓄水量较多且土壤层完全融化。二是灌丛草甸土壤类型为灰褐土, 比Mattic Epipedon(Dai et al, 2019)持水能力低, 导水率较高, 较多的水分可以向深层渗漏。这部分水分可能形成地下径流, 对于山下河流补给具有重要作用。
土壤水分动态变化结果显示, 从夏季开始呈负均衡状态, 持续到次年年初土壤水分呈正均衡状态。土壤水分在冻结发展期和完全融化期亏损的原因是深层渗漏量较大, 在完全冻结期和融化发展期能够蓄水的原因是冻土层具有较高的隔水特性, 表层土壤冻结限制了非生长季蒸散发的过度损失(郭林茂等, 2020), 下层土壤冻结阻滞了水分向更深层渗漏 (Zhang et al, 2019), 表明土壤冻结有利于土壤水分的保持(戴黎聪等, 2020; 赵林等, 2019)。
5 结论
本文基于祁连山浅山区大口子沟垭口观测点土壤水热数据, 利用SHAW模型模拟土壤冻融过程中的水热动态, 分析各冻融阶段中土壤水热动态变化特征和水量平衡特征, 得到的主要结论如下:
(1) 从模型模拟效果上来看, SHAW 模型均能较好地模拟灌丛草甸土壤温湿度垂向分布特征以及随时间的动态变化特征, 土壤温度的平均相关系数R、 纳什效率系数NSE、 均方根误差RMSE分别为0.98、 0.92和1.48 ℃, 土壤湿度的平均相关系数R、 纳什效率系数NSE、 均方根误差RMSE分别为0.95、 0.91和0.05 m3·m-3。在垂向剖面上, 土壤温湿度的模拟结果均表现为土层越深模拟效果越好。
(2) 灌丛草甸土壤完全冻结期持续时间最长, 冻结发展期持续时间最短, 土壤冻融过程呈现出单向冻结单向融化的特征。土壤冻融过程中土壤剖面的温度和水分的变化趋势相似, 整体呈现“U”型, 即融化发展期和完全融化期的温度和水分比冻结发展期和完全冻结期高, 表层土壤水分波动较大, 而深层土壤水分比较稳定。
(3) 不同土壤冻融阶段的水量平衡特征差异明显。冻结发展期降水输入仅4.28 mm, 主要水分支出为深层渗漏(9.06 mm)。完全冻结期降水形式主要以降雪为主, 输入水分28.69 mm, 水分支出以地表径流(17.90 mm)和蒸散发(14.10 mm)为主。融化发展期降水量为106.29 mm, 主要水分支出为地表蒸散发(88.40 mm), 其中植被蒸腾占78.11%。完全融化期降水输入最多, 达到207.31 mm, 水分支出最大的为地表蒸散发(105.52 mm)。土壤水分在冻结发展期和完全融化期呈负均衡状态, 在完全冻结期和融化发展期呈正均衡状态。