1 引言
2 数据来源和方法介绍
2.1 数据来源
2.2 方法
2.2.1 风场反演
2.2.2 统计量
3 数据质量控制方法的优化
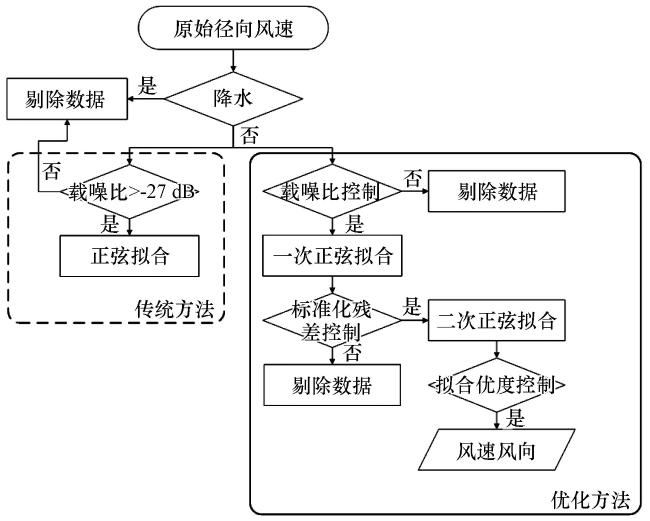
3.1 径向风速数据的质量控制
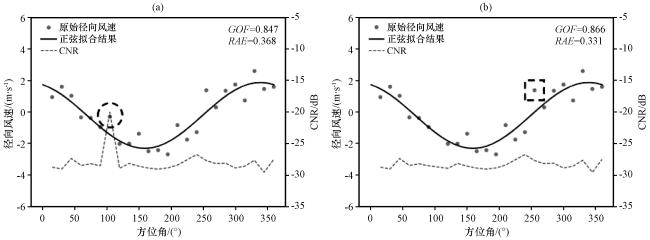
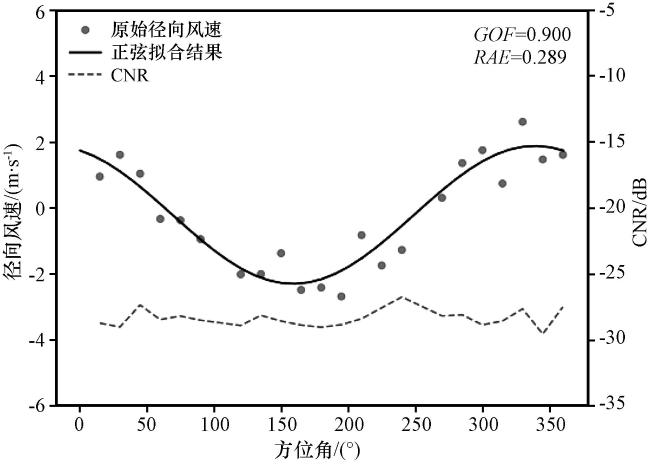
图2 2020年4月4日23:30径向距离为13 m处的径向风速随方位角的变化(灰色点)及正弦拟合结果(实线)(a)使用 过滤, (b)使用 >1.2 过滤, 虚线为数据点对应的CNR值, 圆圈标记为CNR异常值, 方框标记为CNR值正常但离散较大的数据点 Fig.2 Radial wind speed variation with azimuth angle (gray dots) and the fitting results (solid line) at 23:30 on April 4, 2020 at radial distance of 13 m.(a) Filtering using CNR< -27 dB, (b) Filtering using > 1.2 .The dashed line represents CNR values, the circle indicates the abnormal CNR, and the box marker indicates data points with normal CNR but high dispersion |
3.2 反演结果的质量控制
图5 相对绝对误差和可用数据量百分率随 的变化(a)风电场内(S3), (b)风电场外(S1)。黑色线和阴影区域分别表示0.05 GOF区间RAE的平均值和RAE的标准差范围, 灰色线表示可用数据量百分率 Fig.5 Variation of RAE and percentage of available data with GOF.Within the wind farm (S3), (b) outside the wind farm (S1).The black line and shaded area represent the RAE averaged within the 0.05 GOF interval and the range of RAE standard deviation, respectively, the gray line represents the percentage of available data |
4 反演结果验证
4.1 风速和风向验证
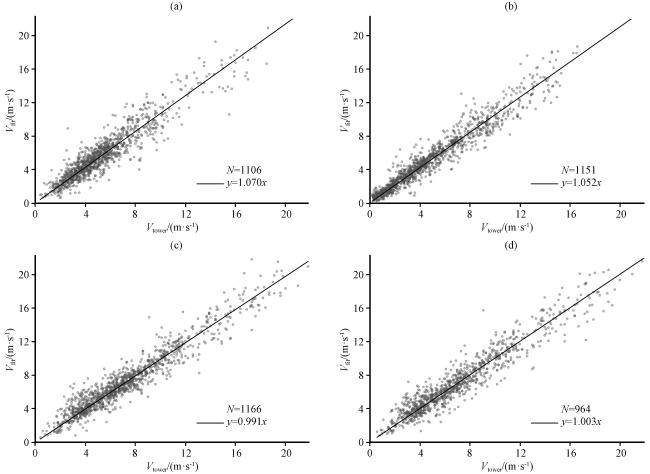
图7 反演风速 与观测风速 的对比(a)S3处10°仰角VAD反演的10 m风速, (b)S1处10°仰角VAD 反演的 10 m风速, (c)S3处10°仰角VAD 反演的 70 m风速, (d)S3处30°仰角VAD反演的 70 m风速 Fig.7 Comparison of inversed wind speed with the observations .(a) 10 m wind speed inversed using VAD scans with 10° elevation angle at S3, (b) 10 m wind speed inversed using VAD scans with 10° elevation angle at S1, (c) 70 m wind speed inversed using VAD scans with 10° elevation angle at S3, (d) 70 m wind speed inversed using VAD scans with 30° elevation angle at S3 |
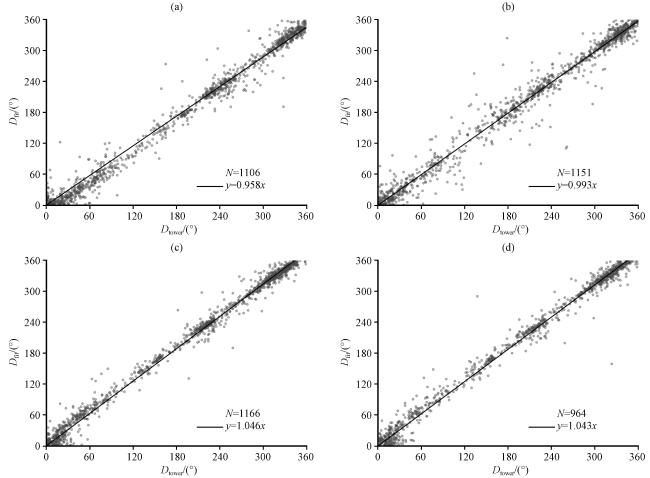
图8 反演风向 与观测风向 的对比(a)S3处10°仰角VAD反演的10 m风向, (b)S1处10°仰角VAD 反演的 10 m风向, (c)S3处10°仰角VAD 反演的70 m风向, (d)S3处30°仰角VAD反演的 70 m风向 Fig.8 Comparison of inversed wind direction with observation .(a) 10 m wind direction inversed using VAD scans with 10° elevation angle at S3, (b) 10 m wind direction inversed using VAD scans with 10° elevation angle at S1, (c) 70 m wind direction inversed using VAD scans with 10° elevation angle at S3, (d) 70 m wind direction inversed using VAD scans with 30° elevation angle at S3 |
表1 10°仰角VAD反演风速与测风塔观测风速的比较Table 1 Comparison between 10 m wind speed inversed using VAD scans with 10° elevation angle and tower measurements |
| 观测点 | 高度/m | 方法 | 决定系数 | 偏差/(m∙s-1) | 均方根误差/(m∙s-1) | 有效数据量/% |
|---|---|---|---|---|---|---|
| S1 | 10 | 优化 | 0.965 | 0.356 | 1.029 | 90.3 |
| 传统 | 0.934 | 0.399 | 1.433 | 96.4 | ||
| S3 | 10 * | 优化 | 0.932 | 0.454 | 1.240 | 86.3 |
| 传统 | 0.826 | 0.500 | 2.116 | 90.4 | ||
| 70 * | 优化 | 0.958 | 0.034 | 1.102 | 91.3 | |
| 传统 | 0.926 | 0.063 | 1.470 | 97.3 |
*表示优化方法反演结果与传统方法反演结果之间的差异通过了α = 0.05的显著性检验(indicate the difference between the inversion results of the optimized method and the traditional method has passed the significance test at α = 0.05) |
表2 10°仰角VAD反演风向与测风塔观测风向的比较Table 2 Comparison between 10 m wind direction inversed using VAD scans with 10° elevation angle and tower measurements |
| 站点 | 高度/m | 方法 | 斜率 | 决定系数 |
|---|---|---|---|---|
| S1 | 10 | 优化 | 0.993 | 0.987 |
| 传统 | 0.990 | 0.977 | ||
| S3 | 10 * | 优化 | 0.958 | 0.992 |
| 传统 | 0.918 | 0.978 | ||
| 70* | 优化 | 1.046 | 0.995 | |
| 传统 | 1.044 | 0.983 |
*表示优化方法反演结果与传统方法反演结果的差异通过了α = 0.05的显著性检验(indicates the difference between the inversion results of the optimized method and the traditional method has passed the significance test at α = 0.05) |
4.2 风廓线验证
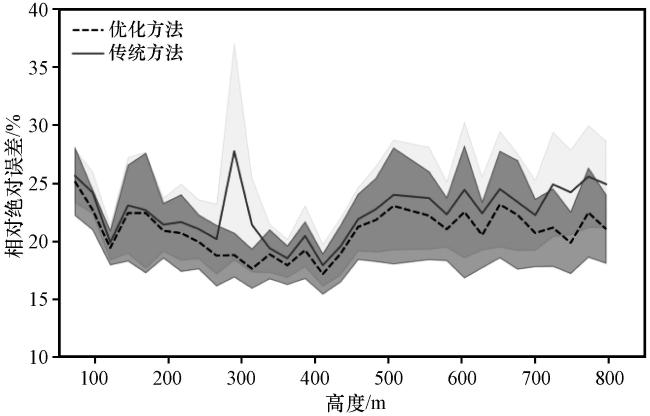
图9 风电场内部(S3)优化(虚线)和传统方法(实线)反演的风速与DBS重构风速之间的RAE随垂直高度的变化阴影区域为两种方法在95%置信区间内的标准偏差 Fig.9 RAE between the wind speeds inversed using the traditional method and the optimized method at S3 and those reconstructed by DBS.The shaded area represents the standard deviation with 95% confidence interval |


