1 引言
2 数据来源与方法介绍
2.1 代表县选取与暴雨预警信号标准修订情况
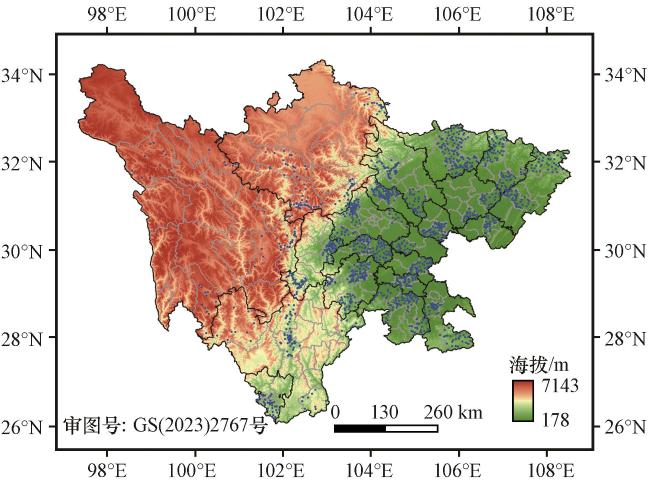
表1 四川45个代表县信息Table 1 Information of 45 representative counties in Sichuan |
| 地区 | 市(州) | 县(区) |
|---|---|---|
| 盆地地区 | 成都市 | 都江堰、 崇州、 金堂、 邛崃 |
| 德阳市 | 德阳、 绵竹 | |
| 绵阳市 | 北川、 三台 | |
| 广元市 | 广元、 苍溪 | |
| 巴中市 | 南江、 平昌 | |
| 南充市 | 营山、 高坪 | |
| 达州市 | 万源、 达县 | |
| 广安市 | 广安 | |
| 遂宁市 | 遂宁 | |
| 资阳市 | 资阳 | |
| 内江市 | 内江 | |
| 自贡市 | 自贡 | |
| 宜宾市 | 宜宾、 兴文 | |
| 泸州市 | 纳溪、 古蔺 | |
| 乐山市 | 乐山、 马边 | |
| 雅安市 | 雅安、 石棉 | |
| 眉山市 | 眉山、 仁寿 | |
| 攀西地区 | 凉山州 | 西昌、 雷波、 会东、 冕宁、 木里 |
| 攀枝花市 | 攀枝花 | |
| 川西高原 | 阿坝州 | 马尔康、 九寨沟、 汶川、 小金 |
| 甘孜州 | 康定、 德格、 色达、 稻城 |
2.2 资料来源与方法介绍
3 结果与讨论
3.1 暴雨预警信号时间分布对比评估
3.1.1 年变化
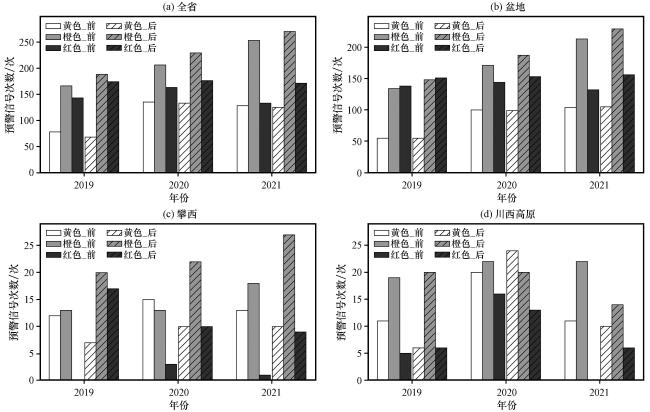
图2 标准修订前后四川各分区各等级暴雨预警信号逐年对比(a)全省, (b)盆地, (c)攀西, (d)川西高原 Fig.2 Year by year comparison of rainstorm warning signals of various levels and districts in Sichuan before and after the standard revision.(a) the whole province, (b) the Sichuan Basin, (c) Panxi region, (d) Western Sichuan Plateau |
表2 全省不同年份各等级暴雨预警信号在修订后数量变化对比Table 2 Comparison of changes in the number of rainstorm warning signals of various levels and years in the province after the standard revision |
| 年份 | 红色预警次数/次 | 橙色预警次数/次 | 黄色预警次数/次 | 总预警次数/次 |
|---|---|---|---|---|
| 合计 | 82 | 62 | -15 | 129 |
| 2019 | 31 | 22 | -10 | 43 |
| 2020 | 13 | 23 | -2 | 34 |
| 2021 | 38 | 17 | -3 | 52 |
3.1.2 月变化
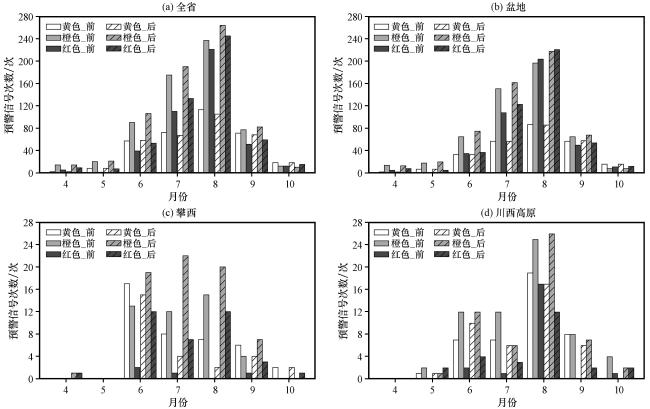
图3 标准修订前后四川各分区各等级暴雨预警信号逐月对比(a)全省, (b)盆地, (c)攀西, (d)川西高原 Fig.3 Monthly comparison of rainstorm warning signals of various levels and districts in Sichuan before and after the standard revision.(a) the whole province, (b) the Sichuan Basin, (c) Panxi region, (d) Western Sichuan Plateau |
表3 暴雨灾害逐月分布与不同月份各等级暴雨预警信号在修订后数量变化Table 3 Monthly distribution of rainstorm disasters and changes in the number of rainstorm warning signals of various levels and months after the standard revision |
| 月份 | 暴雨灾害次数/次 | 红色预警次数/次 | 橙色预警次数/次 | 黄色预警次数/次 | 总预警次数/次 |
|---|---|---|---|---|---|
| 4 | 0 | 4 | 0 | 0 | 4 |
| 5 | 1 | 6 | 1 | 0 | 7 |
| 6 | 41 | 14 | 16 | 1 | 31 |
| 7 | 102 | 23 | 15 | -5 | 33 |
| 8 | 125 | 24 | 27 | -8 | 43 |
| 9 | 45 | 8 | 5 | -3 | 10 |
| 10 | 8 | 3 | -2 | 0 | 1 |
3.1.3 日变化
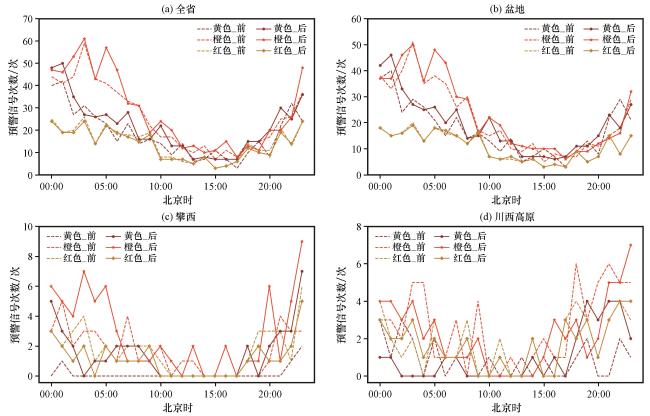
图4 标准修订前后四川各分区各等级暴雨预警信号日变化对比(a)全省, (b)盆地, (c)攀西, (d)川西高原 Fig.4 Daily variation comparison of rainstorm warning signals of various levels and districts in Sichuan before and after the standard revision.(a) the whole province, (b) the Sichuan Basin, (c) Panxi region, (d) Western Sichuan Plateau |
表4 全省不同时段各等级暴雨预警信号在修订后数量变化对比Table 4 Comparison of changes in the number of rainstorm warning signals of various levels and periods in the province after the standard revision |
| 时次 | 红色预警次数/次 | 橙色预警次数/次 | 黄色预警次数/次 | 总预警次数/次 |
|---|---|---|---|---|
| 08:00 -20:00 | 30 | 12 | -7 | 35 |
| 20:00 -08:00 | 52 | 50 | -8 | 94 |
3.2 暴雨预警信号空间分布对比评估
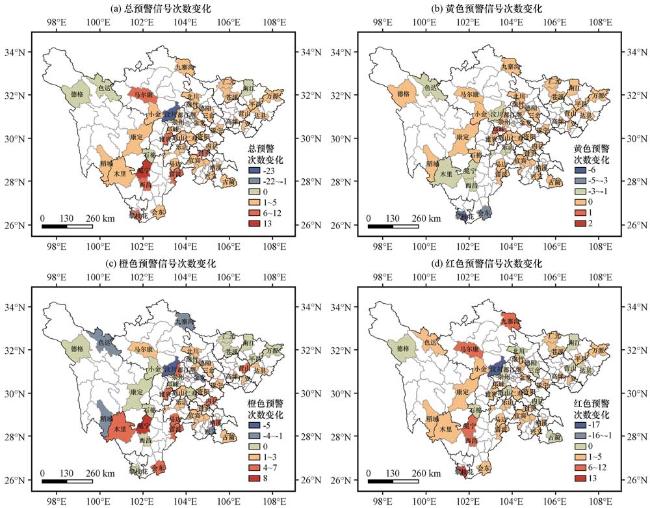
图5 标准修订前后四川各等级暴雨预警信号次数变化空间分布(单位: 次)正值、 负值、 0值分别表示修订后次数变多、 变少、 持平; (a)总预警信号, (b)黄色预警信号, (c)橙色预警信号, (d)红色预警信号 Fig.5 Spatial distribution of rainstorm warning signals frequency variation of various levels in Sichuan before and after the standard revision.Unit: time.Positive value, negative value and zero value respectively indicate that the frequency after the revision has increased, decreased, and remained unchanged.(a) Total warning signals, (b) Yellow warning signals, (c) Orange warning signals, (d) Red warning signals |
3.3 结合灾情的适用性评估
3.3.1 暴雨灾害与预警信号空间分布对比
3.3.2 预警信号准确性与时效性检验
表5 标准修订前后暴雨预警信号准确性与时效性检验对比结果Table 5 Comparison inspection results of the accuracy and timeliness of rainstorm warning signals before and after the standard revision |
| 地区 | 暴雨灾害次数/次 | 预警信号准确性对比 | 预警信号时效性对比 | |||||
|---|---|---|---|---|---|---|---|---|
| 预警信号命中情况对比[列举格式: 灾害发生地点时间(直接经济损失)] | 预警信号强度对比[列举格式: 灾害发生地点时间(信号变化情况、 直接经济损失)] | 空报次数变化/次 | 漏报次数变化/次 | 预警提前次数/次 | 平均提前时间/h | |||
| 盆地地区 | 259 | 4起灾害旧标无预警信号、 新标红色预警信号: 广元2019.8.1(1011万元)、 宜宾2020.6.26(112万元)、 乐山2021.8.22(3897万元)、 仁寿2021.8.18(876万元) | 3起灾害新标预警等级高于旧标: 资阳2021.8.22(橙→红, 169万元)、 自贡2021.9.4(橙→红, 1438万元)、 纳溪2021.7.17(橙→红, 110万元) | 9 | -4 | 42 | 1.48 | |
| 攀西地区 | 24 | 2起灾害旧标无预警信号、 新标橙色预警信号: 木里2020.6.12(25万元)、 木里2021.7.5(182万元) | 2起灾害新标预警等级高于旧标: 冕宁2020.6.11(黄→红, 4573万元)、 攀枝花2021.7.5(橙→红, 12万元) | 19 | -2 | 3 | 7.67 | |
| 川西高原 | 39 | 新、 旧标准预警信号命中情况一致 | 2起灾害新标预警等级高于旧标: 九寨沟2020.8.10(黄→红, 1747万元)、 色达2019.9.11(黄→红, 110万元)、 4起灾害新标预警等级低于旧标, 均位于汶川, 详见图9 | 13 | 0 | 4 | 8.25 | |
为更具针对性, 表中统计的次数均经过了“去重”处理, 即对同一暴雨过程内的预警信号合并为一次统计。所有分析均基于新、 旧标准下的预警信号回算结果, 不反映实际业务发布情况, 旨在对比新、 旧标准的准确性与时效性( The table employs deduplication to consolidate warning signals from the same rainstorm event into single entries, ensuring targeted analysis.All data derive from retrospective evaluations under both old and new warning criteria, excluding actual operational issuance records.This methodology enables systematic comparison of the standards' predictive accuracy and timeliness) |
3.3.3 典型实例
3.3.3.1 冕宁县2020年6月11 -12日局地暴雨洪涝灾害实例
3.3.3.2 汶川预警“降级”是否合理
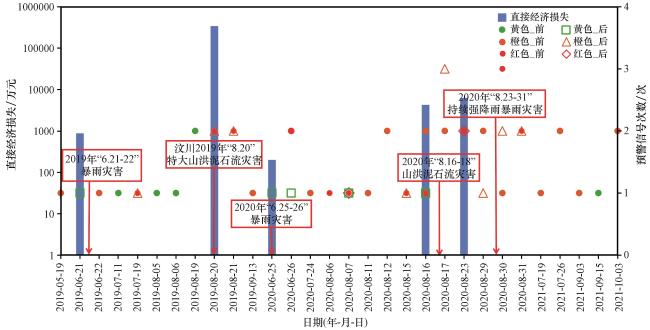
图9 2019 -2021年汶川县暴雨洪涝灾害灾损情况及标准修订前后各级暴雨预警信号时间分布对比(直接经济损失标注在灾情起始日期)Fig.9 Rainstorm and flood disaster damage and comparison of time distribution of rainstorm warning signals at various levels in Wenchuan county from 2019 to 2021 before and after the standard revision (direct economic losses are marked on the disaster start date) |


