1 引言
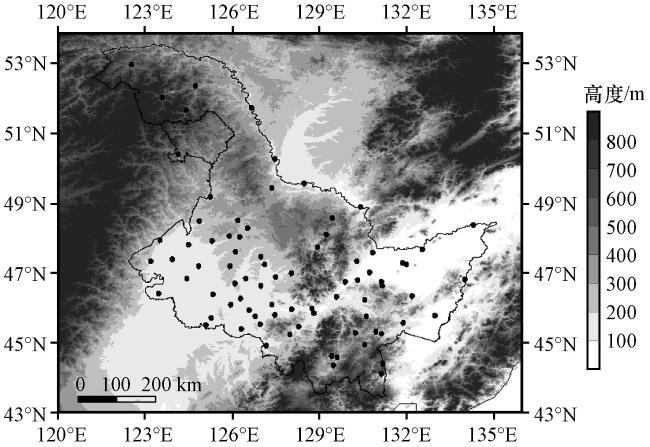
2 研究区域与观测数据
2.1 研究区域和资料来源
2.2 东北冷涡及强降水定义
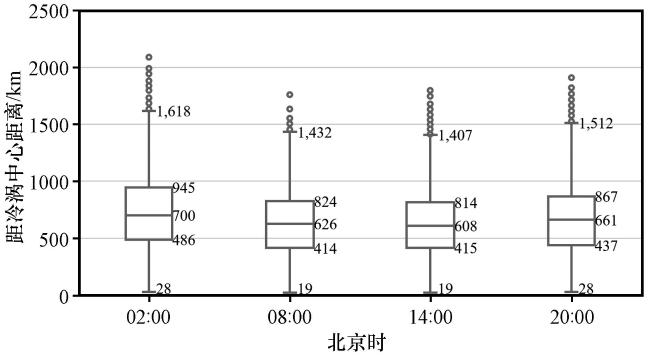
3 东北冷涡强降水日变化特征
表1 1981 -2022年东北冷涡暖季强降水逐月分布特征Table 1 Monthly distribution characteristics of heavy precipitation of NECV during the warm season from 1981 to 2022 |
| 月份 | 强降水频次/站次 | 短时强降水频次/站次 | 最大小时降水量/(mm·h-1) |
|---|---|---|---|
| 5月 | 1469 | 17 | 42.7 |
| 6月 | 5032 | 216 | 88.3 |
| 7月 | 7462 | 550 | 71.3 |
| 8月 | 4273 | 269 | 86.7 |
| 9月 | 2178 | 41 | 72.3 |
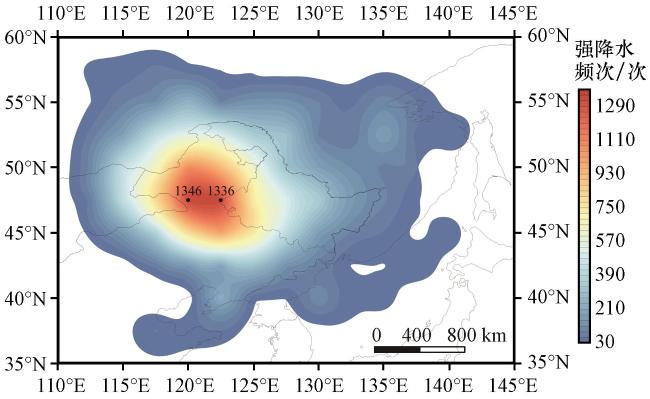
图2 不同位置东北冷涡引发黑龙江省强降水频次(单位: 次)黑点和数字表示强降水频次最高的两个位置和频次数 Fig.2 The frequency of heavy precipitation in Heilongjiang Province caused by NECV at different locations.Unit: times.Black dots and numbers indicate the two locations and frequ-ency with the highest frequency of heavy precipitation |
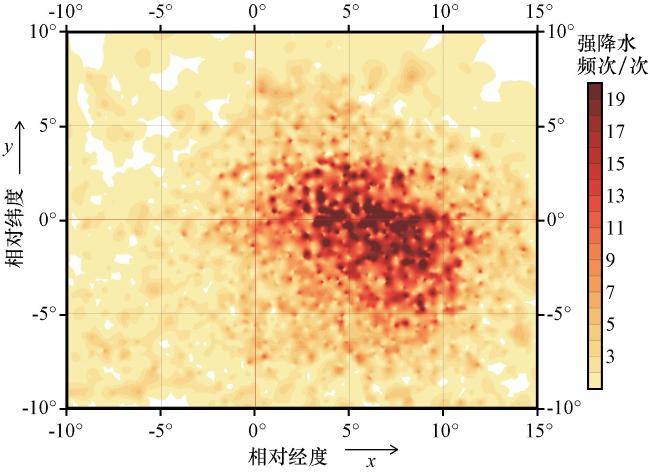
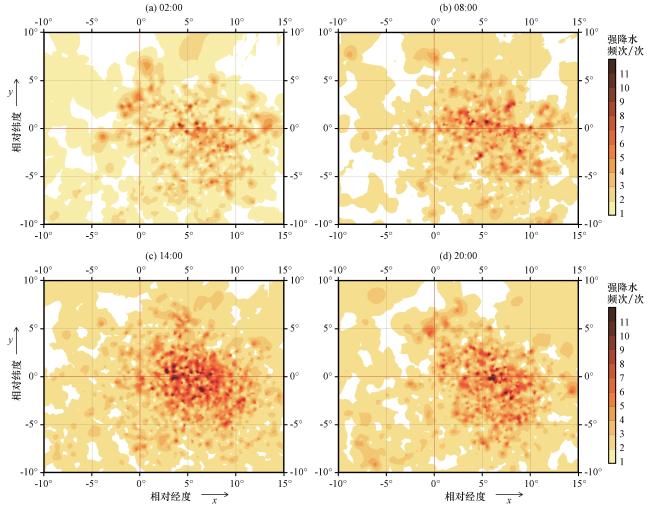
表2 1981 -2022年东北冷涡暖季强降水日变化特征信息表Table 2 Daily variation characteristic information table of heavy precipitation of NECV during the warm season from 1981 to 2022 |
| 时次 | 强降水站点数/个 | 强降水频次/站次 | 强降水频次≥10次的站点数/个 | 强降水频次≥10次的站点相对位置 | 强降水频次≥5次的站点数/个 | 强降水频次≥5次的站点相对位置 |
|---|---|---|---|---|---|---|
| 02:00 | 1786 | 3738 | 5 | 4.12°≤x≤5.88, -0.32°≤y≤2.33° | 147 | -3.88°≤x≤13.63°, -7.72°≤y≤4.83° |
| 08:00 | 1912 | 4074 | 14 | 2.35°≤x≤10.03°, 3.17°S -2.57°N | 171 | -1.82°≤x≤11.98°, -9.70°≤y≤7.33° |
| 14:00 | 2817 | 7364 | 58 | 1.27°≤x≤10.83°, -5.10°≤y≤4.22° | 443 | -4.00°≤x≤14.37°, -7.60°S≤y≤6.25° |
| 20:00 | 2122 | 5238 | 25 | 0.93°≤x≤10.47°, 4.47°S -2.90°N | 283 | -6.20°≤x≤14.28°, -9.17°≤y≤6.93° |
4 日变化特征成因分析
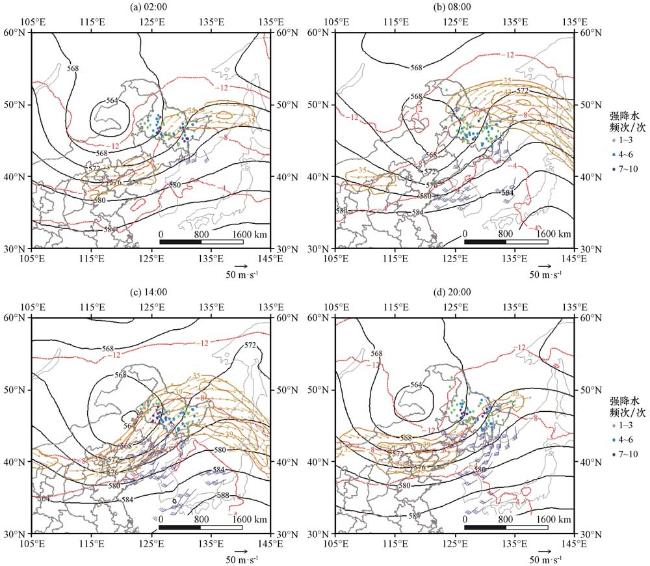
图6 合成形势场中500 hPa位势高度场(黑色实线, 单位: dagpm)、 温度场(红色虚线, 单位: ℃)、 200 hPa水平风场(黄色实线, 箭矢, 单位: m·s-1, 仅显示≥35 m·s-1) 、 850 hPa水平风场(风向杆, 单位: m·s-1, 仅显示≥12 m·s-1)和强降水频次(彩色圆点, 单位: 次)Fig.6 500 hPa geopotential height field (solid black lines, unit: dagpm), temperature field (red dashed lines, unit: ℃), 200 hPa wind field (solid yellow lines, vector, unit: m·s-1, only show ≥35 m·s-1), 850 hPa wind field (barb, unit: m·s-1, only show ≥12 m·s-1) in composite fields and heavy precipitation frequency (colored dots, unit: time) |
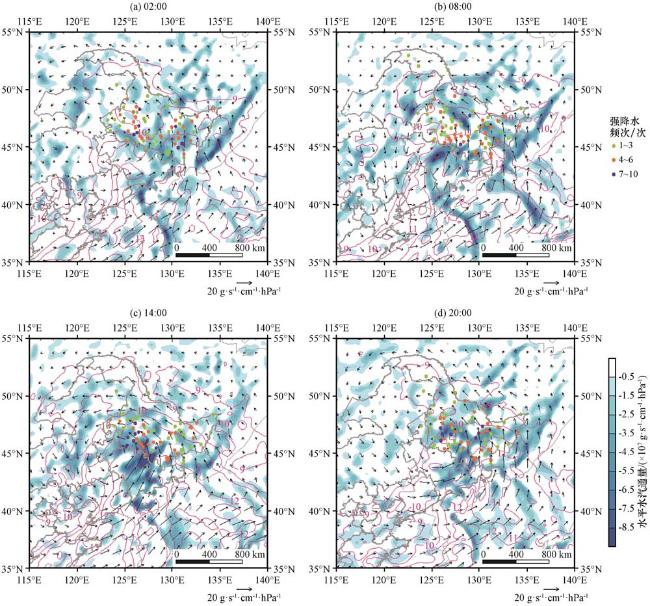
图7 合成形势场中850 hPa水汽通量(箭矢, 单位: g·s-1·cm-1·hPa-1)、 水汽通量散度(阴影, 单位: ×10-7 g·s-1·cm-2·hPa-1)、 比湿(等值线, 单位: g·kg-1) 和强降水频次(彩色圆点, 单位: 次)Fig.7 850 hPa vapor flux (vector, unit: g·s-1·cm-1·hPa-1), vapor flux divergence(shade, unit: ×10-7 g·s-1·cm-2·hPa-1), specific humidity (contour, unit: g·kg-1) in composite fields and heavy precipitation frequency (colored dots, unit: time) |
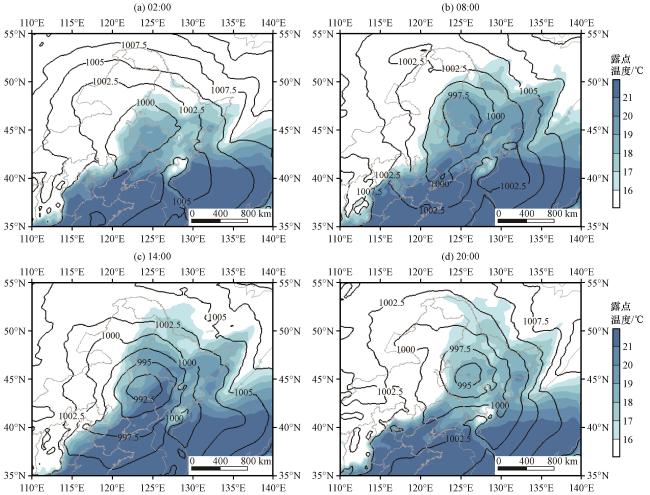
图8 合成形势场中海平面气压场(等值线, 单位: hPa)和露点温度(阴影, 单位: ℃)Fig.8 Sea level pressure field (contour, unit: hPa) and dew point temperature (shade, unit: ℃) in ground composite fields |
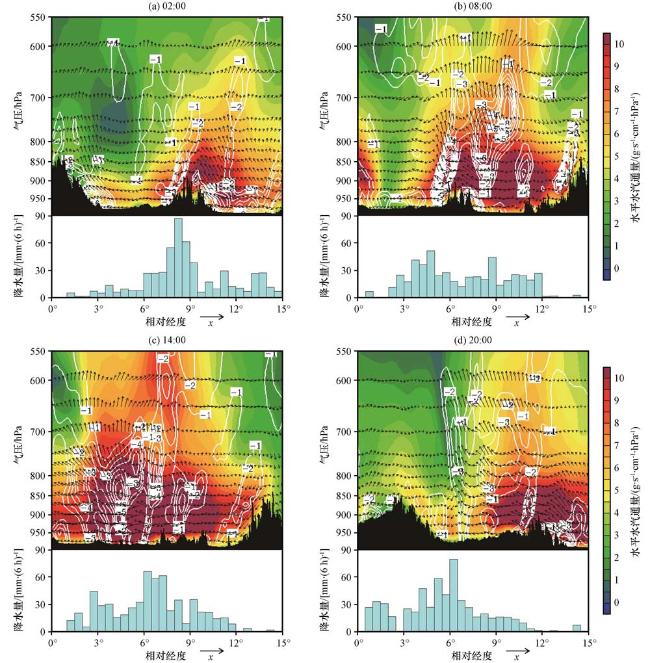
图9 合成形势场中冷涡中心及东侧纬向垂直剖面图上图: 水平水汽通量(阴影, 单位: g·s-1·cm-1·hPa-1)、 水汽通量散度(等值线, 单位: ×10-7 g·s-1·cm-2·hPa-1) 、 u方向风(单位: m·s-1)与15倍垂直速度(单位: Pa·s-1)(箭矢), 黑色阴影代表地形高度; 下图: 蓝色直方图代表站点观测的典型过程平均6 h降水量(P 1h≥5 mm)在纬向上的投影[单位: mm·(6h)-1] Fig.9 Latitudinal vertical profile of the center and east side of NECV in the composite fields.In top figures, the horizontal vapor flux (shade, unit: g·s-1·cm-1·hPa-1), the vapor flux divergence(contour, unit: ×10-7 g·s-1·cm-2·hPa-1), U-direction wind (unit: m·s-1) and 15 times vertical velocity (unit: Pa·s-1) (vector), the black shadings represent terrain.In top figures, blue bars represent the latitudinal projection of the average 6-hour precipitation (P 1h≥5 mm) for typical processes observed at the station [unit: mm·(6h)-1] |
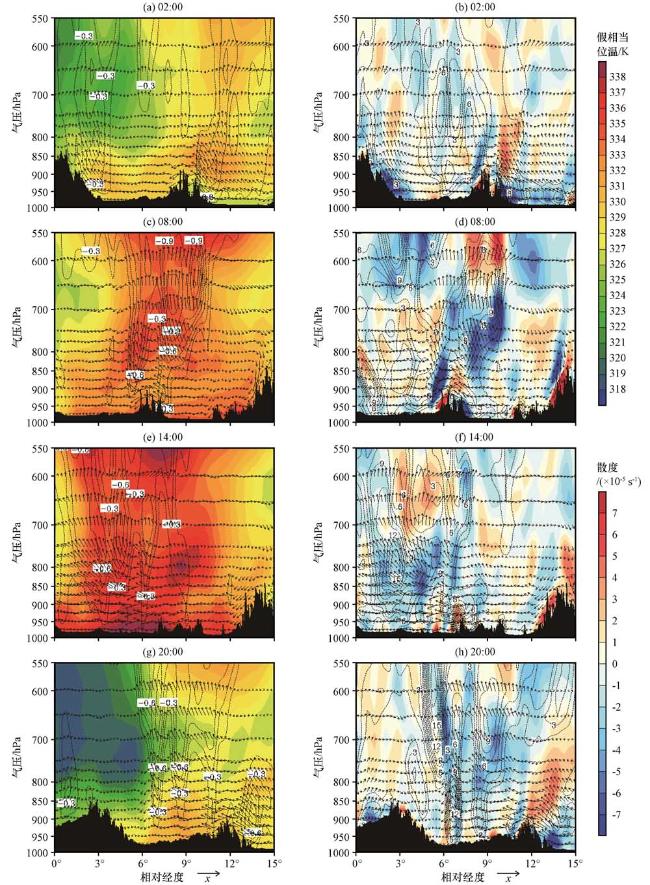
图10 合成形势场中冷涡中心及东侧纬向垂直剖面图左图: 假相当位温(阴影, 单位: K)、 垂直速度(等值线, 单位: Pa·s-1); 右图: 散度(阴影, 单位: ×10-5 s-1)、 涡度(等值线, 单位: ×10-5 s-1);u方向风速(单位: m·s-1)与15倍垂直速度(单位: Pa·s-1)的合成场(箭矢), 黑色阴影代表地形 Fig.10 Latitudinal vertical profile of the center and east side of the cold vortex in the composite fields In left figures, the potential pseudo-equivalent temperature (shade, unit: K), the vertical velocity (contour, unit: Pa·s-1).In right figures, the divergence (shade, unit: ×10-5 s-1), the vorticity (contour, unit: ×10-5 s-1).U-direction wind (unit: m·s-1) and 15 times vertical velocity (unit: Pa·s-1) (vector), the black shadings represent terrain |


