
1 引言
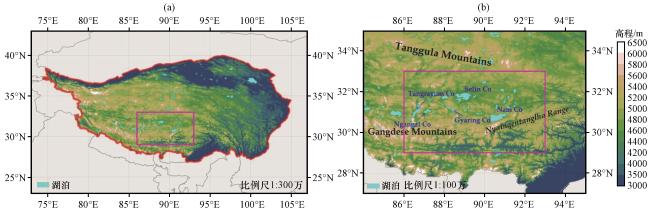
2 研究区地理概况
3 数据资料、 数值模式和方法
3.1 数据资料
3.2 湖-气耦合模式
3.3 方法
3.3.1 极端降水和区域性极端降水事件的定义
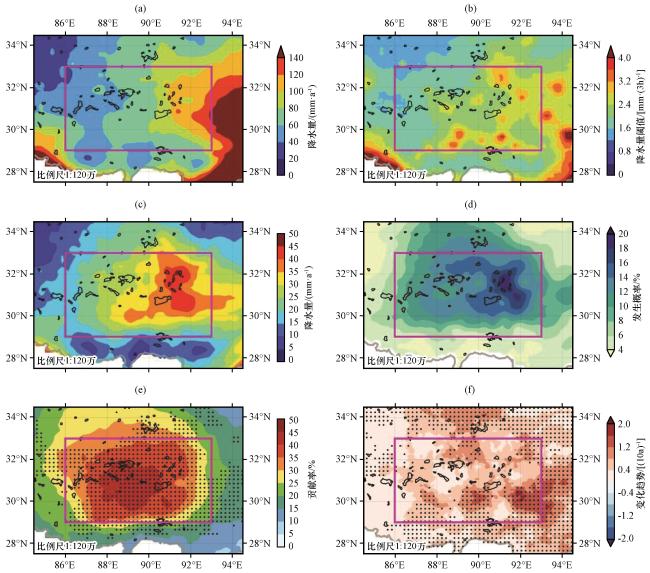
图2 1979 -2018年高原中部多年平均秋季降水量(a, 单位: mm·a-1), 极端降水95百分位阈值[b, 单位: mm·(3h)-1], 区域性极端事件引发的多年平均秋季降水量(c, 单位: mm·a-1), 区域性极端事件下极端降水的发生概率(d, 单位: %), 区域性极端事件降水量对秋季总降水的贡献率(e, 单位: %), 区域性极端事件引发的极端降水频次变化趋势[f, 单位: (10a)-1]的空间分布图(e)和(f)中的打点区域表示信度通过0.05的显著性检验 Fig.2 Spatial distribution of autumn precipitation averaged (a, unit: mm·a-1), 95 percentile threshold of extreme precipitation in autumn [b, unit: mm·(3h)-1], autumn precipitation induced by regional extreme rainfall events averaged (c, unit: mm·a-1), occurrence probability of extreme precipitation under regional extreme rainfall events (d, unit: %), contribution rate of regional extreme event precipitation to the total precipitation in autumn (e, unit: %), and long term trends of the occurrences of extreme precipitation under regional extreme rainfall events [f, unit: (10a)-1] during 1979 -2018.The dots in (e) and (f) indicate the statistical significance of 0.05 level |
3.3.2 环流分型算法
4 结果分析
4.1 青藏高原中部地区秋季区域性极端降水事件的主控天气型
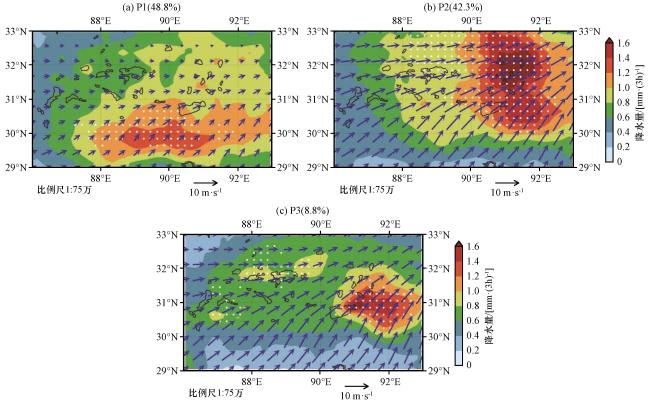
图3 各主控天气型下的降水量[填色, 单位: mm·(3h)-1]和500 hPa 风场(矢量, 单位: m·s-1)空间分布白色打点区域表示在不同天气型下极端降水发生概率超过15%, 各子图图题中括号内的数字为各天气型发生频次占总区域性极端事件发生频次的比例, 黑线表示湖泊的边界 Fig.3 Spatial distribution of precipitation amount [colored, unit: mm·(3h)-1] and 500 hPa wind field (vector, unit m·s-1) under different dominant synoptic patterns.The white dots indicate the regions where the probability of extreme precipitation occurrence exceeds 15% under each synoptic pattern.The number in parentheses in each subgraph is the proportion of the occurrences of each weather type to the total occurrences of regional extreme precipitation events.Black lines identify the boundary of lakes |
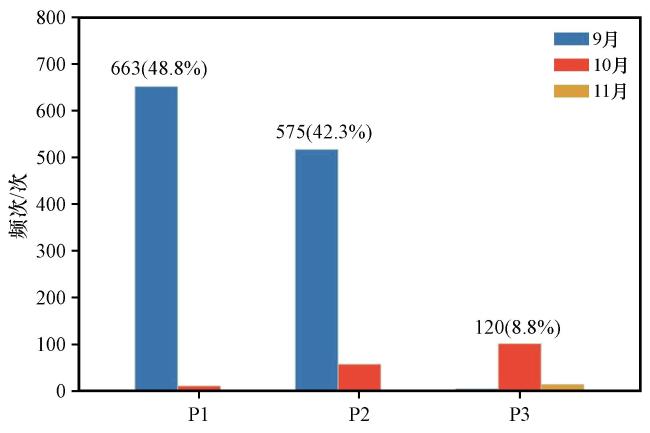
图4 1979 -2018年青藏高原中部秋季区域性极端降水事件的主控天气型在各月的出现频次括号中的数值表示各主控天气型发生频次占总区域性极端降水事件发生频次的比例 Fig.4 The occurrence number of the regional extreme precipitation events in the central Qinghai-Xizang Plateau during the Autumns of 1979 to 2018.The numbers in parentheses indicate the proportion of the occurrence of each synoptic pattern to the total occurrence of regional extreme precipitation events |
4.2 各主控天气型下大尺度环流场及其异常的高低层配置
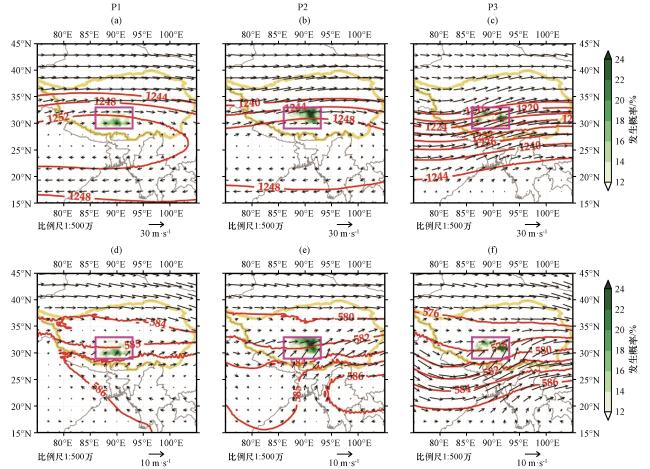
图5 各主控天气型下的200 hPa和500 hPa大尺度环流配置, 位势高度(等值线, 单位: dagpm)、 风场(矢量, 单位: m·s-1)和极端降水发生概率(填色, 单位: %)(a) P1 200 hPa, (b) P2 200 hPa, (c) P3 200 hPa, (d) P1 500 hPa, (e) P2 500 hPa, (f) P3 500 hPa, 紫色方框为高原中部范围, 黄色粗实线为青藏高原边界 Fig.5 Large-scale circulation configuration of 200 hPa and 500 hPa under each synoptic pattern of regional extreme precipitation, geopotential height (contour line, unit: dagpm), wind field (vector, unit: m·s-1) and extreme precipitation occurrence probability (shadings, unit: %).(a) P1 200 hPa, (b) P2 200 hPa, (c) P3 200 hPa, (d) P1 500 hPa, (e) P2 500 hPa, (f) P3 500 hPa.Purple box indicates the range of the central Qinghai-Xizang Plateau, and yellow thick solid line shows the boundary of the Qinghai-Xizang Plateau |
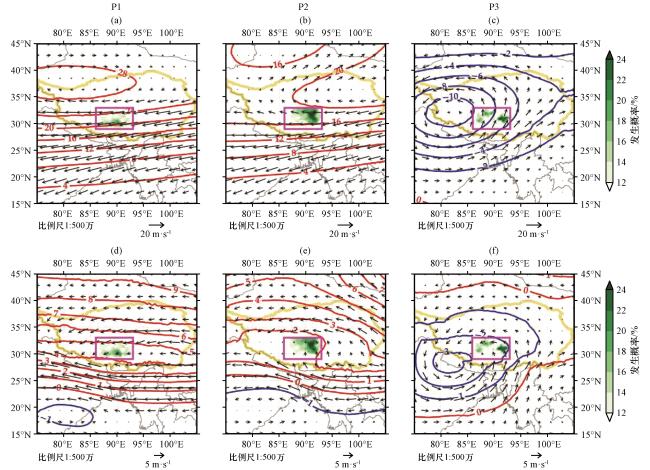
图6 各主控天气型下200 hPa和500 hPa大尺度环流场相对于1979 -2018年秋季气候态的差异位势高度差值(等值线,单位:dagpm)、风场差值(矢量)和极端降水发生概率差异(填色), (a) P1 200 hPa, (b) P2 200 hPa, (c) P3 200 hPa, (d) P1 500 hPa, (e) P2 500 hPa, (f) P3 500 hPa, 紫色方框为高原中部范围,黄色粗实线为青藏高原边界 Fig.6 The differences between the composite mean large-scale circulation of 200 hPa and 500 hPa under each synoptic pattern responsible for the regional extreme rainfall events in autumn and the climatic mean of 1979 -2018.The differences of geopotential height (contour line, unit: dagpm), wind field (vector,unit:m·s-1) and extreme precipitation occurrence probability (shadings,unit: %).(a) P1 200 hPa, (b) P2 200 hPa, (c) P3 200 hPa, (d) P1 500 hPa, (e) P2 500 hPa, (f) P3 500 hPa.Purple box indicates the range of the central Qinghai-Xizang Plateau, and yellow thick solid line shows the boundary of the Qinghai-Xizang Plateau |
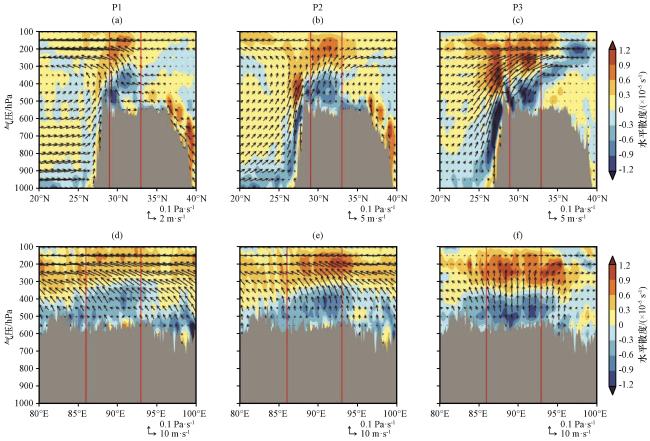
图7 各主控天气型下沿86°E -93°E平均的纬向(a~c)及29°N -33°N平均的经向(d~f)环流(矢量)和水平散度(填色, 单位: ×10-5 s-1)相对于1979 -2018年秋季气候态差异的垂直剖面(a, d) P1, (b, e) P2, (c, f) P3, 灰色填色表示青藏高原地形, 各图中两条红色竖线之间的区域表示高原中部范围 Fig.7 The vertical profile of the differences between the circulation (vectors) and horizontal divergence (shaded, unit: ×10-5 s-1) of the zonally averaged (a~c) along 86°E -93°E and meridionally averaged (d~f) along 29°N -33°N and the climatic mean during autumn of 1979 -2018.(a, d ) P1, (b, e) P2, (c, f) P3.The gray color fillings indicate the topography of the Qinghai-Xizang Plateau, and areas between the two red vertical lines in each sub-figure indicate the range of the central Qinghai-Xizang Plateau |
4.3 青藏高原中部秋季区域性极端降水事件形成中的湖泊效应
4.3.1 模式配置和试验方案设计
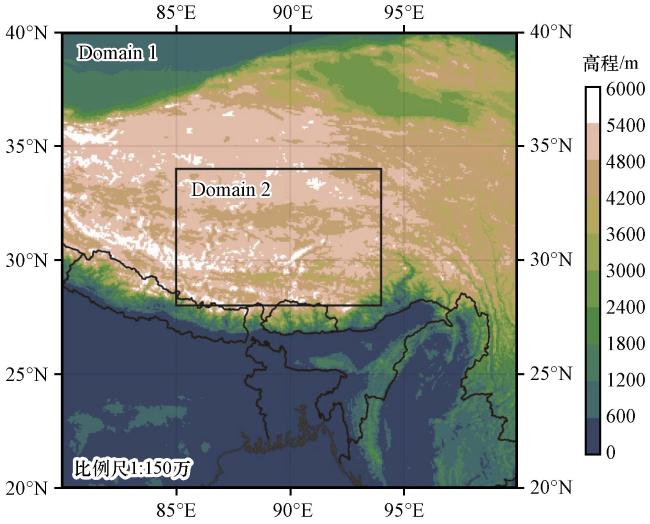
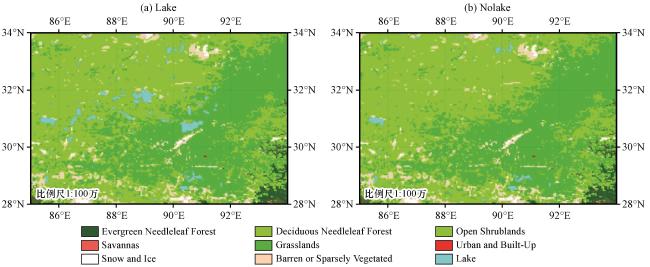
图8 WRF-Lake模式嵌套区域设置及地形高度(单位: m)Fig.8 Nesting area and topographic height of WRF-Lake model.Unit: m |
表1 WRF-Lake模式的参数化方案设置Table 1 Model configurations of parameterization schemes in WRF-Lake model |
| 物理过程 | 参数化方案 |
|---|---|
| 微物理 | WRF single-moment 6-class scheme |
| 积云参数化 | Grell-Devenyi ensemble scheme |
| 长波辐射 | RRTM scheme |
| 短波辐射 | Dudhia scheme |
| 边界层 | Noah scheme |
| 陆面 | YSU scheme |
4.3.2 模式结果验证
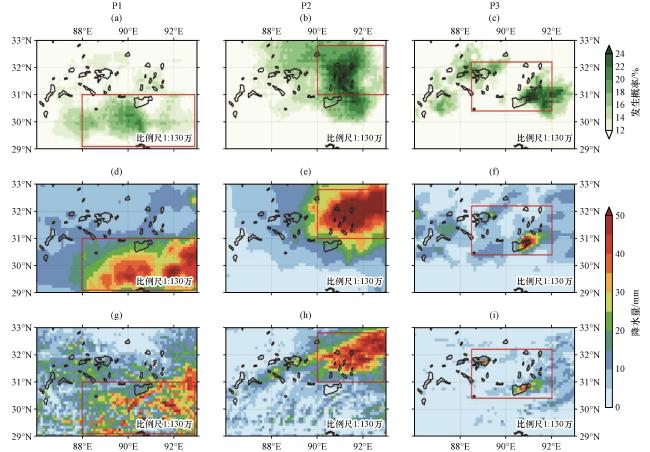
图10 各主控天气型下极端降水发生概率(a~c, 单位: %), CMFD(d~f)观测和Lake试验模拟(g~i)的多个例区域性极端降水事件的累积降水量(单位: mm)红色方框表示模拟与观测对应的降水集中区域 Fig.10 The occurrence probability of extreme precipitation (a~c,unit: %), the cumulative precipitation amount of multi-cases of regional extreme precipitation events from CMFD observation (d~f) and simulations Lake experiment (g~i).The red box indicates the precipitation concentration area corresponding to the simulation and observation |
4.3.3 各主控天气型下湖泊效应对区域性极端降水的影响及差异
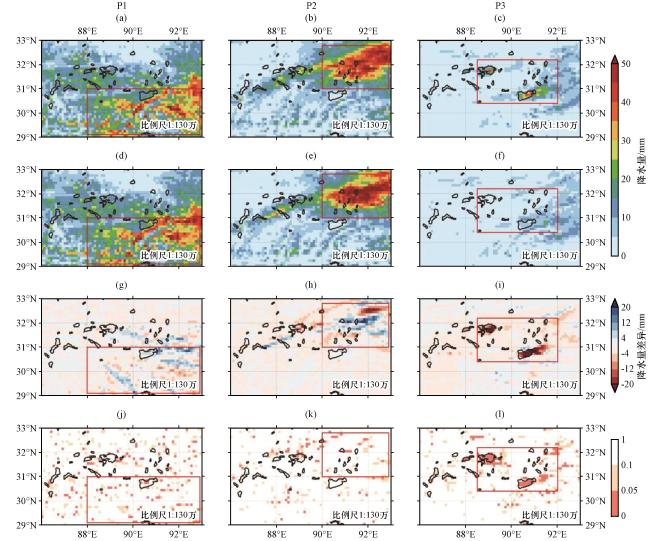
图11 各主控天气型下Lake(a~c)和Nolake试验(d~f)模拟的多个例累积降水量及其差异(Nolake-Lake)(g~i)的空间分布, 以及差异显著性超过90%的区域(j~l)Fig.11 Spatial distribution of multi-cases cumulative precipitation simulated by the Lake (a~c) and Nolake experiments (d~f) under each synoptic pattern and their differences between Nolake and Lake (g~i), and the areas with the difference significance exceeding 90% (j~l) |
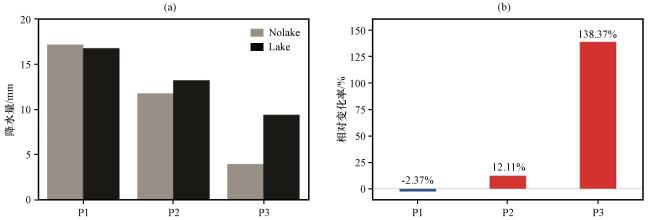
图12 各主控天气型下Lake和Nolake试验模拟的多个例累积降水量在变化显著区的区域平均(a)以及Lake试验模拟的累积降水量相对于Nolake试验的相对变化率(b)Fig.12 The cumulative precipitation of multi-cases simulated by the Lake and Nolake experiments under each typical synoptic pattern regionally averaged over the regions where the differences between the Lake and Nolake experiments are significant (a), and the relative change rate of cumulative precipitation simulated by the Lake experiment compared to the Nolake experiment (b) |
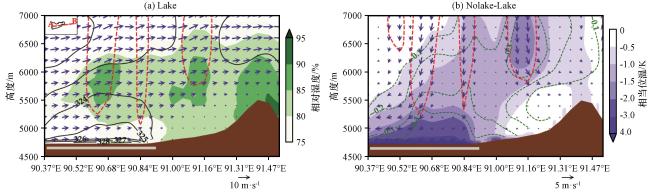
图13 P3天气型下Lake试验模拟的相对湿度(填色,单位:%)、相当位温(黑色等值线,单位:K)、垂直速度(红色等值线,单位:m·s-1)和经向环流(矢量,垂直分量被放大10倍)的高度-经度剖面 (a), Nolake与Lake试验模拟的相当位温(填色,单位:K)、比湿(绿色等值线,单位:g·kg-1)、经向环流(矢量,垂直分量被放大10倍)的差异和垂直速度差异极值区(≤-0.25 m·s-1,红色等值线,单位: m·s-1)(b)剖面位置沿图左上角小图A-B红色虚线,灰色粗实线代表纳木错湖位置,棕色为地形 Fig.13 The height-longitude profile of the modeled relative humidity (shadings, unit: %), equivalent potential temperature (black contour, unit: K), vertical velocity (red contour, unit: m·s-1) and zonal circulation (vector, vertical component magnified 10 times) by the Lake experiment under the synoptic pattern P3 (a).Differences of equivalent potential temperature (shadings, unit: K), specific humidity (green contour, unit: g·kg-1), zonal circulation (vector, vertical component magnified 10 times) and the extreme value area of vertical velocity difference (≤-0.25 m·s-1, red contour, unit: m·s-1) between Nolake and Lake experiments, (b) The profile location is along the dashed red line A-B in the upper left corner of the figure (a), gray thick solid line represents the location of Nam co Lake and the brown shows the terrains |