
1 引言
2 资料介绍与研究方法
2.1 资料介绍
2.2 研究方法
3 海河流域历史洪水特征
3.1 时空分布特征
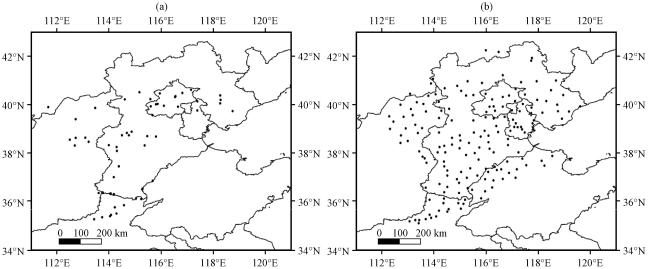
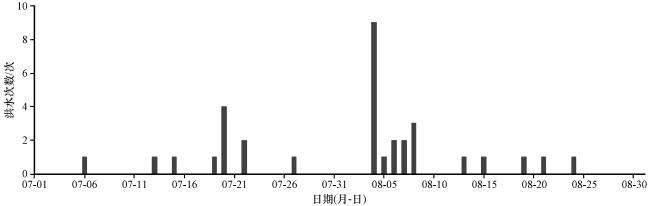
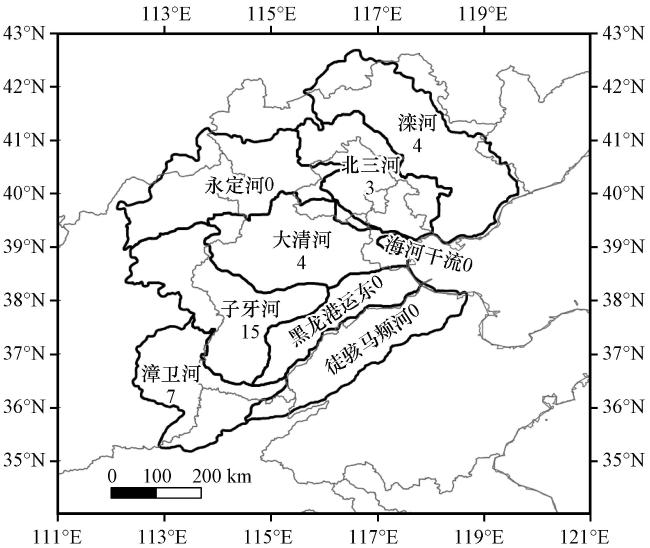
图3 海河流域9个分区(黑色实线)中历史洪水频数(数字, 单位: 次)的空间分布Fig.3 Spatial distribution of historical flood frequencies(unit: times) in 9 Division(indicated by black solid lines) of the Haihe River Basin |
表1 海河流域不同等级洪水频数分布统计表Table 1 Flood frequency distribution by levels in the Haihe River Basin |
| 分型 | 滦河 | 北三河 | 大清河 | 子牙河 | 漳卫河 |
|---|---|---|---|---|---|
| 特大洪水/次 | 1 | 0 | 0 | 6 | 2 |
| 大洪水/次 | 1 | 0 | 3 | 4 | 2 |
| 中等洪水/次 | 2 | 3 | 1 | 5 | 2 |
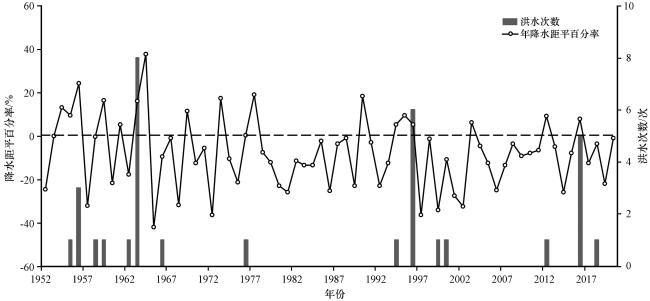
3.2 海河流域历史洪水及降水年际分布
4 海河流域致洪暴雨天气学分型
表2 海河流域致洪暴雨分型统计表Table1 Synoptic patterns of flood-causing rainstorms in Haihe River Basin |
| 分型 | 发生站次/次 | 占比/% |
|---|---|---|
| 北上台风型 | 14 | 42.4 |
| 东北冷涡+西南涡型 | 9 | 27.3 |
| 低涡型 | 5 | 15.2 |
| 高空槽型 | 3 | 9.1 |
| 蒙古冷涡型 | 2 | 6.1 |
4.1 北上台风型
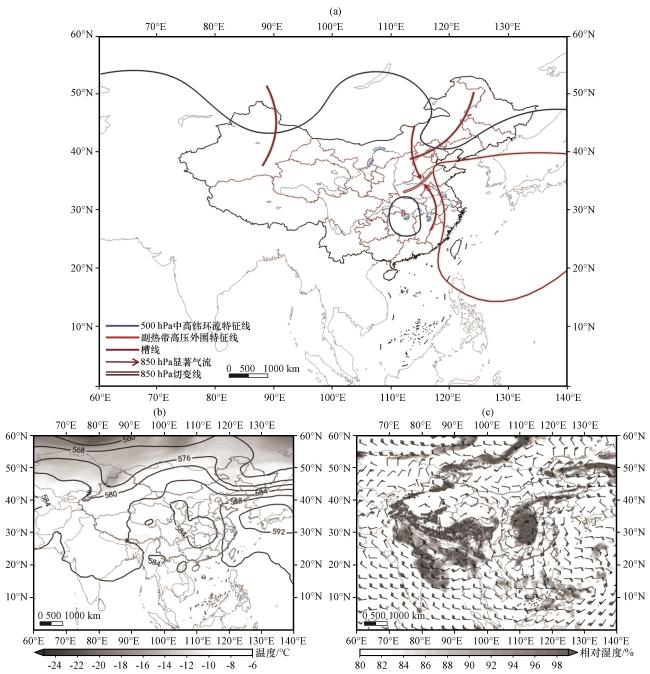
图5 海河流域北上台风型天气学模型(a); 1996年8月3日08:00 500 hPa位势高度场(黑色等值线, 单位: dagpm)和温度(阴影, 单位: ℃)(b); 700 hPa风场(风向杆, 单位: m·s-1)和相对湿度(阴影, 单位: %, 显示部分为相对湿度大于80%的区域)(c)Fig.5 Synoptic model of northward typhoon pattern in the Haihe River Basin (a); 500 hPa potential height field (black contour, unit: dagpm) and temperature (shaded, unit: °C)(b); 700 hPa wind field (wind direction rod, unit: m·s-1) and relative humidity (shaded, unit: %, display part is relative humidity greater than 80%)(c) at 08:00 on August 3, 1996 |
4.2 东北冷涡+西南涡型
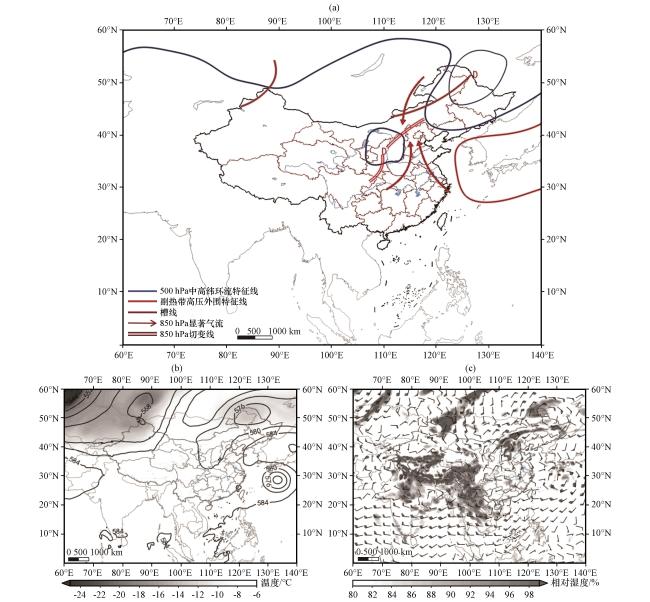
图6 海河流域东北冷涡+西南涡型天气学模型(a); 1963年8月8日08:00 500 hPa位势高度场(黑色等值线, 单位: dagpm)和温度(阴影, 单位: ℃)(b); 700 hPa风场(风向杆, 单位: m·s-1)和相对湿度(阴影, 单位: %, 显示部分为相对湿度大于80%的区域)(c)Fig.6 Synoptic model of northeast cold vortex and southwest vortex pattern in the Haihe River Basin (a); 500 hPa potential height field (black contour, unit: dagpm) and temperature (shaded, unit: °C) (b); 700 hPa wind field (wind direction rod, unit: m·s-1) and relative humidity (color spot, unit: %, display part is relative humidity greater than 80%)(c) at 08:00 on August 8, 1963 |
4.3 低涡型
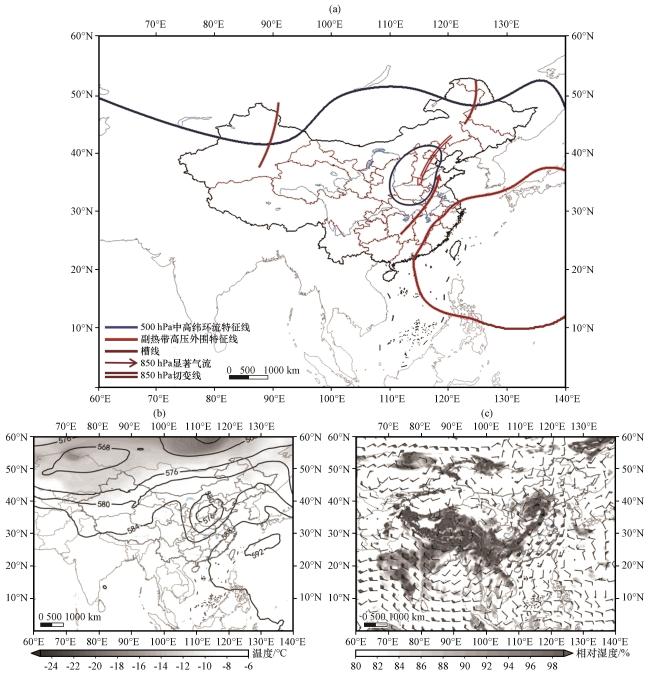
图7 海河流域低涡型天气学模型(a); 2016年7月20日08:00 500 hPa位势高度场(黑色等值线, 单位: dagpm)和温度(阴影, 单位: ℃)(b); 850 hPa风场(风向杆, 单位: m·s-1)和相对湿度(阴影, 单位: %, 显示部分为相对湿度大于80%的区域)(c)Fig.7 Synoptic model of low vortex pattern in the Haihe River Basin (a); 500 hPa potential height field (black contour, unit: dagpm) and temperature (shaded, unit: °C) (b); 700 hPa wind field (wind direction rod, unit: m·s-1) and relative humidity (shaded, unit: %, display part is relative humidity greater than 80%)(c) at 08:00 on July 20, 2016 |
4.4 高空槽型

图8 海河流域高空槽型天气学模型(a); 2018年8月12日08:00 500 hPa位势高度场(黑色等值线, 单位: dagpm)和温度(阴影, 单位: ℃)(b); 850 hPa风场(风向杆, 单位: m·s-1)和相对湿度(阴影, 单位: %, 显示部分为相对湿度大于80%的区域)(c)Fig.8 Synoptic model of high-altitude trough pattern in the Haihe River Basin (a); 500 hPa potential height field (black contour, unit: dagpm) and temperature (shaded, unit: °C) (b); 700 hPa wind field (wind direction rod, unit: m·s-1) and relative humidity (shaded, unit: %, display part is relative humidity greater than 80%)(c) at 08:00 on August 12, 2018 |
4.5 蒙古冷涡型
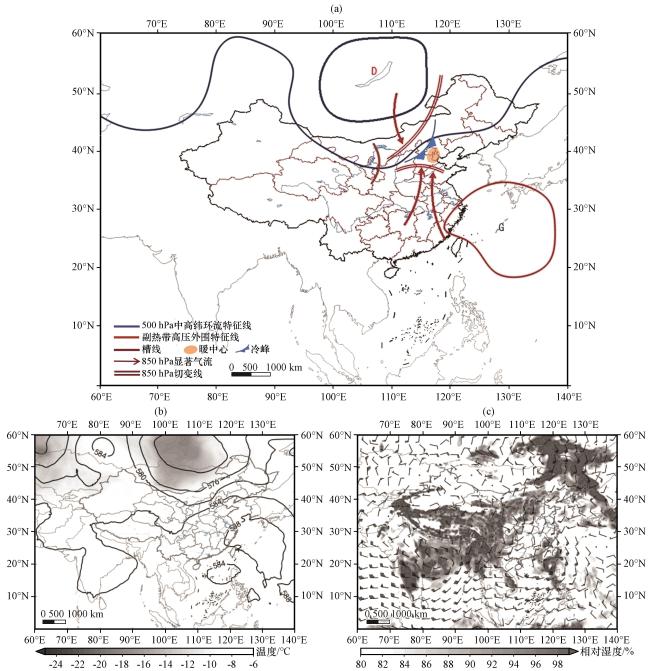
图9 海河流域蒙古冷涡型天气学模型(a); 2012年7月21日08:00 500 hPa位势高度场(黑色等值线, 单位: dagpm)和温度(阴影, 单位: ℃)(b); 850 hPa风场(风向杆, 单位: m·s-1)和相对湿度(阴影, 单位: %, 显示部分为相对湿度大于80%的区域)(c)Fig.9 Synoptic model of Mongolian cold vortex pattern in the Haihe River Basin (a); 500 hPa potential height field (black contour, unit: dagpm) and temperature (shaded, unit: °C) (b); 700 hPa wind field (wind direction rod, unit: m·s-1) and relative humidity (shaded, unit: %, display part is relative humidity greater than 80%)(c) at 08:00 on July 21, 2012 |