
1 引 言
2 观测设备及数据来源
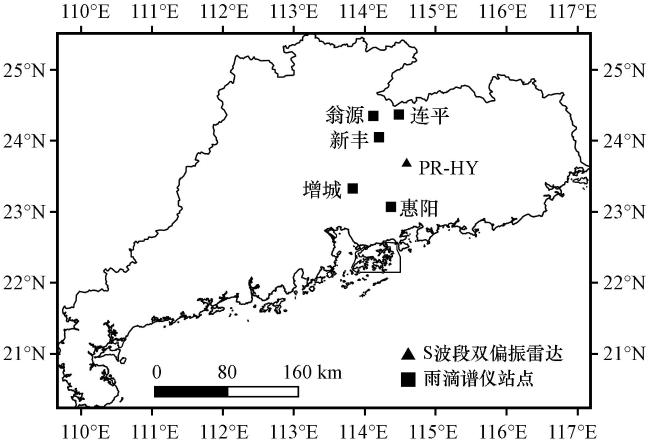
表1 雨滴谱仪站点观测到的6次降水过程相关数据Table 1 The relevant data of six rainfall events observed by the disdrometers |
| 降水过程时间 | 雨滴谱站点 | 有效数据量 | 最大值ZH /dBZ | 平均值ZH /dBZ | 最大值R/(mm·h-1) | 平均值R/(mm·h-1) |
|---|---|---|---|---|---|---|
| 2022年5月10日05:30至11日13:10 | 翁源 | 663 | 55 | 32 | 136 | 6 |
| 连平 | 707 | 50 | 31 | 61 | 5 | |
| 新丰 | 1044 | 56 | 35 | 95 | 8 | |
| 增城 | 422 | 53 | 30 | 88 | 8 | |
| 惠阳 | 324 | 52 | 31 | 66 | 6 | |
| 2022年5月11日20:35至12日12:30 | 翁源 | 363 | 46 | 29 | 18 | 3 |
| 连平 | 356 | 44 | 32 | 15 | 4 | |
| 新丰 | 468 | 53 | 34 | 94 | 11 | |
| 增城 | 371 | 55 | 36 | 147 | 17 | |
| 惠阳 | 514 | 53 | 33 | 79 | 6 | |
| 2022年5月12日18:15至13日23:15 | 翁源 | 69 | 38 | 24 | 6 | 1 |
| 连平 | 105 | 37 | 26 | 6 | 1 | |
| 新丰 | 262 | 44 | 30 | 11 | 3 | |
| 增城 | 438 | 52 | 31 | 60 | 7 | |
| 惠阳 | 554 | 57 | 38 | 134 | 19 | |
| 2022年6月7日00:10 -16:05 | 翁源 | 295 | 57 | 36 | 121 | 13 |
| 连平 | 236 | 46 | 29 | 41 | 3 | |
| 新丰 | 361 | 48 | 31 | 47 | 4 | |
| 增城 | 169 | 54 | 34 | 84 | 6 | |
| 惠阳 | 470 | 53 | 33 | 92 | 6 | |
| 2022年6月8日00:40 -23:20 | 翁源 | 37 | 38 | 23 | 11 | 2 |
| 连平 | 74 | 35 | 23 | 9 | 2 | |
| 新丰 | 79 | 49 | 27 | 36 | 6 | |
| 增城 | 101 | 44 | 26 | 11 | 2 | |
| 惠阳 | 365 | 53 | 29 | 56 | 4 | |
| 2022年6月9日01:40 -23:35 | 翁源 | 385 | 57 | 33 | 137 | 18 |
| 连平 | 367 | 50 | 25 | 51 | 3 | |
| 新丰 | 665 | 55 | 31 | 111 | 8 | |
| 增城 | 418 | 58 | 32 | 186 | 13 | |
| 惠阳 | 167 | 53 | 33 | 89 | 9 |
3 雨滴谱参量及反演方法
3.1 降水微物理参量
3.2 约束性Gamma雨滴谱模型反演算法
3.3 基于三、 六阶矩的双阶矩规范化雨滴谱反演算法
3.4 基于六、 七阶矩的双阶矩规范化雨滴谱反演算法
3.5 评估参数说明
4 评估结果对比分析
4.1 总体评估
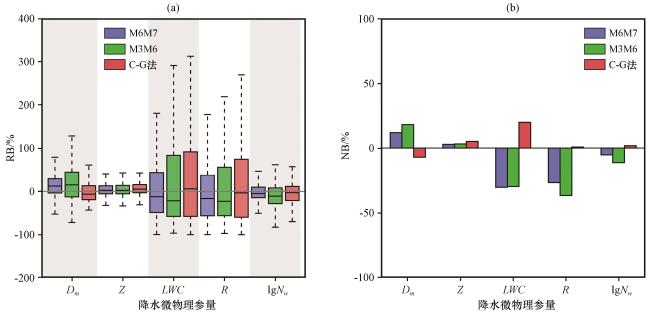
图3 新方法(M6M7法)、 M3M6法与C-G法反演雨滴谱结果对比 通过河源站雷达反演雨滴谱与地面雨滴谱对比得到Dm 、 Z、 LWC、 R、 lgNw 的误差分布; (a)相对偏差RB, (b)相对误差NBFig.3 Comparison of DSD retrieval results by new method (M6M7 method), M3M6 method and C-G method.Distributions of bias on Dm, Z, LWC, R, lgNw, comparing DSDs retrieved using Heyuan radar data to those measured by disdrometer.(a) relative bias RB, (b) normalized bias NB |
表2 M6M7法、 M3M6法和C-G法针对全部降水估测各参量的NETable 2 NE of estimated parameters by the M6M7 method, M3M6 method and C-G method for all rainfall events |
| 方法 | 规范化绝对误差NE/% | ||||
|---|---|---|---|---|---|
| Dm | Z | LWC | R | lgNw | |
| M6M7 | 23.44 | 11.83 | 53.61 | 54.18 | 14.96 |
| M3M6 | 35.45 | 12.59 | 70.42 | 65.01 | 23.32 |
| C-G | 19.7 | 12.64 | 72 | 65.65 | 14.4 |
4.2 按降水强度分段评估
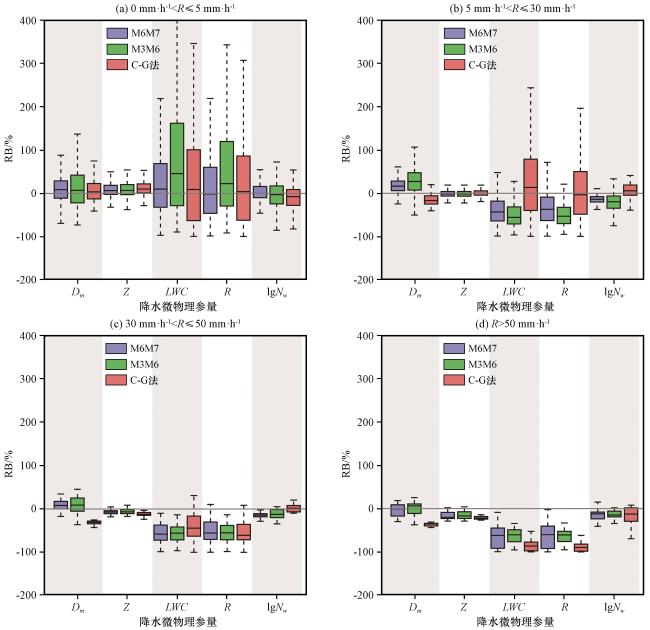
图4 新方法(M6M7法)、 M3M6法与C-G法反演雨滴谱结果对比 通过河源站雷达反演雨滴谱与地面雨滴谱对比得到Dm 、 Z、 LWC、 R、 lgNw 的RB分布, 结果按降水强度进行分组; (a)0 mm·h-1<R≤5 mm·h-1, (b)5 mm·h-1<R≤30 mm·h-1, (c)30 mm·h-1<R≤50 mm·h-1, (d)R>50 mm·h-1Fig.4 Comparison of DSD retrieval results by new method(M6M7 method), M3M6 method and C-G method.Distributions of RB on Dm, Z, LWC, R, lgNw, comparing DSDs retrieved using Heyuan radar data to those measured by disdrometer, the results are classed based on rainfall intensity.(a) 0 mm·h-1<R≤5 mm·h-1, (b) 5 mm·h-1<R≤30 mm·h-1, (c) 30 mm·h-1<R≤50 mm·h-1, (d) R>50 mm·h-1 |
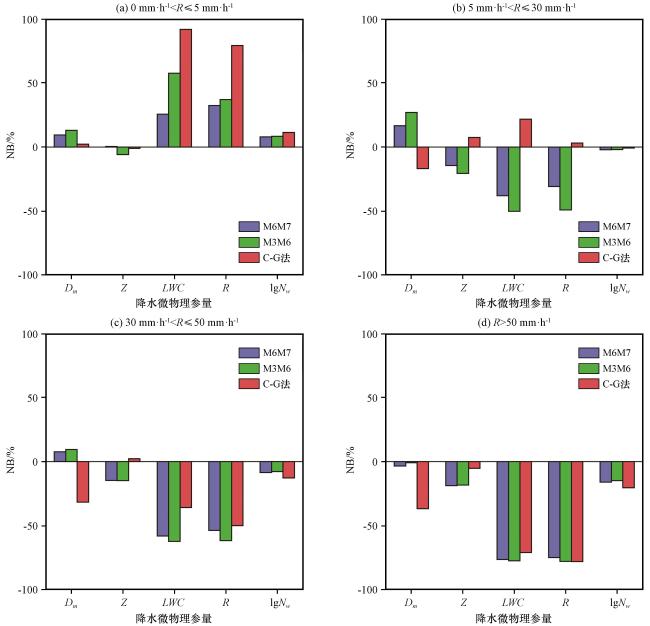
图5 M6M7法、 M3M6法、 C-G法在不同降水强度范围内估测各参量的NB (a)0 mm·h-1<R≤5 mm·h-1, (b)5 mm·h-1<R≤30 mm·h-1, (c)30 mm·h-1<R≤50 mm·h-1, (d)R>50 mm·h-1Fig.5 NB of estimated parameters by the M6M7 method, M3M6 method and C-G method across different rainfall intensity ranges.(a) 0 mm·h-1<R≤5 mm·h-1, (b) 5 mm·h-1<R≤30 mm·h-1, (c) 30 mm·h-1< R≤50 mm·h-1, (d) R>50 mm·h-1 |
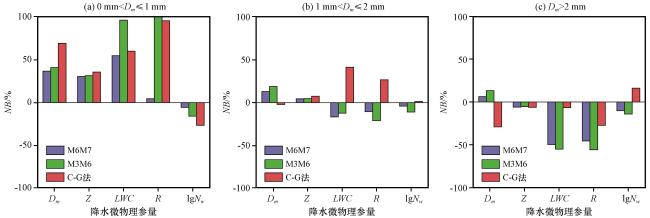
4.3 按粒子大小分段评估
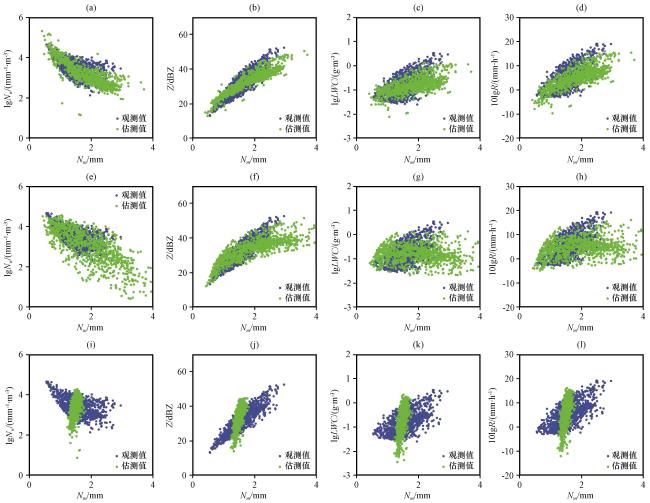
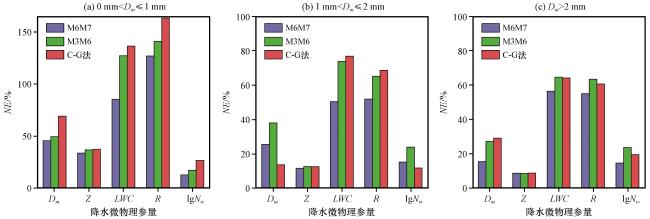
图7 M6M7法、 M3M6法、 C-G法针对不同粒子大小的降水估测各参量的NE (a) 0 mm<Dm ≤1 mm, (b) 1 mm<Dm ≤2 mm, (c) Dm >2 mmFig.7 NE of estimated parameters by the M6M7 method, M3M6 method, and C-G method for rainfall of different particles sizes.(a) 0 mm<Dm ≤1 mm, (b) 1 mm<Dm ≤2 mm, (c) Dm >2 mm |
4.4 个例分析
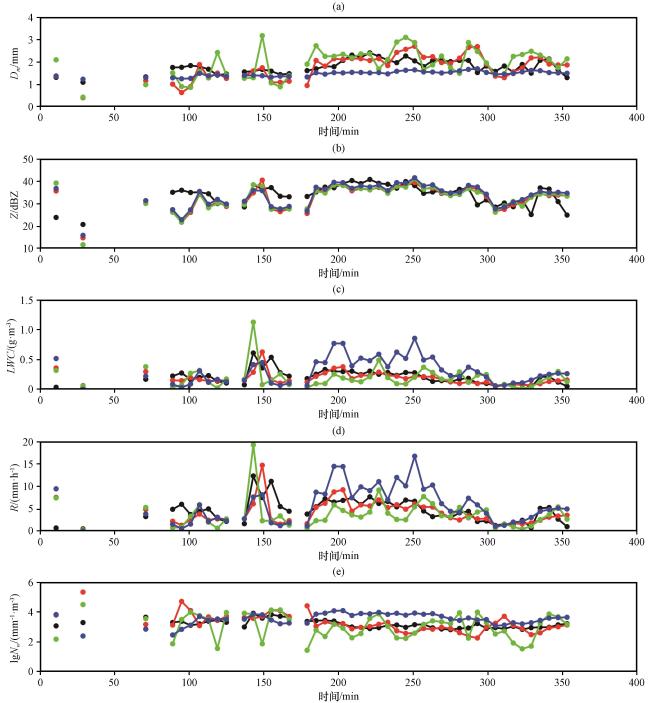
图9 2022年5月12日03:00 -09:40双偏振雷达参量和雨滴谱参量随时间的变化 (a) Dm, (b) Z, (c) LWC, (d) R, (e) lgNw .红、 绿、 蓝线分别表示新方法(M6M7)、 M3M6、C-G算法反演的参量, 黑线表示地面观测的参量Fig.9 Break lines of dual polarization radar parameters and DSD parameters over time from 03:00 to 09:40 on 12 May 2022.(a) Dm, (b) Z, (c) LWC, (d) R, (e) lgNw .Red, green and blue lines represent parameters retrieved by new method (M6M7), M3M6 method and C-G method respectively, while black lines represent parameters observed on the ground |
4.5 综合算法
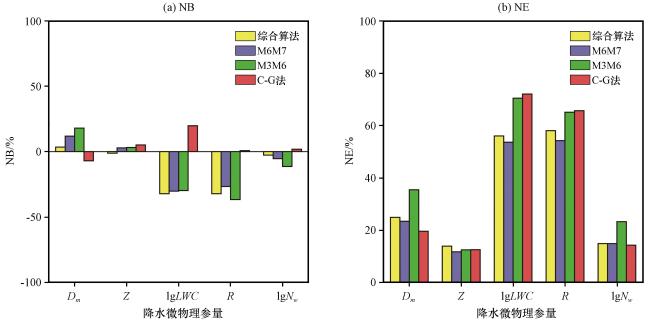
图10 综合算法与M6M7法、 M3M6法、 C-G法反演雨滴谱结果对比 通过河源站雷达反演雨滴谱与地面雨滴谱对比得到Dm 、 Z、 LWC、 R、 lgNw 的误差分布, (a)NB, (b)NEFig.10 Comparison of DSD retrieval results by comprehensive algorithm and M6M7 method, M3M6 method, C-G method.Distributions of bias on Dm, Z, LWC, R, lgNw, comparing DSDs retrieved using Heyuan radar data to those measured by disdrometer.(a) NB, (b) NE |
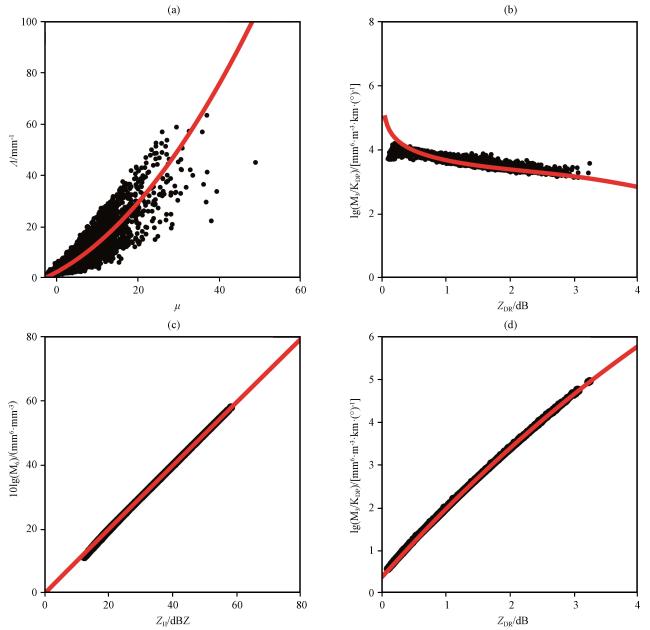
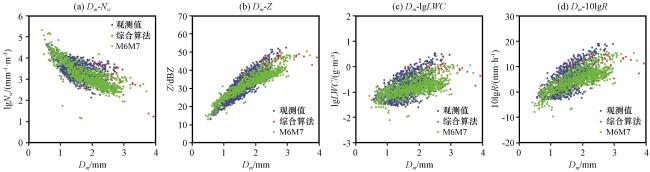
图11 基于综合算法和M6M7法的降水微物理参量观测值与反演值散点分布对比 (a) Dm -Nw, (b) Dm -Z, (c) Dm -lgLWC, (d) Dm -10lgRFig.11 Scatter plot of observed and retrieved values of precipitation microphysical parameters by the comprehensive algorithm and M6M7 method.(a) Dm -Nw, (b) Dm -Z, (c) Dm -lgLWC, (d) Dm -10lgR |