
1 引言
2 观测试验与方法
2.1 研究区域
表1 本文所用地表通量观测设备信息Table 1 Information of flux observation equipments used in this study |
| 站点 | 观测设备 | 型号 | 产地 | 高度/距离(m) | 时间段 |
|---|---|---|---|---|---|
| 阿柔站 | 双波段闪烁仪 | BLS900, Scintec | 德国 | 有效高度: 13.54 | 2019年至今 |
| MWSC-160, RPG | 光径长度: 2390 | ||||
| RRS460, 雨根公司 | 中国 | 有效高度: 13.54 | |||
| RRMW940, 雨根公司 | 光径长度: 2390 | ||||
| 涡动相关仪 | CSAT3&Li7500A | 美国 | 架高: 3.5 | 2016年至今 | |
| CSAT3&EC155 | 美国 | 架高: 4.0 | 2024年6月至今 | ||
| 大满站 | 双波段闪烁仪 | BLS900, Scintec | 德国 | 有效高度: 23.92 | 2022年至今 |
| MWSC-160, RPG | 光径长度: 1854 | ||||
| RRS460, 雨根公司 | 中国 | 有效高度: 23.92; 光径长度: 1854 | |||
| 涡动相关仪 | CSAT3&Li7500A | 美国 | 架高: 4.5 | 2012年至今 | |
| CSAT3&EC155 | 美国 | 架高: 3.5 | 2019年至今 |
表2 研制闪烁仪设备参数Table 2 Developed scintillation meter equipment parameter table |
| 仪器 | 参数 | 发射端 | 接收端 |
|---|---|---|---|
| RRS460 近红外闪烁仪 | 发射波长 | 880 nm | - |
| 发射功率 | 最大100 mW | - | |
| 发射方式 | 连续可调电流 | - | |
| 发射源 | 点光源 | - | |
| 孔径直径 | 150 mm | 150 mm | |
| 工作电压 | 10~15 VDC | 10~15 VDC | |
| 信号输出 | - | 数字信号 | |
| 测量路径 | 500~5000 m | ||
| 功耗 | 最大6 W, 平均3 W | 1.8 W | |
| 工作温度 | -20~50 ℃ | -20~50 ℃ | |
| 工作湿度 | 0~100%(无冷凝) | 0~100%(无冷凝) | |
| 尺寸 | 430 mm×210 mm×300 mm | 430 mm×210 mm×300 mm | |
| 重量 | 10.8 kg | 10.8 kg | |
| RRMW940微波闪烁仪 | 发射频率 | 94 GHz | - |
| 发射功率 | >25 mW | - | |
| 天线增益 | >50 dB | - | |
| 温度稳定性 | ≤0.03 K | ≤0.0 3K | |
| 孔径直径 | 330 mm | 330 mm | |
| 工作电压 | 11~13 VDC | 11~13 VDC | |
| 信号输出 | - | 模拟信号 | |
| 测量路径 | 500~5000 m | ||
| 功耗 | 39.6 W(最大) 13 W(平均) | 39.6 W(最大) 13 W(平均) | |
| 工作温度 | -20~50 ℃ | -20~50 ℃ | |
| 工作湿度 | 0~100%(无冷凝) | 0~100%(无冷凝) | |
| 尺寸 | 376 mm×465 mm×456 mm | 376 mm×465 mm×456 mm | |
| 重量 | 12.6 kg | 12.6 kg |
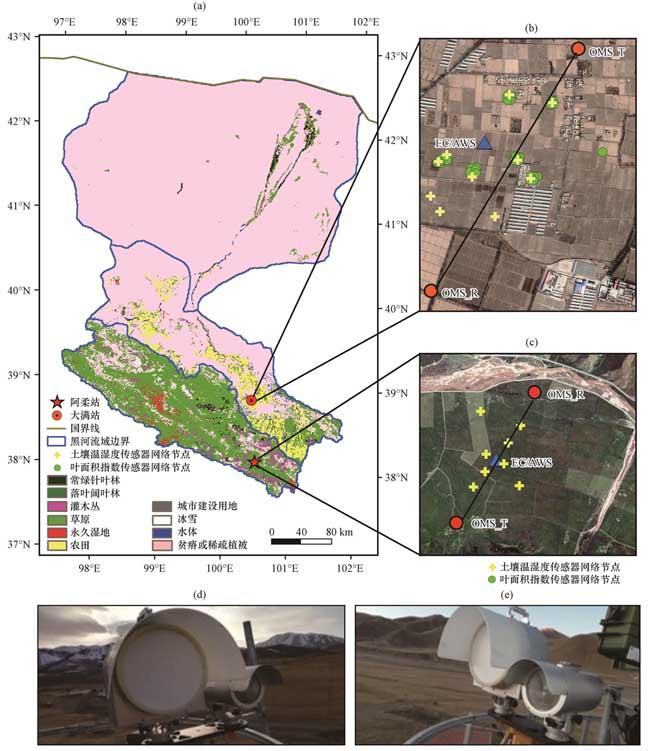
图1 研究区概况(a)研究区域; (b)大满站; (c)阿柔站; (d)阿柔站的研制闪烁仪发射端; (e)阿柔站的研制闪烁仪接收端 Fig.1 Overview of the study area.(a) schematic of the study area, (b) schematic of Daman station, (c) schematic of A’rou station, (d) transmitter of the developed scintillometer at A’rou station, (e) receiver of the developed scintillometer at A’rou station |
2.2 数据处理与质量控制
2.2.1 闪烁仪
2.2.2 涡动相关仪
2.2.3 自动气象站
2.3 评价方法
3 结果分析
3.1 研制闪烁仪原始数据的质量检验
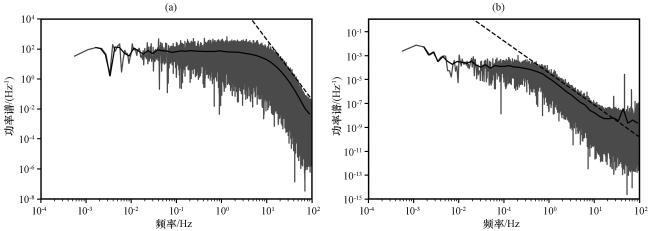
图3 2020年6月2日10:00 -10:30阿柔站研制LAS(a)和MWS(b)的功率谱灰色实线表示原始数据计算出的功率谱, 黑色实线表示经平滑后的功率谱, 虚线表示理论功率谱, LAS图中虚线斜率为-12/3, MWS图中虚线斜率为-8/3 Fig.3 Power spectra of developed LAS (a) and MWS (b) at A’rou Station.The gray solid line represents the power spectrum calculated from the raw data, the black solid line represents the smoothed power spectrum, and the dashed line represents the theoretical power spectrum; in the LAS graph, the dashed line has a slope of -12/3, and in the MWS graph, the dashed line has a slope of -8/3 |
3.2 研制闪烁仪的性能分析
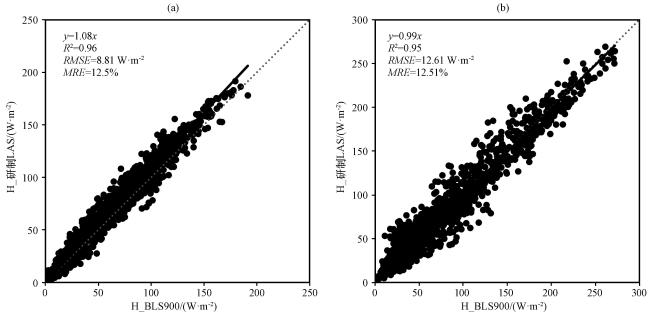
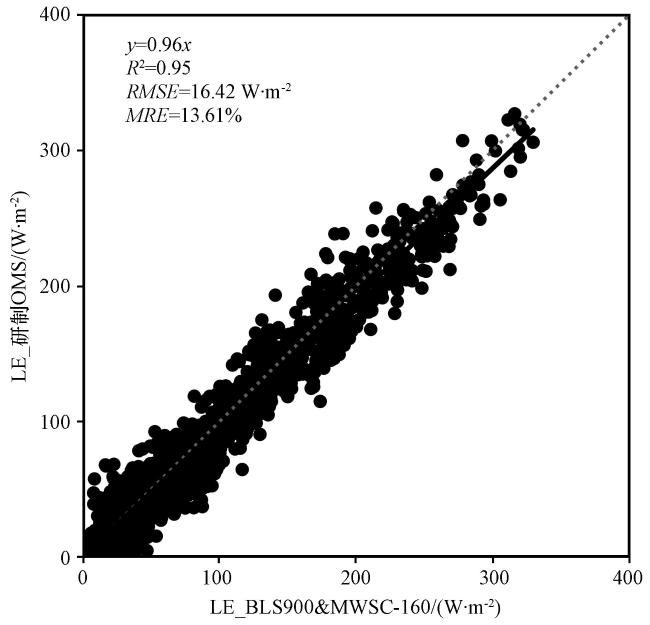
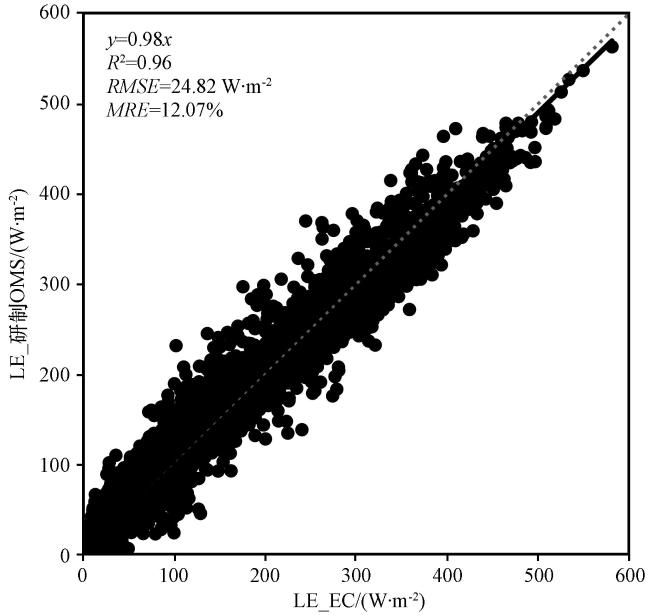
3.2.1 设备的观测精度
3.2.2 设备的稳定性
表3 2016-2022年阿柔站研制闪烁仪的有效数据率Table 3 Effective data rate of the developed scintillometer at A’rou Station, 2016-2022 |
| 闪烁仪 | 2016 | 2017 | 2018 | 2019 | 2020 | 2021 | 2022 |
|---|---|---|---|---|---|---|---|
| 研制LAS | 80.9% | 94.5% | 86.6% | 92.9% | 89% | 98.1% | 92.6% |
| 德国LAS | 68.0% | 57.3% | 81.9% | 57.5% | 62.1% | 57.7% | 49.6% |
| 研制OMS | - | - | - | - | 96.9% | 96.6% | 99.9% |
| 德国OMS | - | - | - | - | 43.6%(1 -7月) | - | 41.4%(6 -12月) |
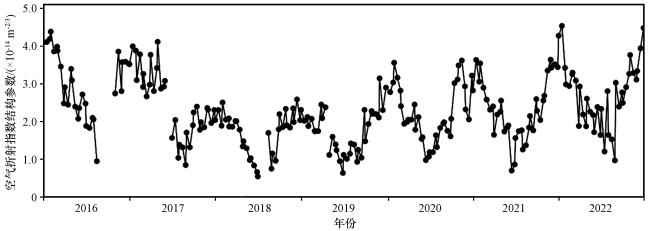
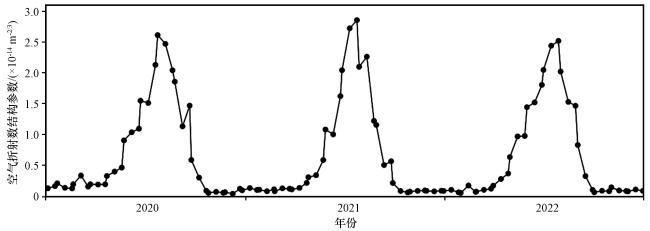
图7 2016 -2022年阿柔站研制近红外闪烁仪的 (10日均值)Fig.7 Ten-day average of observed by the near-infrared scintillometer developed at A’rou Station, 2016 -2022 |
3.2.3 设备的环境适应性
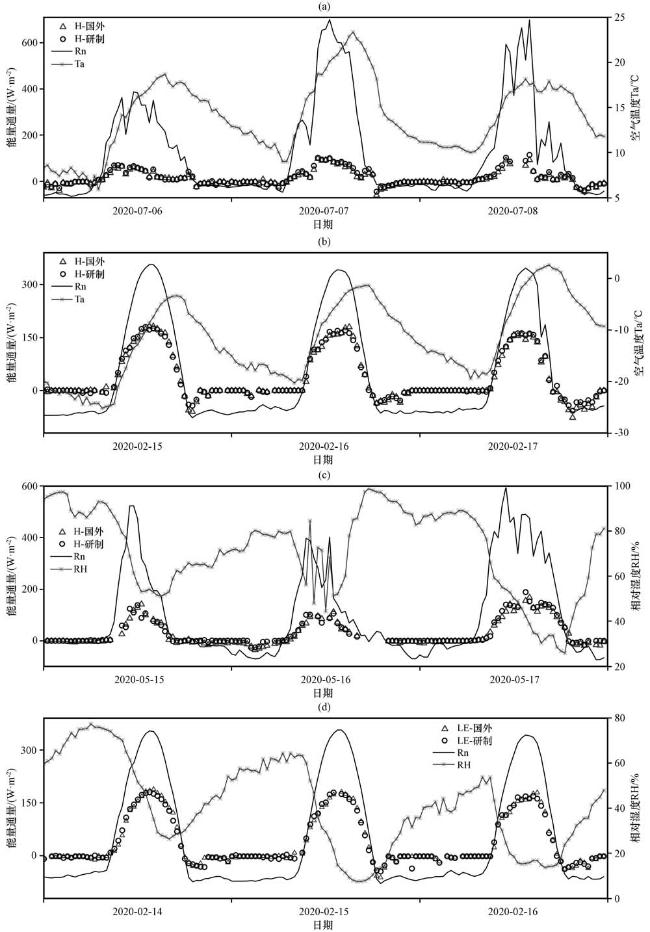
图9 阿柔站研制OMS与德国OMS在极端条件下感热通量H观测值的比较(H>0)(a)高温条件, (b)低温条件, (c)高湿条件, (d)低湿条件 Fig.9 Comparison of sensible heat flux observed by A’rou station's developed OMS and Germany's OMS under extreme conditions (H>0).(a) High temperature condition, (b) Low temperature condition, (c) High humidity condition, (d) Low humidity condition |
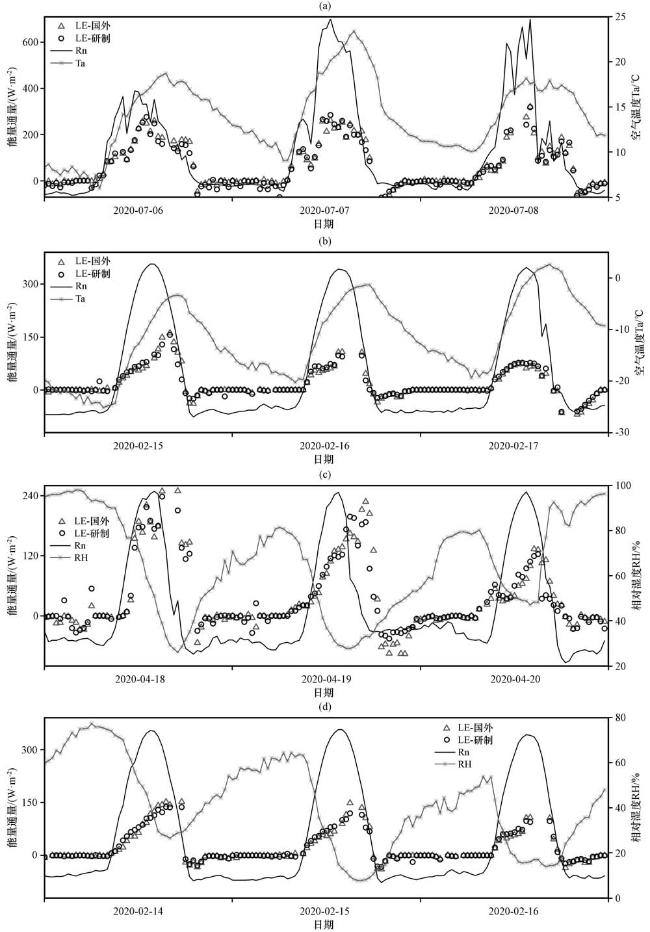
图10 阿柔站研制OMS与德国OMS在极端条件下潜热通量LE观测值的比较(LE>0)(a)高温条件, (b)低温条件, (c)高湿条件, (d)低湿条件 Fig.10 Comparison of latent heat flux observed by A’rou station's developed OMS and Germany's OMS under extreme conditions (LE>0).(a) High temperature condition, (b) Low temperature condition, (c) High humidity condition, (d) Low humidity condition |
3.3 研制闪烁仪观测水热通量变化特征的分析
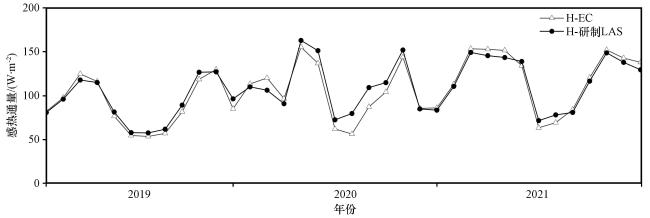
图11 阿柔站2019 -2021年研制近红外闪烁仪与涡动相关仪的长时序感热通量H观测值的比较(H>0, EBR>0.75)Fig.11 Comparison of long-term series of sensible heat flux observed by A’rou Station's near-infrared scintillometer and eddy covariance instrument, 2019 -2021 (H>0, EBR>0.75) |