
1 引言
2 资料
2.1 资料及方法
2.2 ERA5检验
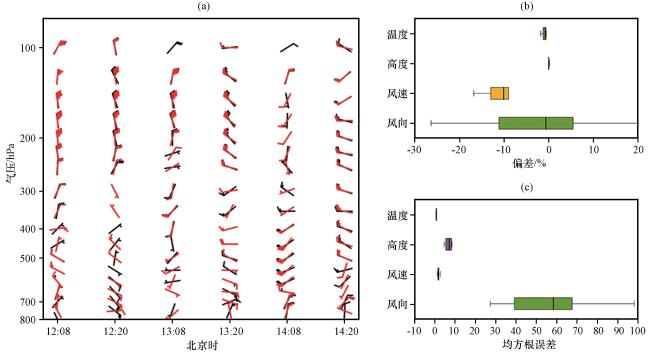
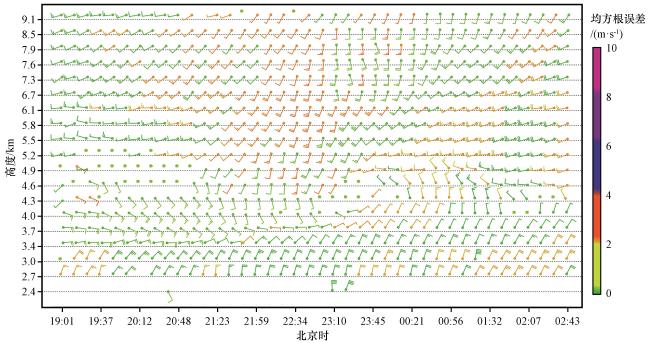
图1 12日08:00至14日20:00榆中站探空实况与ERA5对比及评估结果(a)榆中站各气压层风向风速对比(黑色风向杆为ERA5, 红色为探空资料); (b)榆中站ERA5与探空实况的温度、高度、风速、风向偏差; (c)榆中站ERA5与探空实况的温度、高度、风速、风向均方根误差; 图(c)中风速: m·s-1, 风向: (°), 温度: ℃, 高度: m Fig.1 Comparison and evaluation results of sounding observations and ERA5 data in Yuzhong Station from 08:00 on 12 to 20:00 on 14 August.(a) comparison of wind direction and speed of each pressure layer in Yuzhong Station, black wind pole is ERA5, red is sounding observation data; (b) deviation of temperature, altitude, wind speed and wind direction between ERA5 and sounding observation in Yuzhong Station; (c) root-mean-square error of temperature, altitude, wind speed and wind direction between ERA5 and sounding observation in Yuzhong Station.In Figure (c), the unit of wind speed is m·s-1, the unit of wind direction is (°), the unit of temperature is ℃, and the unit of height is m |
3 降水实况和天气背景
3.1 降水实况
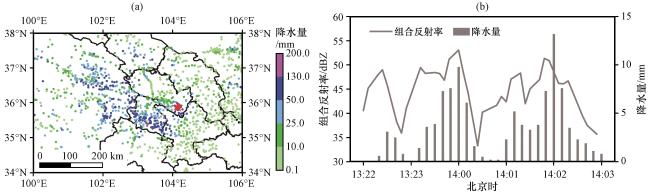
图2 2022年8月13日20:00至14日20:00累积降水量分布(a, 单位: mm; 星号为榆中站位置), 榆中站组合反射率和10 min降水量序列图(b)Fig.2 Cumulative precipitation distribution (a, unit: mm, star symbol is the location of Yuzhong Station), Combined reflectance intensity and 10-minute rainfall series of Yuzhong Station (b) from 20:00 on 13 to 20:00 on 14 August, 2022 |
3.2 天气形势
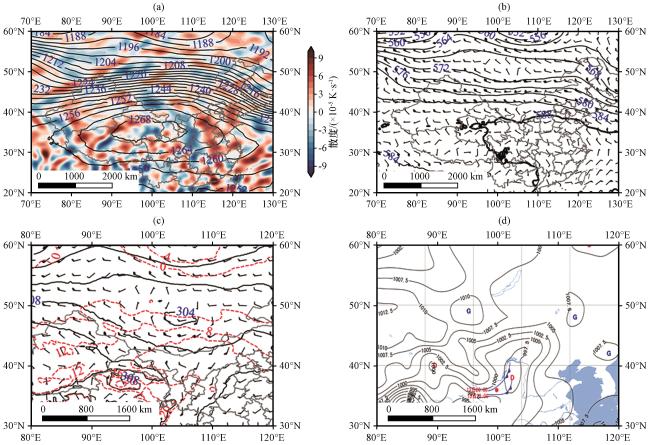
图3 13日20:00的200 hPa (a)、500 hPa (b)、700 hPa (c)高空形势场(黑色实线为等高线, 红色虚线为等温线, 阴影为散度场), 及地面气压场和冷锋(d, 黑色实线为等压线, 蓝色锯齿线为冷锋位置)Fig.3 Upper circulation situation field (black solid line is the isohypse, dotted red line is isotherm, and shadow is divergence) on 20:00 of 200 hPa (a), 500 hPa (b), 700 hPa (c) and surface pressure and cold front (d, black contours is the isobar line, and the blue jagged line is the cold front) |
3.3 雷达观测特征
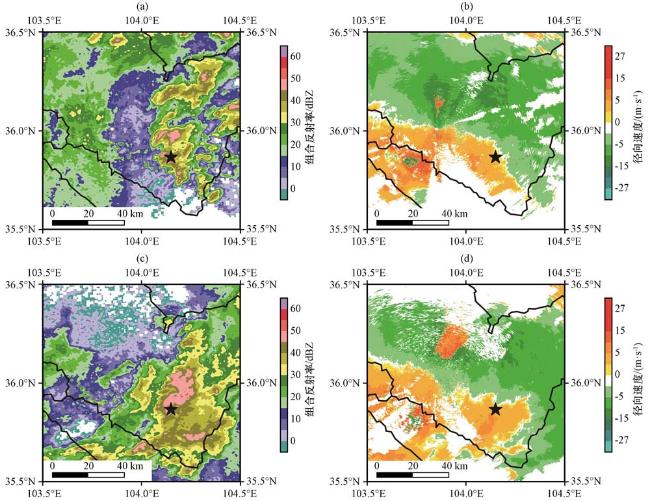
图4 雷达组合反射率因子(a, c, 单位: dBZ)和1.5°仰角径向速度(b, d, 单位: m·s-1)(a, b) 13日23:04, (c, d) 14日01:49; 黑色星号为榆中站 Fig.4 Radar combined reflectance factor (a, c, unit: dBZ) and 1.5° elevation radial velocity (b, d, unit: m·s-1).(a, b) 23:04 on 13 August, (c, d) 01:49 on 14 August.The black asterisk is the location of Yuzhong station |
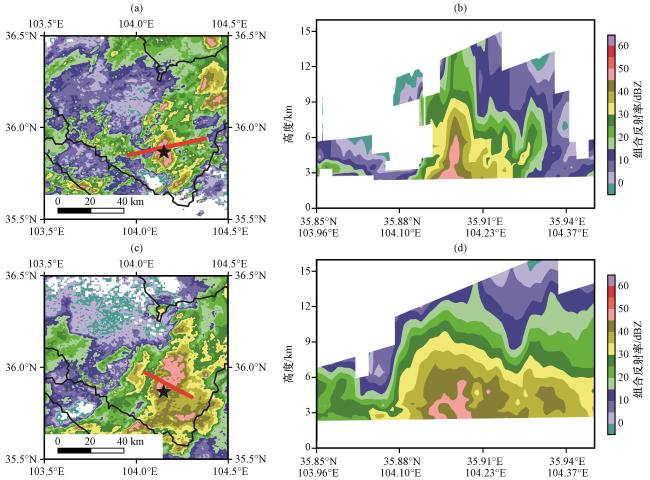
图5 雷达组合反射率(a, c)和剖面(b, d)(a, b) 8月13日23:51, (c, d) 8月14日01:49; 红线位置为剖面位置, 黑色星号为榆中站 Fig.5 Radar combined reflectance (a, c) and profile (b, d).(a, b) 23:51 on 13 August, (c, d) 01:49 on 14 August.Red line position is the profile position, and black asterisk is the location of Yuzhong station |
3.4 环境条件背景
3.4.1 水汽条件
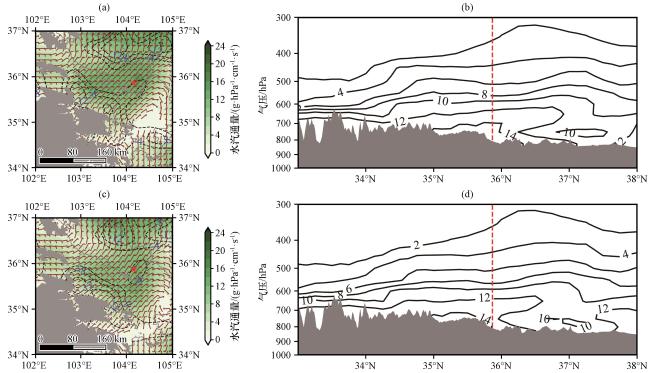
图7 2022年8月13日23:00(a, b)、14日01:00(c, d)700 hPa水汽通量(阴影, 单位: g·hPa-1·cm-1·s-1)、水汽通量散度(等值线, 单位: ×10-5 m-2·s-1)和水平风(风羽, 单位: m·s-1)(a, c), 比湿(等值线, 单位:g·kg-1)沿104.25°E的纬度-高度剖面(b, d)灰色阴影部分为700 hPa高度对应的地形; 红色虚线为榆中站所在位置, 灰色阴影为地形(b, d, 下同) Fig.7 700 hPa vapor flux (green shadow, unit: g·hPa-1·cm-1·s-1), vapor flux divergence (red contours, unit: ×10-5 m-2·s-1) and horizontal wind (barb, unit: m·s-1) (a, c), and specific humidity (black contours, unit: g·kg-1) along 104.25°E latitudinal-altitude profile (b, d) at 23:00 on 13 (a, b) and 01:00 on 14 (c, d) August 2022.The grey shaded is the terrain above 700 hPa, the red dotted line is the location of Yuzhong station (the same below), grey shaded is the terrain (b, d, the same as after) |
3.4.2 垂直运动
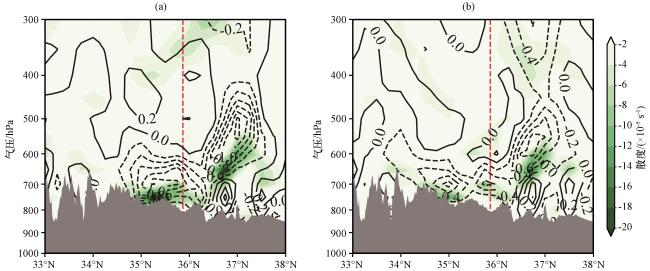
图8 2022年8月13日23:00(a)、14日01:00(b)垂直速度(等值线, 单位: Pa·s-1)及散度(阴影区, 单位: ×10-5 s-1)沿104.25°E的纬度-高度剖面Fig.8 vertical velocity (black dot contours, unit: Pa·s-1) and divergence (green shadow, unit: ×10-5 s-1) of Latitude-altitude profile along 104.25°E at 20:00 on 13 August (a) and 01:00 on 14 August (b) 2022 |
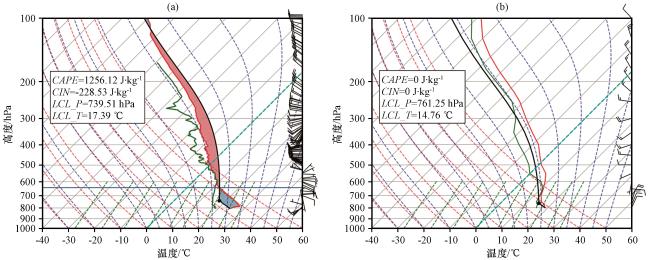
3.4.3 探空分析
4 地形影响和不稳定机制分析
4.1 锋生次级环流
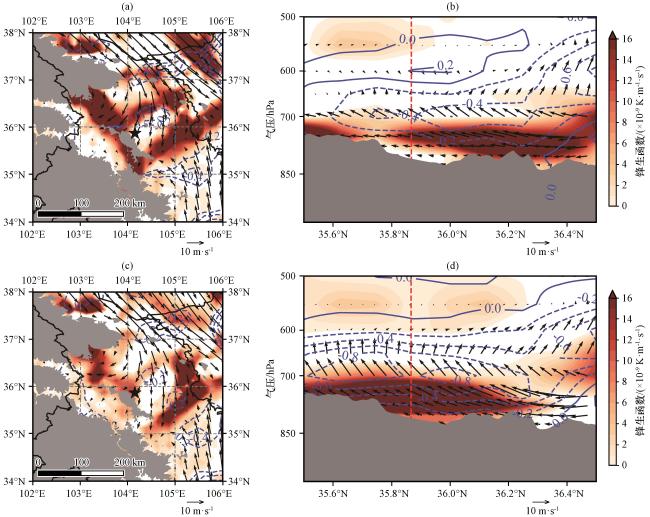
图10 2022年8月13日23:00 (a, b)、14日01:00 (c, d)锋生函数800 hPa水平分布(a, c)及沿104.15°E剖面(b, d)红色阴影为锋生函数(单位: ×10-9 K·m-1·s-1); 灰色阴影为地形; (a, c)中箭头为800 hPa水平风(单位: m·s-1), (b, d)中箭头为径向风v(单位: m·s-1)和垂直风ω(单位: -0.1 Pa·s-1)的合成 Fig.10 The horizontal distribution of frontogenetic function on 800 hPa (a, c) and profile of frontogenetic function along 104.15°E (b, d) at 23:00 on 13 (a, b) and 01:00 on 14 (c, d) August 2022.The red shadow frontogenetic function (unit: ×10-9 K·m-1·s-1), grey shadow is the terrain.In Fig.10 (a) and (c), arrows are horizontal wind on 800 hPa (unit: m·s-1), in (b) and (d) are synthesis of radial wind v (unit: m·s-1) and vertical wind (unit: -0.1 Pa·s-1) |
4.2 冷空气山前堆积
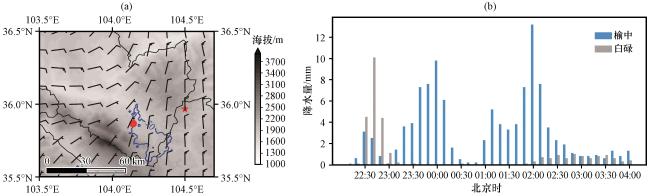
图11 800 hPa水平风场(风羽, 单位: m·s-1)和地形高度(单位: m, 灰色阴影)以及50 mm以上降水区域(蓝色等值线)分布(a), 13日22:00至14日04:00榆中站和白碌站逐10 min降水量分布(b)红色圆点为榆中站位置, 红色星号为白碌站位置 Fig.11 800 hPa horizontal wind (barb, unit: m·s-1) and terrain height (unit: m, grey shadow), precipitation area above 50 mm (blue contour) distribution (a), and 10-minute precipitation distribution at Yuzhong station and Bailu station from 22:00 on 13 to 04:00 on 14 August 2022 (b).Red dot is the location of Yuzhong station, red star symbol is the location of Bailu station |
4.3 不稳定机制
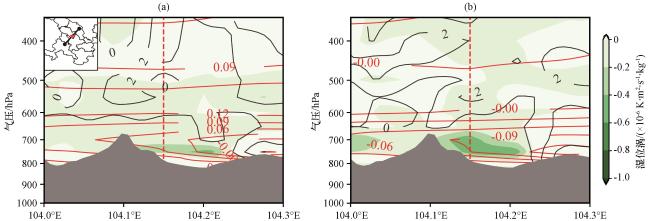
图12 沿图(a)左上角所示直线的剖面(a)13日23:00, (b)14日01:00; 灰色阴影为地形, 红色虚线为榆中站所在位置, 填色为湿位涡(单位: PVU, 1 PVU=1×10⁻⁶ K·m2·s-1·kg-1); 红色等值线为 (单位: K·hPa-1); 黑色等值线为绝对涡度(单位: s-1) Fig.12 Profile along the line shown in the top left corner of Figure (a).(a) 23:00 on 13 August, (b) 01:00 on 14 August.Gray shadow is the terrain, red dashed line is the location of Yuzhong Station, filling color is wet potential vortex (unit: PVU, 1 PVU=1×10⁻⁶ K·m2·s-1·kg-1), red contour is (unit: K·hPa-1), black contour is absolute vorticity (unit: s-1) |
5 讨论
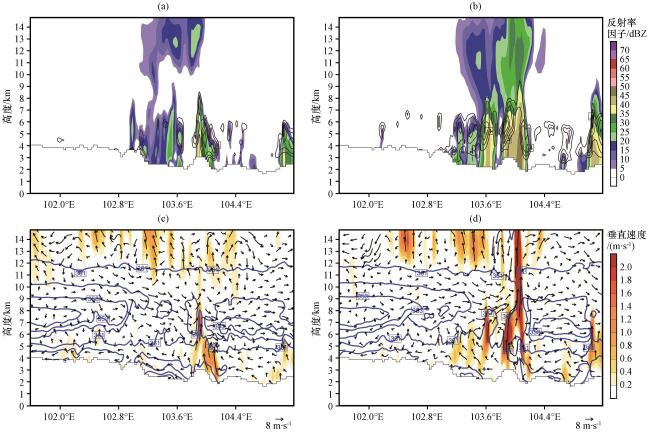
图13 2022年8月13日23:00(a, c)、14日01:00(b, d)榆中站(104.1°E, 35.87°N)上空经向垂直剖面(折线为地形高度, 单位: km)反射率因子(填色, 单位: dBZ)和云水混合比(等值线, 间隔0.2, 单位: kg·kg-1)(a, b), 及假相当位温(等值线, 间隔4, 单位: K)及垂直速度(填色, 单位: m·s-1)(c, d)Fig.13 Vertical cross-section of Yuzhong station (104.1°E, 35.87°N) with contours of terrain height (unit: km), reflectivity factors (shading, unit: dBz) and cloud water mixing ratio (contours, interval of 0.2, unit: kg·kg-1) (a, b); and pseudo equivalent potential temperature (contours, interval of 4, unit: K) and vertical velocity (shading, unit: m·s-1) (c, d) at 23:00 on 13 (a, c) and 01:00 on 14 (b, d) August 2022 |