
1 引言
2 研究区域、数据来源与方法介绍
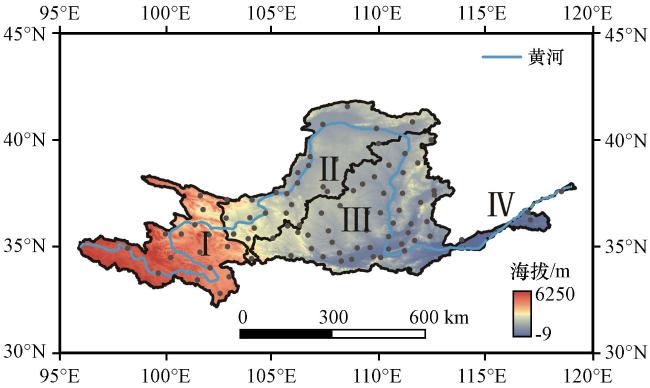
2.1 研究区域
2.2 数据介绍
2.2.1 观测数据
2.2.2 再分析资料
2.2.3 第六次国际耦合模式比较计划(CMIP6)数据
表1 本研究所使用的CMIP6模式Table 1 The CMIP6 modes used in this study |
| 序号 | 模式名称 | 研究机构 | 空间分辨率 |
|---|---|---|---|
| 1 | ACCESS-CM2 | 澳大利亚气候与环境研究中心 | 144×192 |
| 2 | CanESM5 | 加拿大气候模拟和分析中心 | 64×128 |
| 3 | CESM2 | 美国国家大气研究中心 | 192×288 |
| 4 | GFDL-ESM4 | 美国国家海洋和大气管理局 | 180×288 |
| 5 | KACE-1-0-G | 韩国海洋科学技术研究所 | 144×192 |
| 6 | MCM-UA-1-0 | 美国亚利桑那大学 | 80×96 |
| 7 | MRI-ESM2-0 | 马克斯·普朗克气象研究所 | 160×320 |
| 8 | MIROC6 | 日本推进气候模式综合研究计划 | 128×256 |
| 9 | NASA-GISS | 美国国家航空航天局 | 90×144 |
| 10 | NUIST-NESM3 | 南京信息工程大学 | 96×192 |
2.3 统计降尺度方法介绍
2.3.1 大尺度预报因子区域的选择
2.3.2 大尺度预报因子的选择
2.3.3 基于EOF分析的逐步多元线性回归法
2.3.4 基于LightGBM的统计降尺度方法
2.3.5 数据标准化及训练集与测试集的划分
3 结果分析
3.1 黄河流域温度与降水的EOF分析
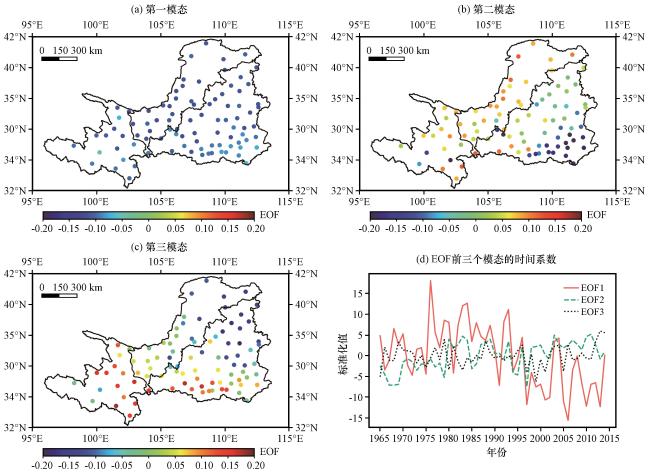
图2 1965-2014年黄河流域 (源区、上游、中游)夏季温度场EOF分解的前三个特征向量空间分布(a, b, c)与时间系数(d)(a)第一模态, (b)第二模态, (c)第三模态, (d)时间系数 Fig.2 The spatial distribution of the first three EOF eigenvectors (a, b, c) of summer temperature in the YRB (the source region, the upper reaches and the middle reaches) and time coefficients (d) from 1965 to 2014.(a) the first eigenvector, (b) the second eigenvector, (c) the third eigenvector and (d) the corresponding standardized time series |
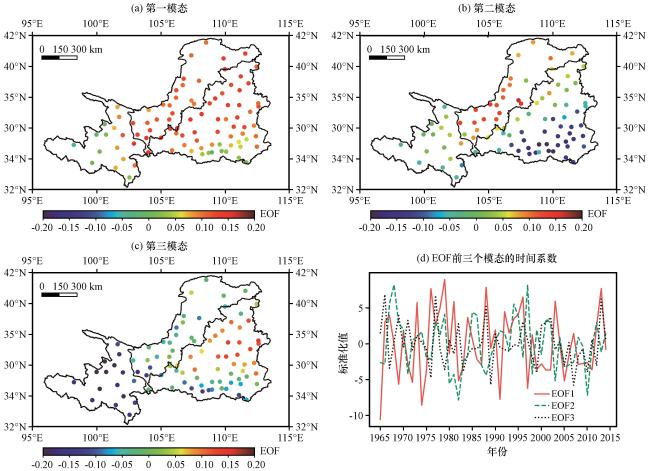
图3 1965-2014年黄河流域(源区、上游、中游)夏季降水场EOF分解的前三个特征向量空间分布(a, b, c)与时间系数(d)(a)第一模态, (b)第二模态, (c)第三模态, (d)时间系数 Fig.3 The spatial distribution of the first three EOF eigenvectors (a, b, c) of summer precipitation in the YRB (the source region, the upper reaches and the middle reaches) and time coefficients (d) from 1965 to 2014.(a) the first eigenvector, (b) the second eigenvector, (c) the third eigenvector and (d) the corresponding standardized time series |
3.2 潜在预报因子的选取
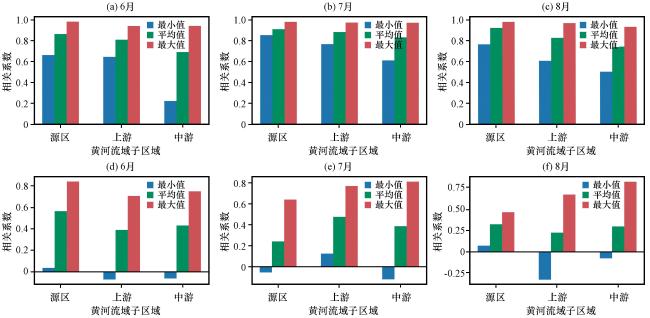
图4 温度降尺度值与观测值站点间相关系数的最小值, 平均值和最大值(a~c)使用了ERA5提供的预报因子, (d~f)使用了CMIP6提供的预报因子, 降尺度模型为LightGBM Fig.4 Minimum, average and maximum correlation coefficients between temperature downscaling values and observed values at each station.(a~c) used the predictors provided by ERA5, (d~f) used the predictors provided by CMIP6, and the downscaling model was LightGBM |
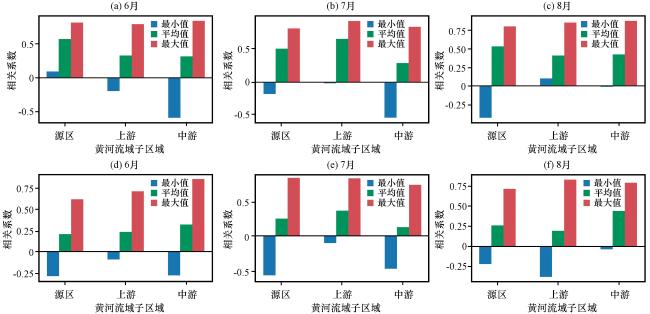
图5 降水降尺度值与观测值站点间相关系数的最小值, 平均值和最大值(a~c)使用了ERA5提供的预报因子, (d~f)使用了CMIP6提供的预报因子, 降尺度模型为LightGBM Fig.5 Minimum, average and maximum correlation coefficients between precipitation downscaling values and observed values at each station.(a~c) used the predictors provided by ERA5, (d~f) used the predictors provided by CMIP6, and the downscaling model was LightGBM |
3.3 LightGBM与传统方法对气温降尺度性能的比较
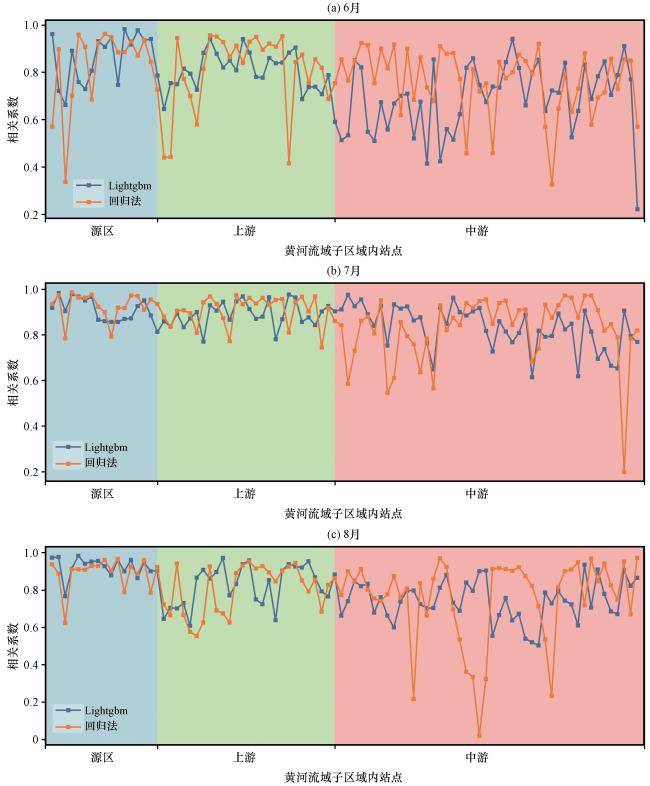
图6 黄河流域内90个站点温度降尺度值与观测值的相关系数(a)6月, (b)7月, (c)8月; 图中蓝色区域内涵盖了源区16个站点, 绿色区域涵盖了上游26个站点, 红色区域涵盖了中游48个站点 Fig.6 The correlation coefficient between temperature downscaling values and observed values at 90 stations in the Yellow River Basin.(a) June, (b) July, (c) August.The blue area covers 15 stations in the source area, the green area covers 26 stations in the upper reaches, and the red area covers 49 stations in the middle reaches |
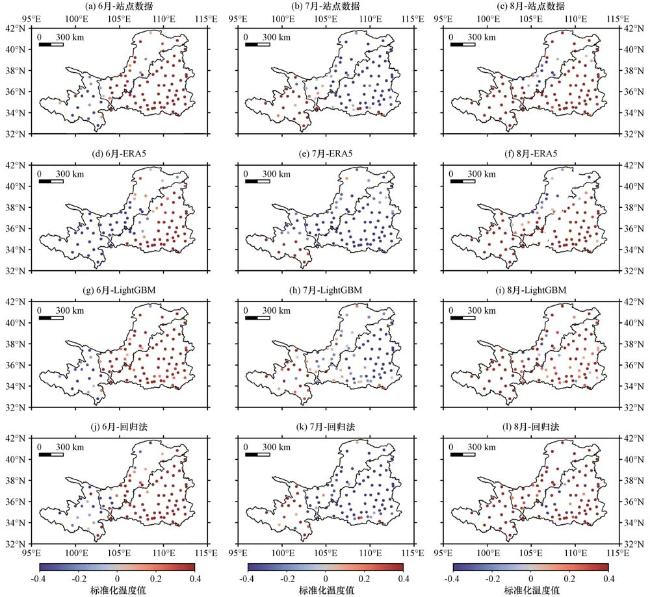
图8 1972年6月(左)、7月(中)、8月(右)各站点温度标准化后的空间分布(a~c) 是站点数据, (d~f) 是ERA5再分析资料, (g~i) 是由LightGBM得到的统计降尺度数据, (j~l) 是由回归法得到的统计降尺度数据 Fig.8 The spatial distribution of temperature at each site after standardization in June (left), July (medium), and August (right) 1972.(a~c) are station data, (d~f) are ERA5 reanalysis data, (g~i) are statistical downscaling data obtained by LightGBM, and (j~l) are statistical downscaling data obtained by regression method |
3.4 LightGBM与传统方法对降水降尺度性能的比较
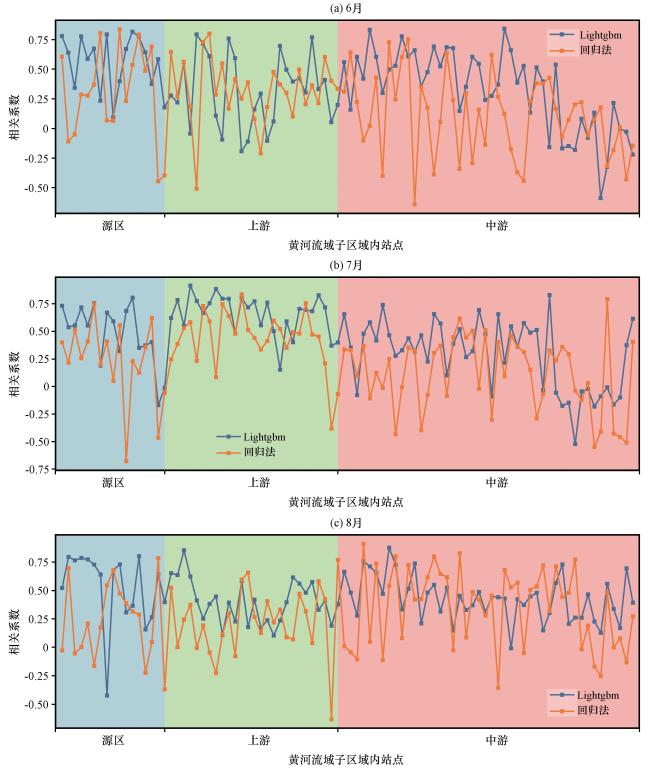
图9 黄河流域90个站点降水降尺度值与观测值的相关系数(a)6月, (b)7月, (c)8月; 图中蓝色区域内涵盖了源区16个站点, 绿色区域涵盖了上游26个站点, 红色区域涵盖了中游48个站点 Fig.9 The correlation coefficient between precipitation downscaling values and observed values at 90 stations in the Yellow River Basin.(a) June, (b) July, (c) August.The blue area covers 15 stations in the source area, the green area covers 26 stations in the upper reaches, and the red area covers 49 stations in the middle reaches |
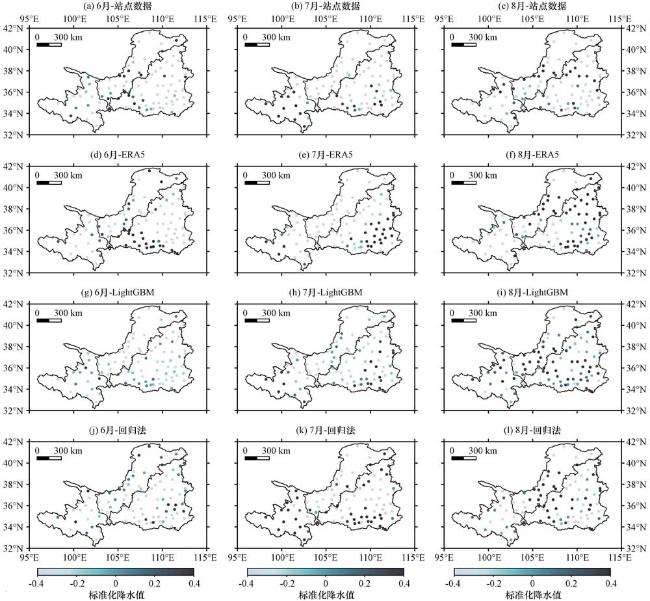
图11 1972年6月(左)、7月(中)、8月(右)各站点降水标准化后的空间分布(a~c) 是站点数据, (d~f) 是ERA5再分析资料, (g~i) 是由LightGBM得到的统计降尺度数据, (j~l) 是由回归法得到的统计降尺度数据 Fig.11 The spatial distribution of preicipitation at each site after standardization in June (left), July (medium), and August (right) 1972.(a~c) are station data, (d~f) are ERA5 reanalysis data, (g~i) are statistical downscaling data obtained by LightGBM, and (j~l) are statistical downscaling data obtained by regression method |
3.5 降尺度数据集的分布特征及其变异性
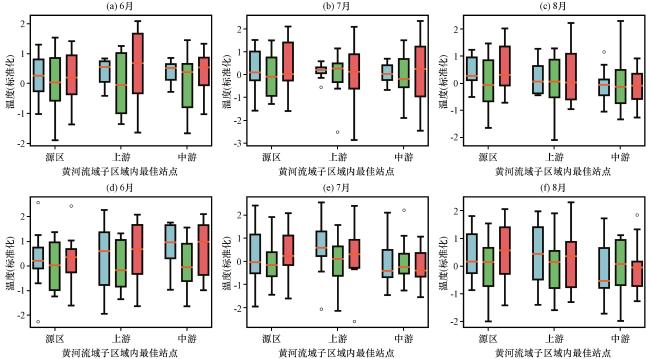
图12 温度的降尺度值、再分析资料和观测值的分布以上数据均被标准化, 其中(a~c)为LightGBM降尺度效果最佳的站点的降尺度值与对应的再分析资料和观测值的比较, (d~f)则为回归法降尺度效果最佳的站点与对应的再分析资料和观测值的比较, 蓝色箱体, 绿色箱体和红色箱体分别代表降尺度值, 再分析资料和观测值 Fig.12 The distribution characteristics of downscaling values, ERA5 and observed values of temperature.(a~c) are the comparisons between the downscaling value of the site with the best predictive effect of LightGBM with ERA5 and observations; (d~f) are the comparisons between the site with the best predictive effect of regression method and the corresponding reanalysis data and observations; the blue box, the green box, and the red box represent the downscaling value, ERA5 and the observation value respectively |
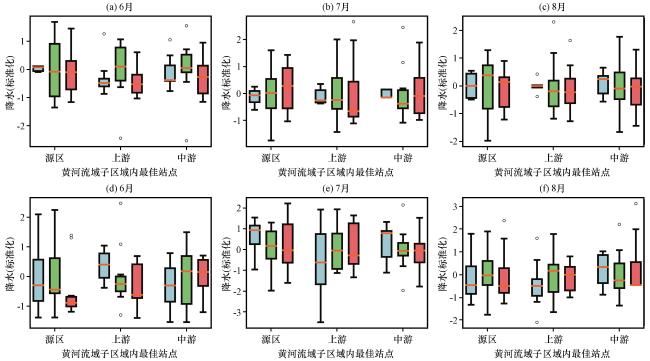
图13 降水的降尺度值、再分析资料和观测值的分布以上数据均被标准化, 其中(a~c)为LightGBM降尺度效果最佳的站点的降尺度值与对应的再分析资料和观测值的比较, (d~f)则为回归法降尺度效果最佳的站点与对应的再分析资料和观测值的比较, 蓝色箱体, 绿色箱体和红色箱体分别代表降尺度值, 再分析资料和观测值 Fig.13 The distribution characteristics of downscaling values, ERA5 and observed values of precipitation.(a~c) are the comparisons between the downscaling value of the site with the best predictive effect of LightGBM with ERA5 and observations; (d~f) are the comparisons between the site with the best predictive effect of regression method and the corresponding reanalysis data and observations; the blue box, the green box, and the red box represent the downscaling value, ERA5 and the observation value respectively |