
1 引言
2 资料来源与方法介绍
2.1 资料选取
2.2 高原季风指数及水汽相关量的计算
2.3 水汽收支诊断
3 结果分析
3.1 高原夏季风相关的降水场异常特征
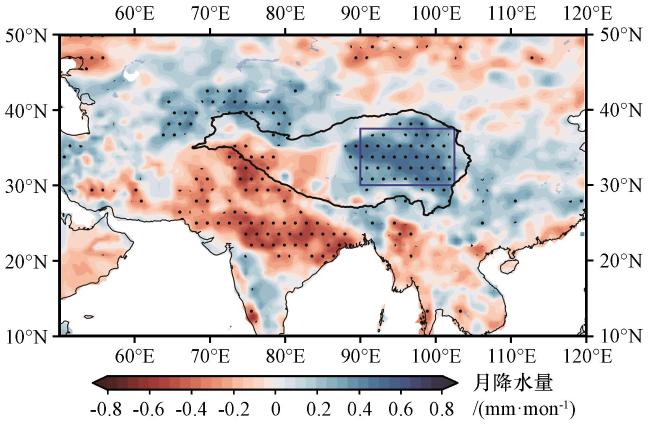
图2 1980 -2020年期间高原夏季风指数与GPCC降水资料(填色, 单位: mm·mon-1)相关系数分布打点为相关系数通过90%显著性检验的区域, 蓝色方框表示降水相关的关键区 Fig.2 The distribution of correlation coefficients between the plateau summer monsoon index precipitation data from GPCC from 1980 to 2020 (shaded, unit: mm·mon-1).Dotted regions show over 90% significance level of t-test.the blue rectangle marks key regions of precipitation correlation |
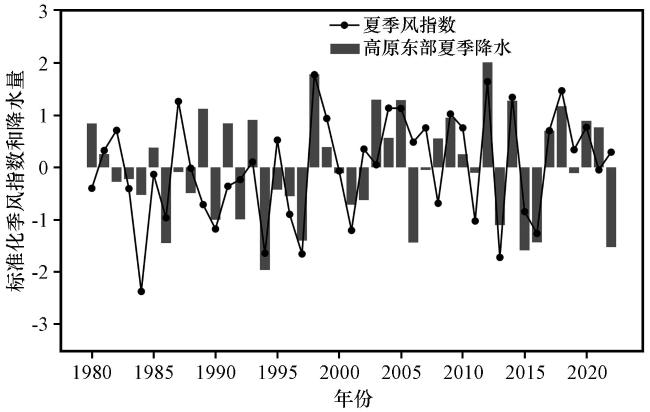
图3 1980—2020年高原夏季风指数和高原中东部夏季降水的标准化时间序列黑色线代表夏季风指数, 灰色柱状代表高原东部夏季降水 Fig.3 Standardized time series of the plateau summer monsoon index and summer precipitation in the central and eastern plateau from 1980 to 2020.The black line represents the summer wind index and the gray bar represents summer precipitation in the eastern part of the plateau |
表1 1980 -2020年高原夏季风强、 弱年Table 1 Strong and weak plateau monsoon years in 1980 -2020 |
| 类别 | 年份 |
|---|---|
| 季风强年 | 1987, 1998, 2004, 2005, 2009, 2012, 2014, 2018 |
| 季风弱年 | 1984, 1990, 1994, 1997, 2001, 2013, 2016 |
3.2 高原夏季风相关的水汽通量场和环流场特征
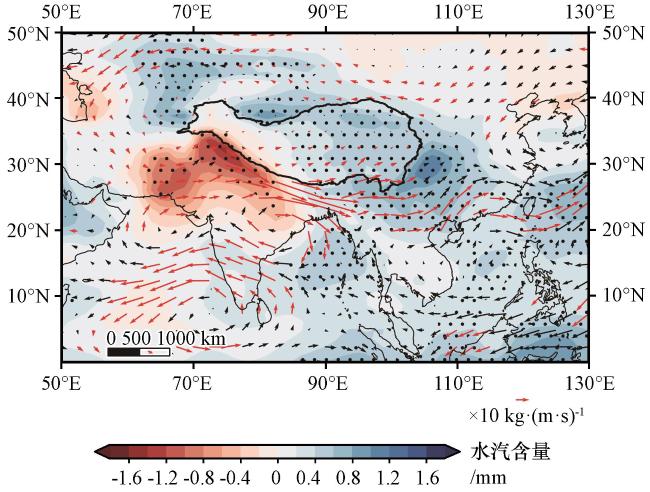
图4 1980 -2020年时期高原夏季风指数回归整层水汽含量(阴影, 单位: mm)和通过90%显著性检验的水汽通量场[矢量, 单位: ×10 kg·(m·s)-1]打点为回归系数通过90%显著性检验的区域 Fig.4 Regression of vertical integral of water vapor content (shaded, unit: mm) and water vapor transport flux [vectors, unit: ×10 kg·(m·s)-1] anomalies above 90% significance level on the plateau summer monsoon index. Dotted regions show over 90% significance level of t-test |
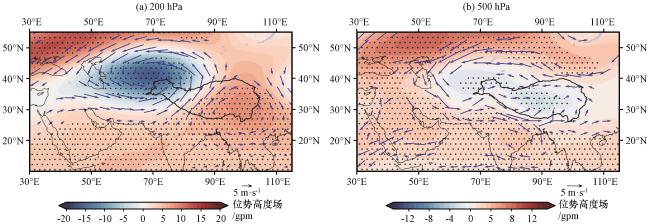
图5 1980 -2020年高原夏季风指数回归200 hPa(a)、 500 hPa(b)位势高度场(阴影, 单位: gpm)和通过90%显著性检验的风场(矢量, 单位: m·s-1)打点为回归系数通过90%显著性检验的区域 Fig.5 Regression of 200 hPa (a) and 500 hPa (b) geopotential height (shaded, unit: gpm) and wind field (vectors, unit: m·s-1) anomalies on the plateau summer monsoon index.Dotted regions show over 90% significance level of t-test |
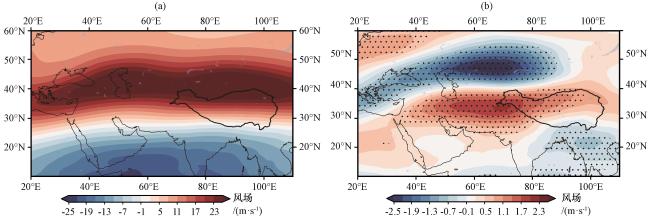
图6 1980 -2020年夏季200 hPa纬向风(a, 阴影, 单位: m·s-1)及高原夏季风指数回归200 hPa纬向风场(b, 阴影, 单位: m·s-1)打点为回归系数通过90%显著性检验的区域 Fig.6 Multiyear averaged summer 200 hPa zonal wind field from 1980 to 2020 (a, shaded, unit: m·s-1), Regression patterns of summer 200 hPa zonal wind field anomalies on the plateau summer monsoon index (b, shaded, unit: m·s-1).Dotted regions show over 90% significance level of t-test |
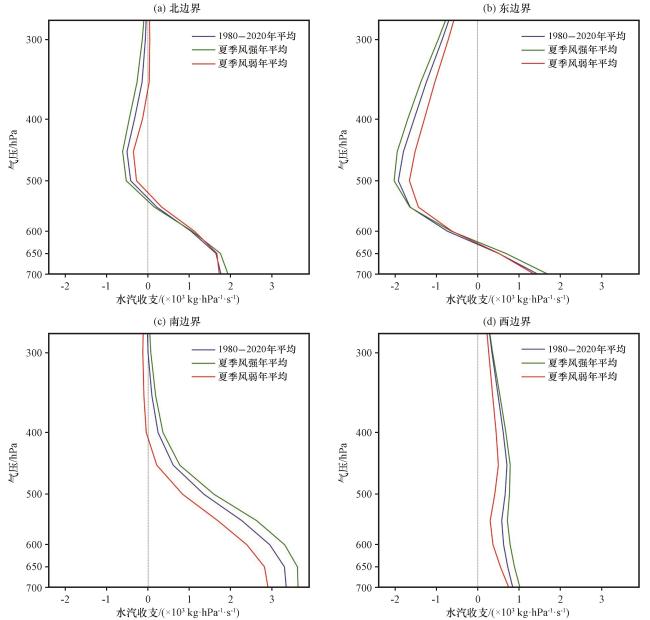
3.3 各边界水汽收支特征
表2 高原夏季风强、 弱年多年平均(1980 -2020年)夏季各边界净水汽输送及净收支量Table 2 Water vapor transport at each boundary and net water budget in multiyear averages (1980 -2020) and the strong/weak plateau summer monsoon years |
| 类别 | 各边界净水汽输送及净收支量/( kg·s-1) | ||
|---|---|---|---|
| 季风强年 | 季风弱年 | 1980 -2020 | |
| 南边界 | 66.3 | 39.6 | 56.7 |
| 西边界 | 32.1 | 18.7 | 27.4 |
| 北边界 | 2.9 | 7.9 | 4.7 |
| 东边界 | -37.8 | -30.3 | -37.6 |
| 区域净收支 | 63.5 | 35.9 | 51.2 |
3.4 水汽收支方程诊断
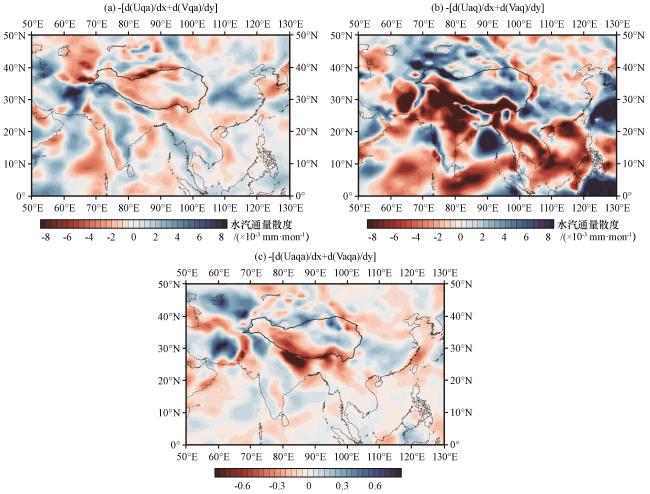
图8 高原夏季风指数回归的水汽平流引起的水汽通量散度(填色, mm·mon-1)(a)、 风场散度引起的水汽通量散度(填色, × mm·mon-1)(b)及非线性项(c)Fig.8 Regression of water vapor transport flux divergence due to wind divergence (shaded, unit: mm·mon-1) (a), water vapor transport flux divergence due to moisture advection (shaded, unit: mm·mon-1) (b) and nonlinear term (c) anomalies on the plateau summer monsoon index |