
1 引言
2 资料介绍
3 地形追随坐标系下的二阶湿位涡
3.1 二阶湿位涡
3.2 地形追随坐标系下的二阶湿位涡
4 地形追随坐标系下的二阶湿位涡与降水
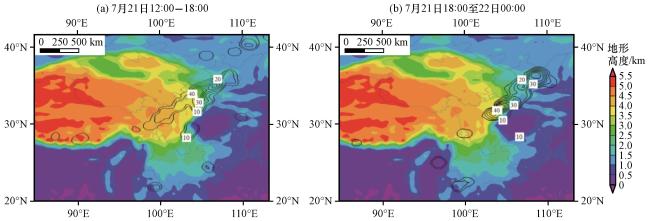
图1 2013年7月21日12:00 -18:00(a)、 21日18:00至22日00:00(b)观测的6 h累积降水量(等值线, 单位: mm)地形高度(填色, 单位: km)Fig.1 Observed 6 h accumulated rainfall (contour, unit: mm) and terrain height (shading, unit: km) from 12:00 to 18:00 on July 21, 2013(a), from 18:00 on July 21 to 00:00 on July 22, 2013(b) |
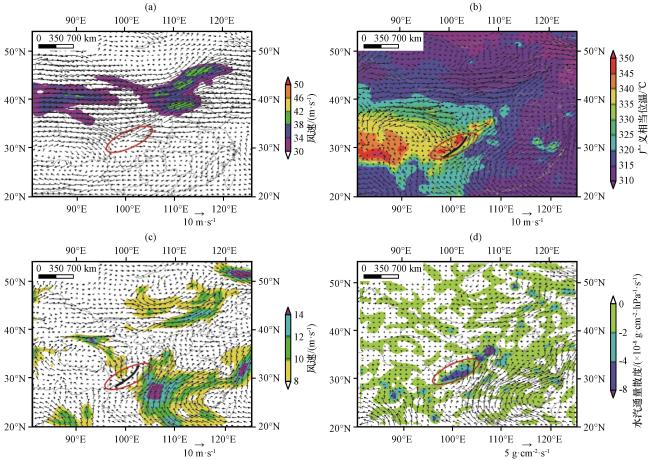
图2 2013年7月21日18:00地形追随坐标系下η=0.2786高度上的风场(矢量, 单位: m·s-1)和超过30 m·s-1的风速的区域(彩色区, 单位: m·s-1)(a), η=0.6766高度上的广义相当位温(彩色区, 单位: ℃)和风场(矢量, 单位: m·s-1)(b), η=0.7960高度上的风场(矢量, 单位: m·s-1)和超过8 m·s-1的风速(彩色区, 单位: m·s-1)(c), 水汽通量(矢量, 单位: g·cm-2·s-1)及水汽通量散度(彩色区, 单位: ×10-8 g·cm-2·hPa-1·s-1)(d)红色椭圆为风场辐合区, 黑色粗实线为切变线Fig.2 The distributions of horizontal wind vectors (vector, unit: m·s-1) and wind speed exceeding 30 (color area, unit: m·s-1) at η=0.2786 (a), generalized potential equivalent temperature (color area, unit: ℃) and horizontal wind vectors (vector, unit: m·s-1) at η=0.6766 (b), horizontal wind vectors (vector, unit: m·s-1) and wind speed exceeding 30 (color area, unit: m·s-1) at η=0.7960 (c), water vapor flux (vector, unit: g·cm-2·s-1) and water vapor flux divergence (color area, unit: ×10-8 g·cm-2·hPa-1·s-1) at η=0.7960 (d) in terrain-following coordinate at 18:00 on Jul 21, 2013.The red ellipse represents the wind field convergence area, and the thick black solid line denotes the shear line |
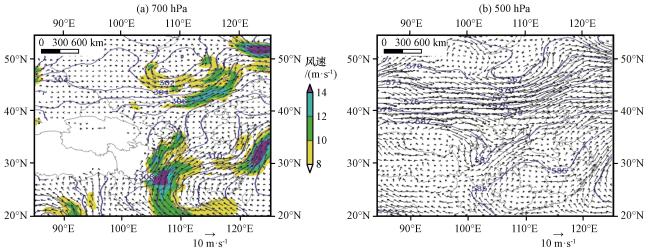
图3 2013年7月21日18:00 p坐标下700 hPa(a)和500 hPa(b)的风场(矢量, 单位: m· s-1)及位势高度场(蓝色实线, 单位: 10 gpm)(a)中彩色区为风速大于8 m·s-1的强风速区, 海拔超过3000 m区域无数据 Fig.3 The horizontal distributions of wind vector (vector, unit: m·s-1) and geopotential height(blue lines, unit: 10 gpm) in p coordinate 700 hPa (a), 500 hPa(b) at 18:00 on July 21, 2013.The colored areas in (a) represent horizontal wind speed greater than 8 m·s-1.There is no data in areas with an altitude exceeding 3000 m |
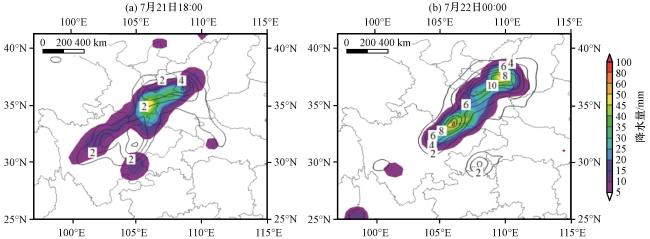
图4 2013年7月21日18:00(a)、 7月22日00:00(b)的地形追随坐标系下的二阶湿位涡(单位: ×10-10 m2·K·s-2·kg-2·Pa)其中彩色区为6 h累积降水(单位: mm)Fig.4 The horizontal distributions of second-order moist potential vorticity (unit: ×10-10 m2·K·s-2·kg-2·Pa) in terrain following coordinate, 18:00 on July 21, 2013(a), 00:00 on July 22, 2013(b).The colored areas represent 6 h accumulated rainfall (unit: mm) |
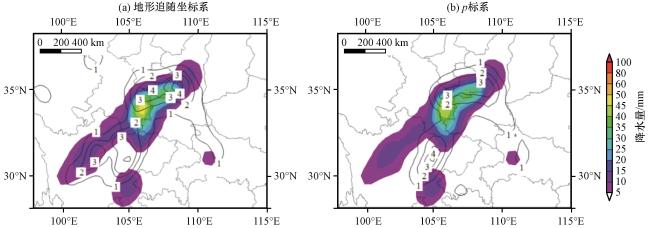
图5 2013年7月21日18:00地形追随坐标系下(a)和p坐标系下(b)的二阶湿位涡 彩色区为6 h累积降水(单位: mm)Fig.5 The horizontal distributions of second-order moist potential vorticity, in terrain-following coordinate(a), in p coordinate(b) at 18:00 on July 21, 2013.The colored areas represent 6 h accumulated rainfall(unit: mm) |
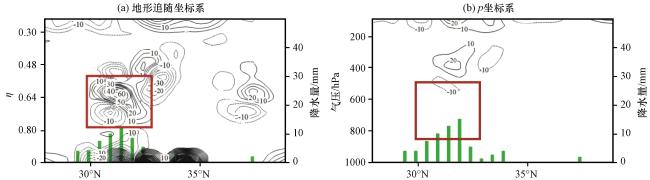
图6 2013年7月21日18:00沿112.5°E地形追随坐标系下(a)和p坐标系下(b)计算的二阶湿位涡(等值线, 单位: ×10-15 m2·K·s-2·kg-2)与6 h累积降水(绿色柱状, 单位: mm)红色方框为降水诊断关键区Fig.6 The vertical cross section of second-order moist potential vorticity (contour, unit: ×10-15 m2·K·s-2·kg-2) and 6 h accumulated rainfall (green columnar, unit: mm) in terrain-following coordinate (a), in p coordinate (b) along 112.5°E at 18:00 on July 21, 2013.The red box designates the key area for precipitation diagnosis |
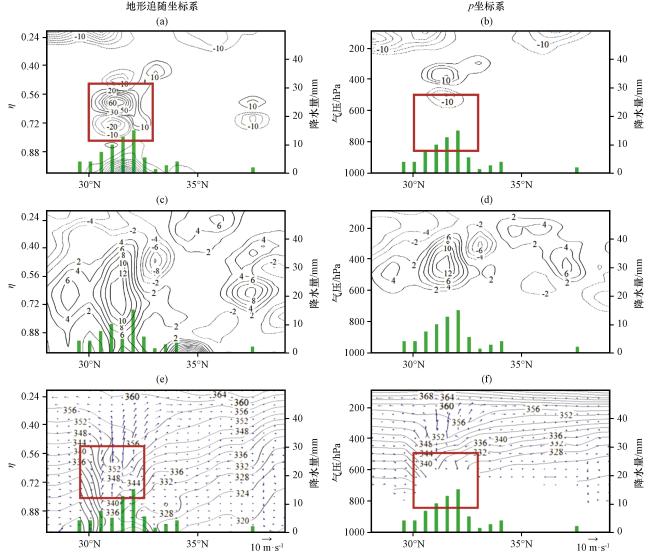
图7 2013年7月21日18:00沿112.5°E地形追随坐标系下(左)和p坐标系下(右)计算的二阶湿位涡分量 (a, 等值线, 单位: ×10-15 m2·K·s-2·kg-2), (b, 等值线, 单位: ×10-15 m2·K·s-2·kg-2), 垂直涡度(c, d, 等值线, 单位: ×10-5 s-1), 广义位温(等值线, 单位: k)和垂直风矢量(蓝色矢量, 单位: m·s-1)(e, f) 绿色柱状为观测的6 h累积降水(单位: mm), 红色方框为降水诊断关键区Fig.7 The vertical cross section of second-order moist potential vorticity components (a, contour, unit: ×10-15 m2·K·s-2·kg-2), (b, contour, unit: ×10-15 m2·K·s-2·kg-2), vertical vorticity(c, d, contour, unit: ×10-5 s-1), generalized potential temperature(contour, unit: K) and vertical wind vector(blue vector, unit: m·s-1)(e, f)in terrain-following coordinate(left column), and in p coordinate (right column) along 112.5°E at 18:00 on July 21, 2013.The green columnars represent 6 h accumulated rainfall, and the red box designates the key area for precipitation diagnosis |
5 地形追随坐标系下二阶湿位涡在降水预报中的应用
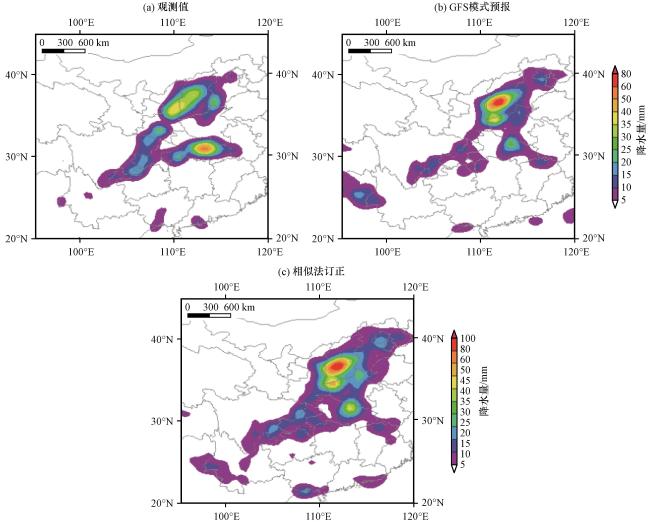
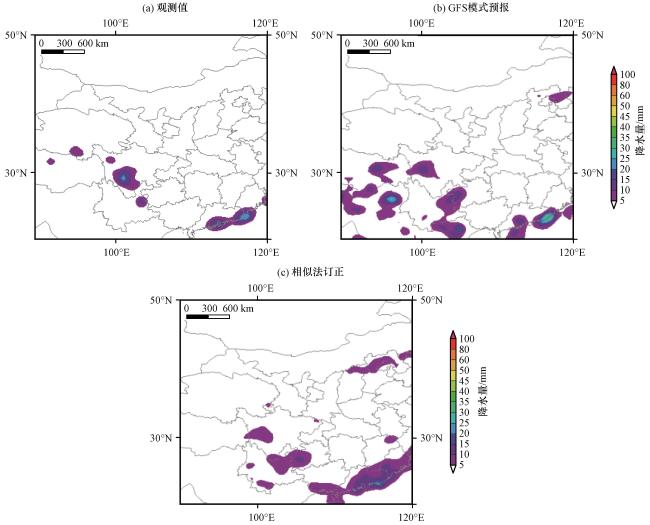
图8 2016年7月17日18:00至18日00:00观测降水(a), GFS模式24 h降水预报(b), 相似法订正后的24 h降水预报(c)(单位: mm)Fig.8 Observed 6 h accumulated rainfall(a), 6 h accumulated rainfall for 24 h by the GFS model(b), 6 h accumulated rainfall corrected by the anology method(c) from 18:00 on July 17 to 00:00 on July 18, 2016(unit: mm) |
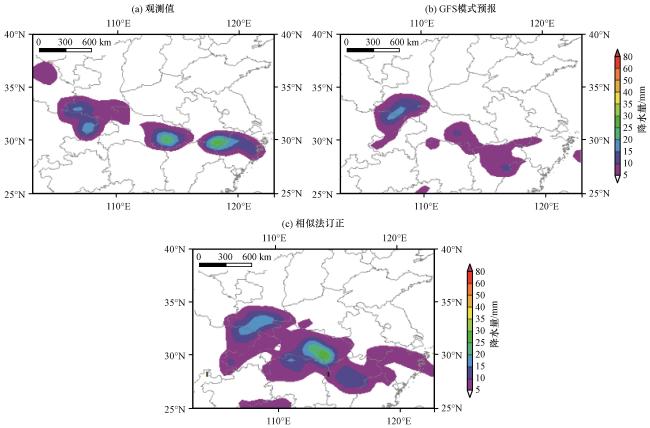
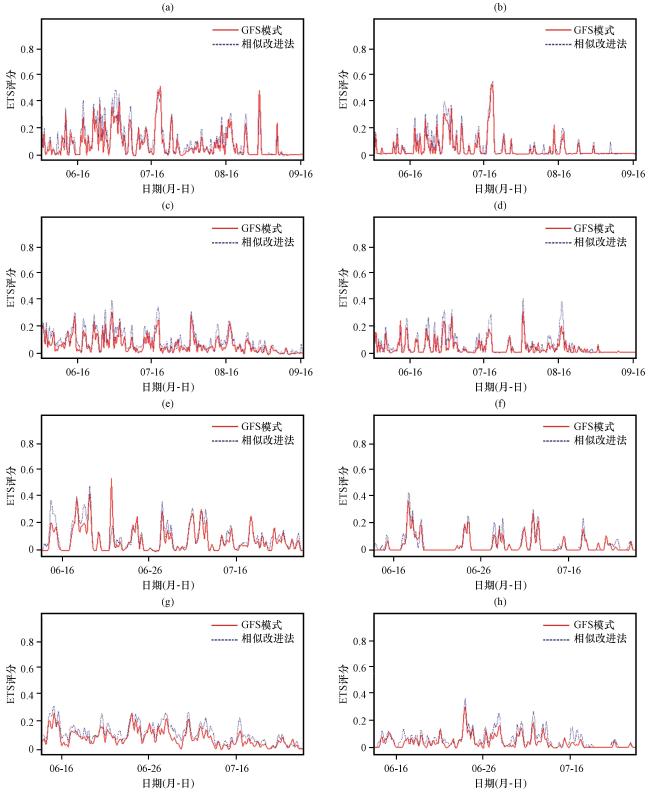
图10 2016年6月2日06:00至9月17日18:00(共431个时间点)(a~d)和2017年6月2日06:00至7月31日18:00(共243 个时间点)(e~h)华北地区(a~b, e~f)、 西南地区(c~d, g~h)大于10 mm(左)和20 mm(右)的GFS模式(红线)和相似法改进(蓝虚线)的24 h预报6 h累积降水的ETS评分Fig.10 The ETS scores of 6 h accumulated rainfall for 24 h forecasts by the GFS model (red line) and the improved analog method (blue dashed line) for precipitation greater than 10 mm (left) and 20 mm (right) in North China (a~b, e~f) and Southwest China (c~d, g~h) during the periods: from 06:00 on June 2, 2016 to 18:00 on September 17, 2016 (with a total of 431 time points)(a~d) and from 06:00 on June 2, 2017 to 18:00 on July 31, 2017 (with a total of 243 time points)(e~h) |
表1 2016年6月2日06:00至9月17日18:00和2017年6月2日06:00至7月31日18:00华北地区和西南地区大于10 mm、 20 mm、 30 mm、 40 mm的24 h预报6 h累计降水的平均ETS评分Table 1 The average ETS scores of 6 h accumulated precipitation for 24 h forecasts with precipitation amounts greater than 10 mm, 20 mm, 30 mm, and 40 mm in North China and Southwest China during the periods from 06:00 on June 2, 2016 to 18:00 on September 17, 2016, and from 06:00 on June 2, 2017 to 18:00 on July 31, 2017 |
| 时间 | 区域 | 预报降水 | 平均ETS | |||
|---|---|---|---|---|---|---|
| 10 mm | 20 mm | 30 mm | 40 mm | |||
| 2016年6月2日06:00至9月17日18:00 | 华北地区 | GFS模式降水预报 | 0.078 | 0.039 | 0.022 | 0.012 |
| 相似法改进降水预报 | 0.104 | 0.052 | 0.029 | 0.015 | ||
| 西南地区 | GFS模式降水预报 | 0.057 | 0.033 | 0.019 | 0.012 | |
| 相似法改进降水预报 | 0.086 | 0.049 | 0.029 | 0.018 | ||
| 2017年6月2日06:00至7月31日18:00 | 华北地区 | GFS模式降水预报 | 0.077 | 0.035 | 0.016 | 0.012 |
| 相似法改进降水预报 | 0.095 | 0.045 | 0.023 | 0.017 | ||
| 西南地区 | GFS模式降水预报 | 0.079 | 0.037 | 0.021 | 0.011 | |
| 相似法改进降水预报 | 0.111 | 0.059 | 0.026 | 0.017 | ||