
1 引 言
2 设备、 资料来源和方法介绍
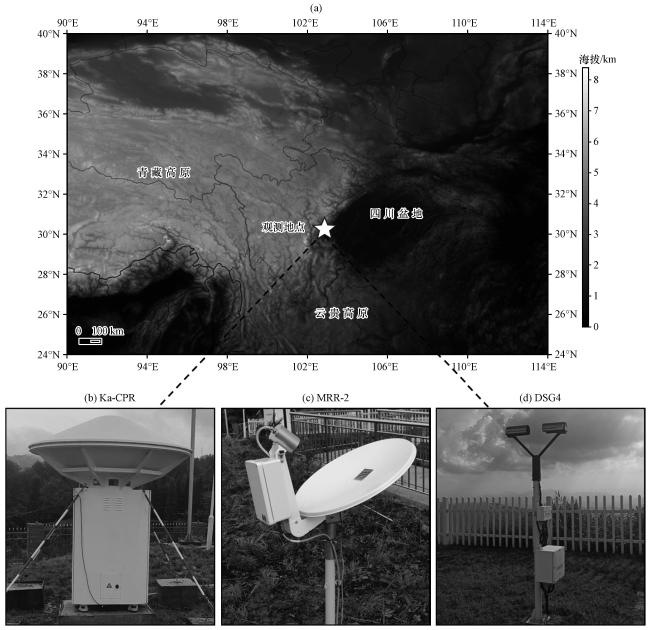
2.1 设备及资料
2.2 数据质量控制和一致性对比
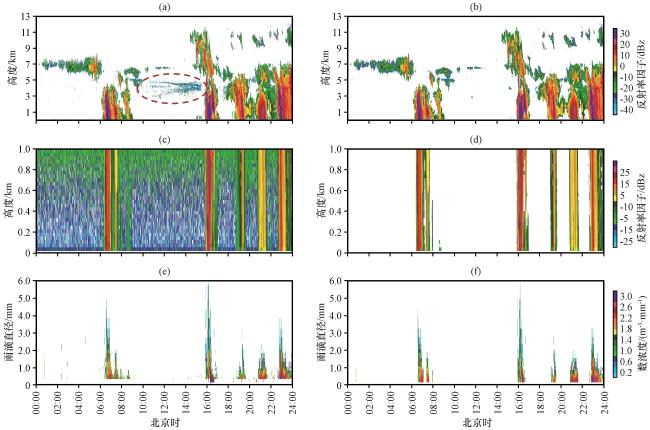
图2 2023年8月23日云-降水个例质量控制前和控制后的对比 (a)、 (c)、 (e)分别为质量控制前Ka-CPR、 MRR-2和DSG4的反射率因子和地面雨滴谱, (b)、 (d)、 (f)对应为质量控制后的结果Fig.2 Comparisons of observation results before and after data quality control for a cloud-precipitation case on 23 August, 2023.Subgraphs (a), (c), and (e) are radar reflectivity factor and ground rain spectrum observed by the Ka-CPR, MRR-2, and DSG4 before quality control, (b), (d), and (f) are corresponding results after quality control |
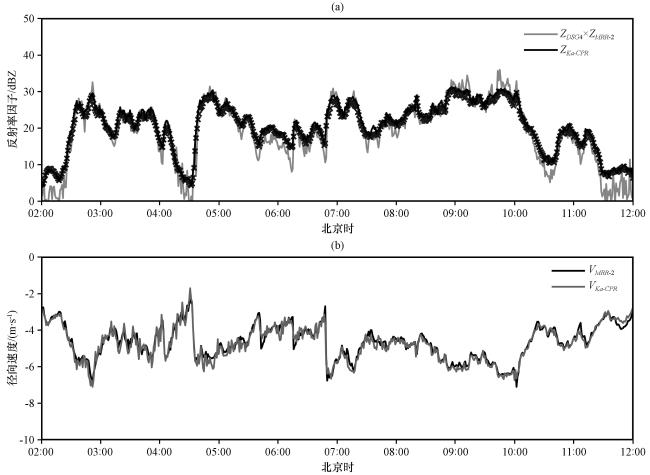
图3 2023年9月1日三部设备测量的反射率因子(a)和径向速度(b)时序结果对比 Ka-CPR和MRR-2测量高度分别为150 m和140 m, DSG4为地面Fig.3 Comparison of reflectivity factor (a) and radial velocity (b) measured by the three instruments on 1 September 2023, with Ka-CPR measured at 150 m, MRR-2 measured at 140 m and DSG4 at ground level |
表1 图3中不同设备同种观测量之间的误差和相关性Tabel 1 Bias and correlations of the same variable among different instruments corresponding to the Figure 3 |
| 观测量 | 误差和相关性参数 | 对比设备 | ||
|---|---|---|---|---|
| Ka-CPR与MRR-2 | Ka-CPR与DSG4 | MRR-2与DSG4 | ||
| Z /dBz | MAE/dBz | 0.75 | 2.33 | 2.16 |
| RMSE/dBz | 0.95 | 3.04 | 2.85 | |
| CC | 0.99 | 0.97 | 0.98 | |
| Vm /(m·s-1) | MAE/(m·s-1) | 0.19 | - | - |
| RMSE/(m·s-1) | 0.25 | - | - | |
| CC | 0.97 | - | - | |
-表示无数据(- notes no data) |
3 云-降水垂直结构和宏观特征
3.1 云-降水概况和类型
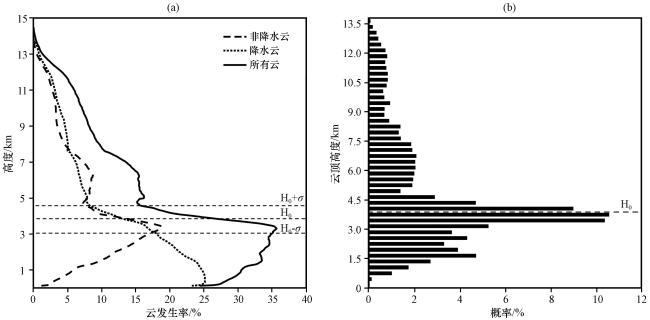
图4 观测期间不同云类的发生率随高度分布(a)及所有云的云顶高度概率分布(b)H0表示平均零度层高度, 为标准差Fig.4 Occurrence of cloud-precipitation at different high levels for different cloud types (all clouds, precipitating clouds, non-precipitating clouds) (a) and probability distribution of cloud top height for all clouds (b) during the observation period.The H0 and are the average height and its standard deviation of the atmospheric zero-degree layer |
3.2 冷暖两类云-降水的垂直结构和宏观差异
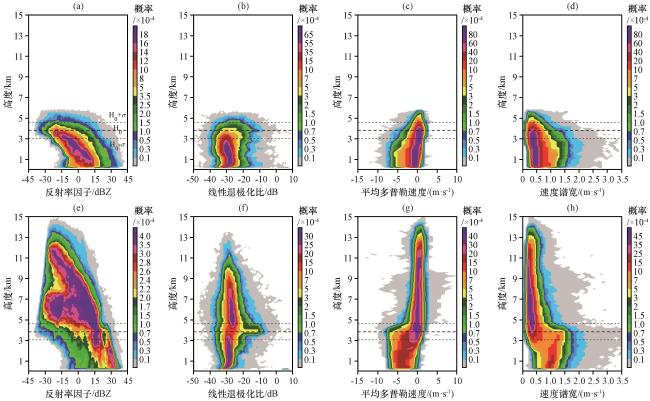
图5 观测期间WCP和CCP四个雷达参量随高度的概率分布 (a)~(d)分别为WCP的Ka-CPR反射率因子Z、 线性退极化比LDR、 平均多普勒速度Vm 、 速度谱宽W, (e)~(h)分别为CCP的Ka-CR反射率因子Z、 线性退极化比LDR、 平均多普勒速度Vm 、 速度谱宽WFig.5 Probability distributions of four radar variables versus height for the WCP and CCP during the observation period.(a)~(d) and (e)~(h) are radar reflectivity factor Z, linear depolarization ratio LDR, mean Doppler velocity Vm, spectrum width W for WCP and CCP observed by Ka-CPR, respectively |
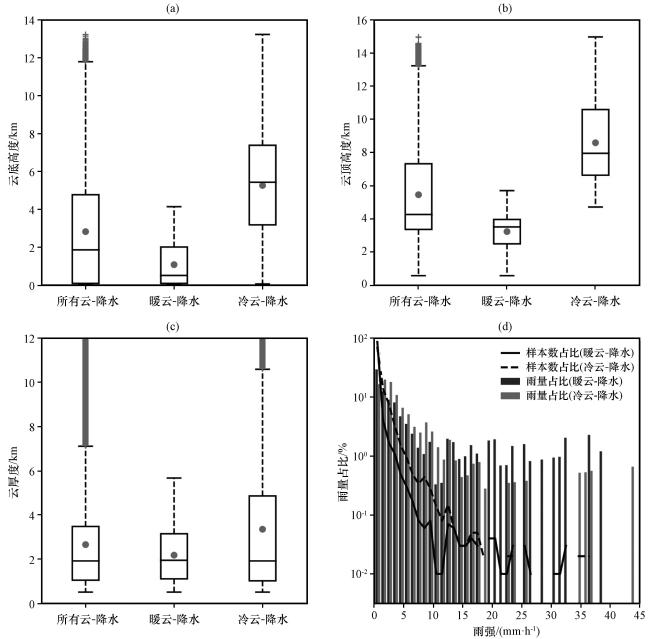
图6 所有云-降水、 WCP、 CCP的Ka-CPR观测的云底高度、 云顶高度和云厚度的箱线图(a~c)和不同雨强下DSG4观测的降水样本数及雨量占比(d)Fig.6 Boxplots of Ka-CPR measured cloud base height, cloud top height and cloud thickness (a~c) and percentages of DSG4 observed rain sample numbers and rain amounts under different rain rates (d) for all cloud-precipitation, WCP and CCP |
4 冷暖两类降水的微观特征及差异
4.1 空中雨滴谱随高度的变化和差异
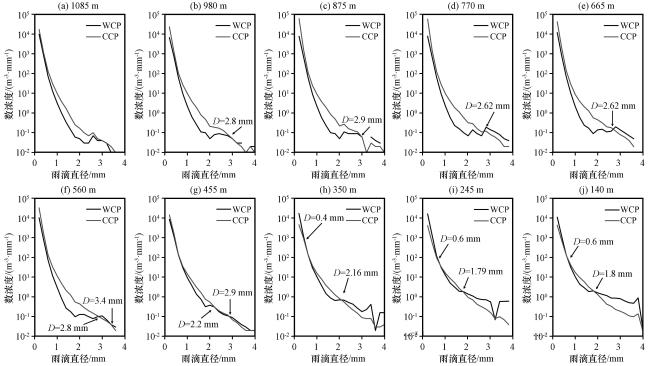
图7 观测期间MRR-2在不同高度上观测的两类降水的平均雨滴谱 (a)~(j)分别代表1085 m、 980 m、 875 m、 770 m、 665 m、 560 m、 455 m、 350 m、 245 m和140 m的结果Fig.7 The average raindrop spectra of the two types of precipitation observed at different height levels by MRR-2 during the observation period.(a)~(j) are results for 1085 m, 980 m, 875 m, 770 m, 665 m, 560 m, 455 m, 350 m, 245 m and 140 m, respectively |
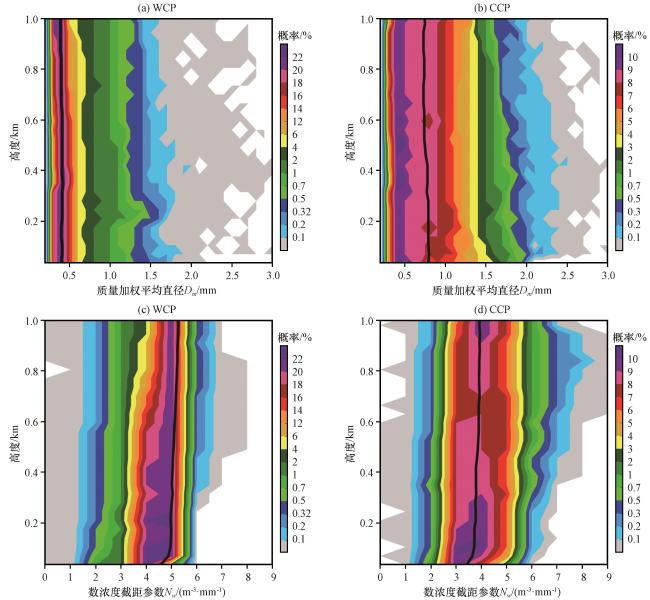
图8 观测期间MRR-2观测的两类降水的质量加权平均直径Dm 和数浓度截距参数Nw 随高度的概率分布 (a)和(c)分别为WCP的Dm 和Nw, (b)和(d)分别为CCP的Dm 和NwFig.8 Probability distribution of mass-weighted mean diameter Dm and number concentration intercept parameter Nw with height for two types of precipitation observed by MRR-2 during the observation period.(a) and (c) are Dm and Nw for WCP, and (b) and (d) are Dm and Nw for CCP, respectively |
4.2 地面雨滴谱及其他物理参量的差异
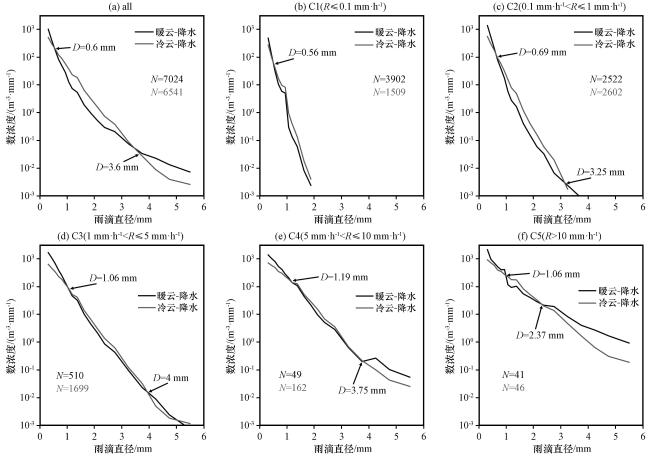
图9 DSG4在不同降水强度下观测的两类降水的平均雨滴谱 (a)为整体结果, (b)~(f)分别代表雨强为C1(R 0.1 mm·h-1)、 C2(0.1 mm·h-1< R 1 mm·h-1)、 C3(1 mm·h-1< R 5 mm·h-1)、 C4(5 mm·h-1< R 10 mm·h-1)和C5(R>10 mm·h-1)的结果, 其中黑色字体为WCP的样本数, 灰色字体为CCP的样本数Fig.9 Mean raindrop spectra of two types of precipitation observed by DSG4 at different precipitation intensities.(a) is the overall result, and (b)~(f) represent rain intensities of C1 (R 0.1 mm·h-1), C2 (0.1 mm·h-1< R 1 mm·h-1), C3 (1 mm·h-1< R 5 mm·h-1), C4 (5 mm·h-1< R 10 mm·h-1) and C5 (R>10 mm·h-1) results, where the black font is the sample size for WCP and the gray font is the sample size for CCP |
表2 DSG4观测的两类降水的 R 、 Z 、 W 、 Nt 、 Dm 和 Nw 在不同雨强下的平均值Table 2 Results of R , Z , W , Nt, Dm and Nw for two types of precipitation observed by DSG4 at different rainfall intensities mean values |
| 物理量 | 降水类型 | 不同雨强区间 | |||||
|---|---|---|---|---|---|---|---|
| All | C1 | C2 | C3 | C4 | C5 | ||
| R/(mm·h-1) | WCP | 0.46 | 0.04 | 0.31 | 2.16 | 6.60 | 20.49 |
| CCP | 1.01 | 0.04 | 0.39 | 2.15 | 6.95 | 15.87 | |
| Z/dBZ | WCP | 6.66 | -0.21 | 12.00 | 27.11 | 36.93 | 47.99 |
| CCP | 16.02 | 2.45 | 16.08 | 29.57 | 37.88 | 43.61 | |
| W/(g·m-3) | WCP | 0.03 | 0.005 | 0.03 | 0.13 | 0.33 | 0.85 |
| CCP | 0.05 | 0.005 | 0.03 | 0.11 | 0.33 | 0.67 | |
| Nt /m-3 | WCP | 231.80 | 88.67 | 356.57 | 557.54 | 722.03 | 1665.85 |
| CCP | 182.51 | 93.12 | 168.92 | 279.39 | 420.05 | 539.77 | |
| Dm /mm | WCP | 0.67 | 0.53 | 0.72 | 1.25 | 1.90 | 3.02 |
| CCP | 1.03 | 0.63 | 0.95 | 1.50 | 1.93 | 2.38 | |
| log10 Nw /(m-3·mm-1) | WCP | 3.70 | 3.54 | 3.94 | 3.72 | 3.42 | 2.92 |
| CCP | 3.71 | 3.73 | 3.78 | 3.60 | 3.51 | 3.35 | |
5 讨论
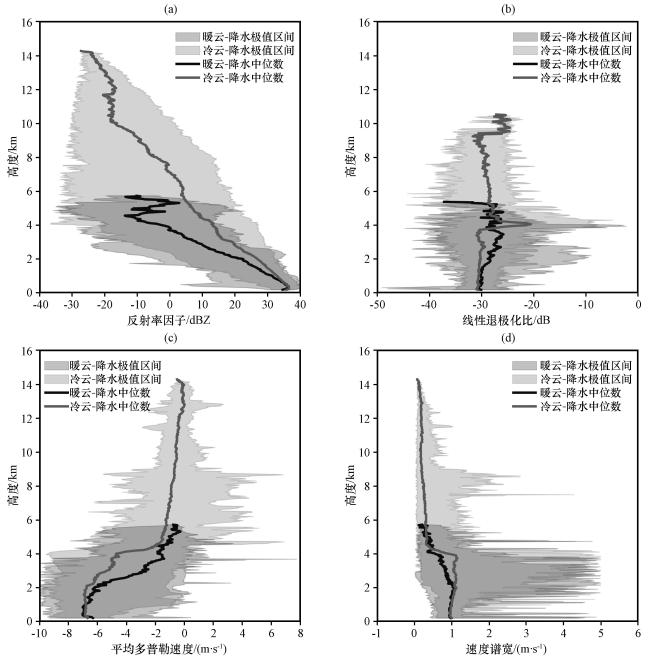
图10 R 5 mm·h-1时Ka-CPR观测的两类降水的反射率因子Z(a)、 线性退极化比LDR(b)、 平均多普勒速度Vm (c)和速度谱宽W(d)的中位数和极值对比结果 曲线代表中位数, 阴影左右边缘代表最小值和最大值Fig.10 Comparison results of median and extreme values of radar reflectivity factor Z (a), linear depolarization ratio LDR (b), mean Doppler velocity Vm (c), spectrum width W (d) for the two types of precipitation observed by Ka-CPR at R 5 mm·h-1.The curves represent the median and the shaded left and right edges represent the minimum and maximum values |