
1 引言
2 资料来源与方法介绍
2.1 资料来源
2.2 高原涡客观识别方法
2.3 大气热源计算方法
3 夏季高原涡活动的时空变化特征
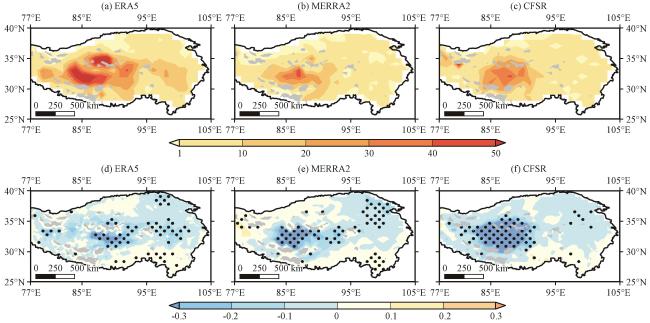
图1 基于ERA5(a, d)、 MERRA2(b, e)和CFSR(c, f)的1979 -2022年间夏季高原涡(a~c)生成个数(单位: 个)及其1998 -2022年间线性变化趋势的空间分布(d~f)灰色阴影代表地形, 打点表示通过p=0.1的显著性水平(下同) Fig.1 Spatial distribution of the genesis number of TPVs (a~c, unit: pieces) and their linear trend in summer during 1998 -2022(d~f) based on ERA5(a, d), MERRA2 (b, e) and CFSR (c, f).The gray shaded color denotes terrain, black dots denote the linear trend passes the significance level at p= 0.1 (hereafter) |
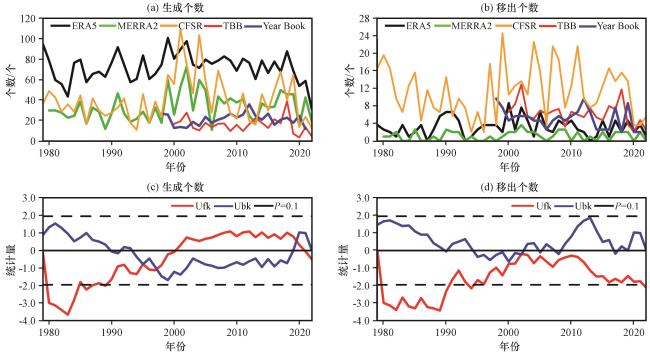
图2 高原涡生成个数(a)和移出个数(b)的年际变化以及高原涡生成个数(c)和移出个数(d)的MK突变检验黑色虚线表示 =0.1的显著性水平 Fig.2 Standardized inter-annual variations of genesis number (a) and moving off number (b) of TPVs, and the MK test for genesis number (c) and moving off number (d) of TPVs.The black dashed line denotes the significance level at p=0.1 |
表1 高原涡生成和移出个数在突变年份前、 后以及近10年的线性变化趋势Table 1 Linear trends of the genesis and moving off number of TPVs during different periods |
| 变量 | 时段 | ERA5 | MERRA2 | CFSR | TBB | Year Book |
|---|---|---|---|---|---|---|
| 生成个数 | 1979 -1997年 | -0.14 | -0.15 | -0.66 | ||
| 1998 -2022年 | -1.27* | -0.51* | -1.64* | -0.07* | -0.09 | |
| 2010 -2022年 | -2.13* | -1.89* | -0.01 | -2.52* | -1.24* | |
| 移出个数 | 1979 -2002年 | 0.76* | 0.08* | -0.11 | ||
| 2003 -2022年 | -1.21* | -0.07 | -0.41* | -0.07* | -0.01* | |
| 2010 -2022年 | -1.9* | -1.6* | -0.67* | -2.4* | -0.9* |
*表示趋势通过 =0.1的显著性水平(*denotes the linear trend passes the significance level at p= 0.1) |
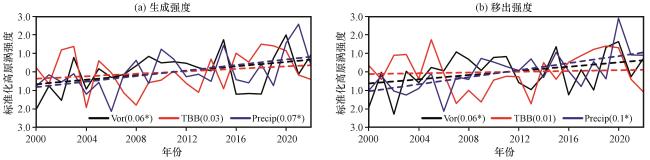
图3 标准化的单次高原涡的生成强度(a)和移出强度(b)的年际变化单次高原涡的强度定义为每年所有高原涡强度的平均值, 标准化表示距平与标准差的比值; 黑色、 红色和蓝色实线分别表示与高原涡对应的相对涡度(Vor)、 云顶亮温(TBB)和降水(Precip); 虚线代表不同变量的线性趋势; *表示线性趋势通过p=0.1的显著性水平 Fig.3 Standardized inter-annual variations of genesis intensity (a) and moving off intensity (b)of a TPV.The intensity of TPV is defined as the annual mean intensity of all TPVs, and standardization means the ratio of the anomaly to the standard deviation.The black, red and blue solid lines represent relative vorticity (Vor), black body temperature (TBB) and precipitation (Precip) corresponding to the TPV, respectively; the dashed lines represent the linear trend of the different variables; * denotes the linear trend passes the significance level at p=0.1 |
4 高原涡个数、 强度变化的原因
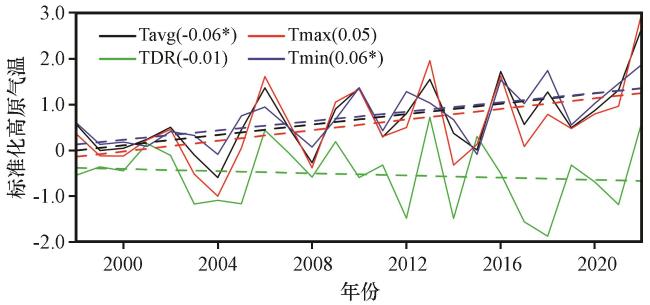
图4 1998 -2022年间标准化的青藏高原日平均气温(Tavg)、 日最高气温(Tmax)、 日最低气温(Tmin)和气温日较差(TDR)的年际变化*表示线性趋势通过p=0.1的显著性水平 Fig.4 Inter-annual variability of standardized daily mean temperature (Tavg), daily maximum temperature (Tmax), daily minimum temperature (Tmin), and daily range of temperature (TDR) over the Tibetan Plateau from 1998 to 2022.* denotes linear trend passes the significance level at p=0.1 |
表2 1998 -2022年间原值和去趋势的高原涡生成个数与去趋势和原值的青藏高原日平均气温、 日最高气温、 日最低气温和气温日较差的相关系数Table 2 Correlation coefficients between the original and detrended genesis number of TPVs and detrended and original daily mena temperature, daily maximum temperature, daily minimum temperature, and daily temperature range over the Tibetan Plateau during 1998 -2022 |
| 生成个数 | Tavg | TDR | Tmax | Tmin | ||||
|---|---|---|---|---|---|---|---|---|
| 原值 | 去趋势值 | 原值 | 去趋势值 | 原值 | 去趋势值 | 原值 | 去趋势值 | |
| 原值 | -0.53* | -0.19 | -0.23 | -0.28 | -0.53* | -0.25 | -0.46* | -0.04 |
| 去趋势值 | -0.21 | -0.26 | -0.36* | -0.37* | -0.28 | -0.32 | -0.04 | -0.05 |
*表示相关系数通过p=0.1的显著性水平(* denotes linear trend passes the significance level at p= 0.1) |
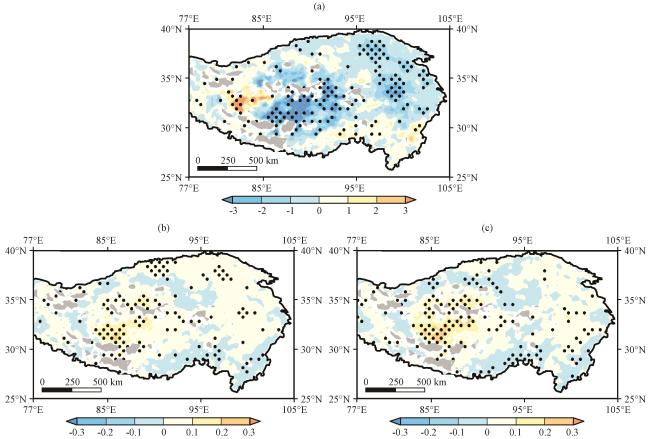
图5 1998 -2022年夏季去趋势的气温日较差(a)、 和 回归去趋势的高原涡生成个数的线性回归系数打点表示回归系数通过p=0.1的显著性水平 Fig.5 Linear regression coefficients of the detrended daily range of temperature(a), , and (c)regress on the detrended genesis number of TPVs during summer from 1998 to 2022.The black dots denote the regression coefficients pass significance level at p=0.1 |
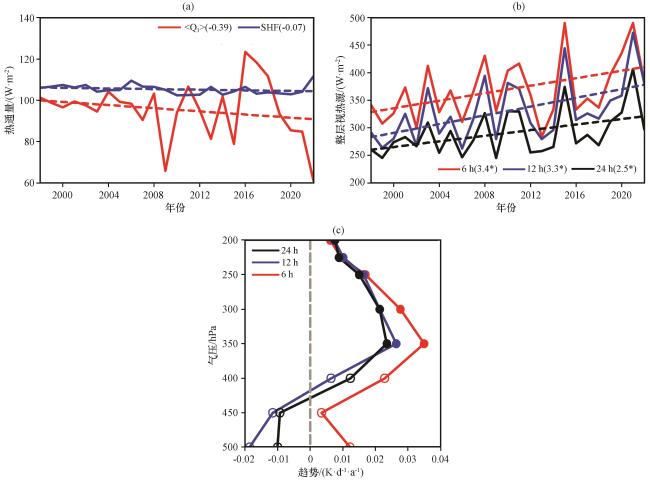
图6 高原夏季平均的整层大气热源( )与地表加热(SHF)的年际变化及线性趋势(a), 高原涡生成前期不同阶段累积的 的年际变化及线性趋势(b), 高原涡生成前期不同阶段累积的大气加热率 的年际变化趋势的垂直廓线(c)*和实心圆点表示线性趋势通过p=0.1的显著性检验, 空心圆点表示趋势未通过p=0.1的显著性检验 Fig.6 The inter-annual variations and trends of the summer mean and surface heat flux over Tibetan Plateau (a), (b) the inter-annual variations and trends of the accumulated during different precursor periods of TPV (b) and vertical profile of the accumulated during different precursor periods of TPV (c).* and solid dots denote the linear trend passes significance level at = 0.1, while hollow dots indicate the linear trend does not pass significance level at p= 0.1 |