
1 引言
2 DGVM中植被竞争与共存的显隐式表达方式
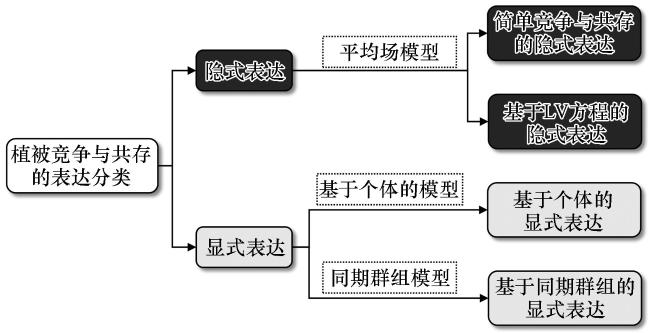
2.1 隐式表达与显式表达的定义与分类
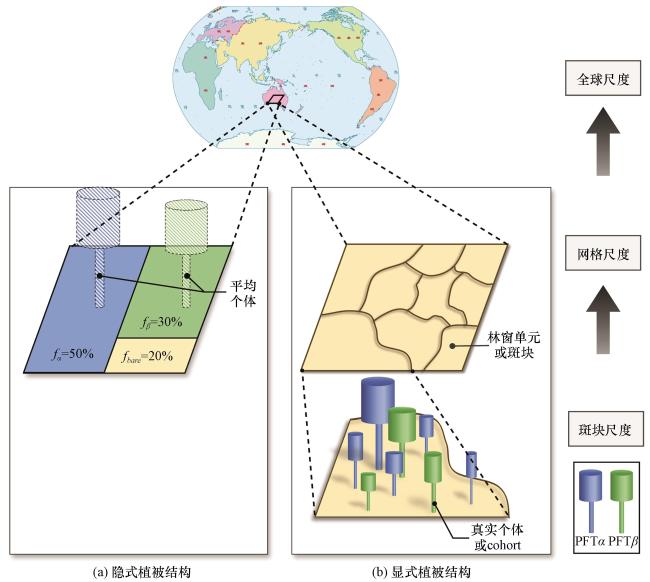
图1 DGVM中隐式和显式植被结构假设的示意图(a)隐式植被结构, 以平均场模型为例; (b)显式植被结构, 以基于个体的模型和同期群组模型为例。绿色、 蓝色分别代表不同的PFT, 黄色代表裸土, 虚线则表示没有固定形状的冠层, (b)中棕色曲线多边形表示不同年龄的斑块或林窗模拟单元, 圆柱体表示植物个体或同期群组 Fig.1 The schematic diagram of implicit and explicit vegetation structures in DGVMs.(a) implicit vegetation structure, taking the Area averaged model as an example, (b) explicit vegetation structure, taking the Individual based model and the Cohort based model as examples.Green and blue represent two different PFTs, yellow represents bare soil, and dotted lines represent canopies without a fixed shape.In (b), the brown curved polygons represent patches of different ages or canopy gap, and the cylinders represent individual plants or cohorts |
2.2 隐式表达分类及差异
2.2.1 简单竞争与共存的隐式表达
2.2.2 基于Lotka-Volterra(LV)模型的隐式表达
2.3 显式表达分类及差异
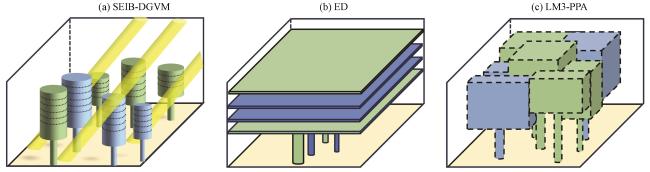
图3 SEIB-DGVM的显式个体冠层结构(a)、 ED的显式同期群组冠层结构(b)、 LM3-PPA的显式同期群组冠层结构(c)示意图绿色、 蓝色分别代表不同的PFT, 黄色代表裸土, 虚线则表示没有固定形状的冠层 Fig.3 The schematic diagram of the explicit individual canopy structure in SEIB-DGVM (a), explicit cohort canopy structure in ED (b), and explicit cohort canopy structure in LM3-PPA (c).Green and blue represent two different PFTs, yellow represents bare soil, and dotted lines represent canopies without a fixed shape |
2.3.1 基于个体的显式表达
2.3.2 基于同期群组的显式表达
3 植被竞争与共存的表达对模拟的影响
3.1 有无植被竞争
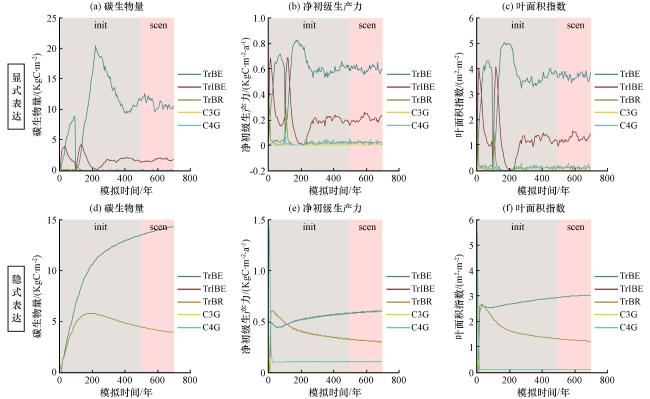
3.2 显隐式表达方式
表1 模拟结果中所涉及的PFT种类及属性Table 1 Plant function types and attributes involved in the simulation results |
| PFT | 分布地区 | 生活类型 | 叶片物候 | 是否耐荫 | 光合作用类型 |
|---|---|---|---|---|---|
| 热带常绿阔叶耐荫树(tropical broadleaved evergreen tree, TrBE) | 热带 | 阔叶 | 常绿 | 耐荫 | C3 |
| *热带常绿阔叶阳性树(tropical broadleaved evergreen shade-intolerant tree, TrIBE) | 热带 | 阔叶 | 常绿 | 不耐荫 | C3 |
| 热带雨绿阔叶阳性树(tropical broadleaved raingreen tree, TrBR) | 热带 | 阔叶 | 雨绿 | 不耐荫 | C3 |
| C3草本植物(C3 grass, C3G) | 寒带/温带 | 草 | 夏绿/雨绿 | 不耐荫 | C3 |
| C4草本植物(C4 grass, C4G) | 热带 | 草 | 夏绿/雨绿 | 不耐荫 | C4 |
*表示仅显式表达包括此种PFT, 隐式表达不含(* indicates explicit representation of this PFT type only; implicit representation not included) |
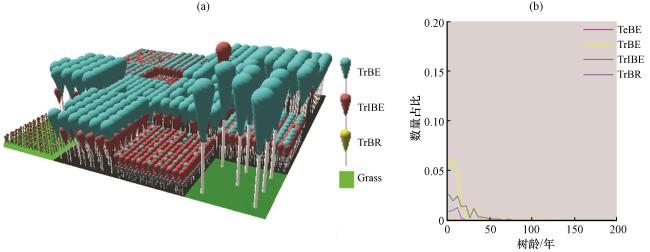
图4 LPJ-GUESS模型中使用显式表达模拟的最终时刻三维植被结构示意图(a)与各类PFT的数量占比与树龄的关系分布图(b)由LPJ-GUESS软件生成(Smith, 2001b) Fig.4 The schematic diagrams of 3D vegetation structure at the last moment (a) and the proportion of PFTs as a relationship with tree age (b) simulated by LPJ-GUESS model with explicit representation, generated by LPJ-GUESS software (Smith, 2001b) |
图5 LPJ-GUESS模型中分别使用(a~c)显式表达和(d~f)隐式表达模拟的各变量随时间的演变图图中灰色背景表示前500年的初始化时期, 粉色背景表示其后的模拟时期, 由LPJ-GUESS软件自动生成(Smith, 2001b) Fig.5 Evolution of variables simulated by the LPJ-GUESS model over time, using both explicit (a~c) and implicit(d~f) representations.The gray background represents the initialization period of the first 500 years, while the pink background denotes the subsequent simulation period.This figure was automatically generated by the LPJ-GUESS software (Smith, 2001b) |