Study on the Impact of Urbanization on Summer Heat Waves in Yangtze River Delta

  • Yujia WU , 1, 2, 3 ,
  • Yarong LI 3, 4 ,
  • Jianjun HE , 3 ,
  • Liang CHEN , 1, 2
Expand
  • 1. Key Laboratory of Geographic Information Science(Ministry of Education),East China Normal University,Shanghai 200241,China
  • 2. School of Geographic Sciences,East China Normal University,Shanghai 200241,China
  • 3. State Key Laboratory of Severe Weather Meteorological Science and Technology,Chinese Academy of Meteorological Sciences,Beijing 100081,China
  • 4. College of Earth and Environmental Sciences,Lanzhou University,Lanzhou 730000,Gansu,China

Received date: 2025-03-03

  Revised date: 2025-06-08

  Online published: 2025-12-31

Copyright

© Editorial Department of Plateau Meteorology (CC BY-NC-ND)

Abstract

Under the background of global climate warming and rapid urbanization, extreme heat events have become a significant threat to human health and social sustainable development, particularly in Yangtze River Delta (YRD), a densely populated and economically developed region.Based on meteorological observations from 1961 to 2020, this study systematically analyzes the trends of daily maximum temperature, daily mean temperature, and heat wave indices in the YRD.Additionally, sensitivity experiments using the WRF model are conducted to assess the impact of urban land use on extreme high temperature events.The results show that: (1) Both daily maximum temperature and daily mean temperature in the YRD have exhibited significant upward trends over the past few decades, with the increase in daily maximum temperature [0.194 ℃·(10a)-1] being more pronounced than that in daily mean temperature [0.187 ℃·(10a)-1].Pettitt test results indicate a significant change point in 1993, with temperatures showing a downward trend before the change point and shifting to an upward trend after the change point.(2) The frequency, duration, and intensity of heat waves have significantly increased at rates of 0.190 time·(10a)-1, 0.475 d·(10a)-1 and 0.772 ℃·time-1·(10a)-1, respectively, indicating that the frequency, duration and intensity of heat waves increased significantly.The change point for heat wave indices lags behind that of temperature change point and occurring in 2000.It showed an insignificant downward trend before the change point, and turning into a significant upward trend after the change.Intensity of heat wave increasing at a much higher rate than frequency and duration.(3) Urbanization has a significant impact on temperature and heat waves.The daily maximum temperature [0.243 ℃·(10a)-1] and daily mean temperature [0.261 ℃·(10a)-1] of urban stations being significantly higher than those of rural stations [0.171 ℃·(10a)-1、 0.167 ℃·(10a)-1], suggesting that urbanization has an amplifying effect on warming.The increasing trends of heat wave indices at urban stations are also significantly stronger than those at rural stations, indicating that urbanization may enhance the occurrence of heat waves.(4) The WRF model can effectively simulate the hourly variation of temperature, and urban land use significantly affect urban station temperatures, especially during hot days, with a more pronounced effect at night.Urban underlying surfaces enhance the surface energy changes of urban stations during hot days by changing the surface energy budget (such as sensible heat flux, latent heat flux and surface heat storage), which intensifies the temperature during hot days, while rural stations are less affected by urbanization.This indicates that the urbanization process has a more obvious impact on extreme high temperature events in urban areas.The frequency, intensity and duration of heat waves in the Yangtze River Delta region have shown a significant upward trend in the past few decades, and urbanization has played an important amplifying role in this.With the further development of urbanization, the frequency and intensity of extreme high temperature events are likely to increase further, highlighting the necessity of developing effective adaptation strategies and mitigation measures.

Cite this article

Yujia WU , Yarong LI , Jianjun HE , Liang CHEN . Study on the Impact of Urbanization on Summer Heat Waves in Yangtze River Delta[J]. Plateau Meteorology, 2026 , 45(1) : 179 -190 . DOI: 10.7522/j.issn.1000-0534.2025.00051

1 引言

经济的发展和城市化进程的加快对区域气候和环境产生重要影响, 导致极端事件频发(杜一博等, 2024Chen et al, 2011Sun et al, 20142016)。高温热浪等极端事件不仅对社会经济发展和自然生态系统产生不利影响, 而且对人体健康构成重大威胁(Kong et al, 2020Kovats and Hajat, 2008Liss et al, 2017Lobell et al, 2011McMichael et al, 2006Patz et al, 2005)。Mora et al(2017)指出, 当前全球约30%人口暴露于致命高温风险下, 若温室气体排放持续增长, 到2100年该比例可能升至74%。高温热浪作为一种极端天气, 已经引起了广泛关注和深入研究。
在气候变化的背景下, 全球高温热浪呈显著上升趋势(周波涛和钱进, 2021Domeisen et al, 2023Perkins-Kirkpatrick and Lewis, 2020)。大量研究揭示在过去几十年间, 中国绝大部分地区的高温热浪发生频次、 持续时间、 强度以及覆盖范围都表现出不断上升的趋势(李朝月等, 2023李娟等, 2020卢珊等, 2025王勇等, 2024Ding et al, 2010Yang and Zhao, 2023)。同时, 这种趋势也具有明显的区域变化特征, 如叶殿秀等(2013)通过对中国753个站点1961 -2010年夏季逐日最高温资料统计分析发现, 华北北部和西部、 西北中北部、 华南中部、 长江三角洲及四川盆地南部的高温热浪强度呈显著增加趋势, 而黄淮西部、 江汉等局地则出现减少趋势。在高温热浪整体呈增强趋势的背景下, 人类活动, 尤其是城市化, 被认为是影响区域热浪变化的重要因素之一(Ren et al, 2022Sun et al, 20142016)。
目前已经有很多研究探讨了城市化对极端高温事件的影响(张玉翠等, 2025Sun et al, 2016Zhou et al, 2022), 研究方式主要包括基于观测数据的统计分析和基于数值模式的模拟研究。前者依据长时序气象数据, 通过比较城郊站点趋势来研究城市化影响。Wu et al(2020)在中国8个分区评估了城市化对高温热浪的影响, 发现中国城市化对高温热浪的贡献达到了30%~50%。其中, 城市化程度较高的南方地区表现尤为显著, 如福建省和广东省的城市化贡献率均接近50%, 而杭州市的城市化贡献率更是达到56.8%, 高于全国平均水平。然而, 基于传统观测资料的研究在识别城市化单一因素对热浪的影响方面仍存在一定局限和不确定性。因此, 近年来越来越多研究采用数值模拟方法进一步探讨城市化效应。Magnaye and Kusaka(2024)利用WRF(Weather Research and Forecasting)/UCM(Urban Canopy Model)模式模拟研究发现, 城市化显著加剧了马尼拉地区的城市热岛效应, 使得极端高温事件的频率和强度有所增加。类似的, Wang et al(2019)研究发现, 京津冀地区城市化显著提高了夏季极端高温的发生频率, 城市区域比郊区和农村地区高温持续时间更长。在进一步探索城市扩张与热浪演变的关系方面, Liu et al(2018)结合WRF/UCM以及高分辨率土地覆盖数据开展了敏感性测试, 结果表明地表变暖的扩张范围与城市土地扩张的规模大致相同, 揭示了城市扩张对区域热浪演变的潜在影响。此外, Tabassum et al(2025)从热力机制出发, 利用WRF模式进行了敏感性试验, 分析了城市和非城市模拟之间的差异, 发现在城市模拟中, 白天的感热(潜热)通量显著增加(减少), 对流活动得到增强, 并且夜间城市热岛效应更加强烈。然而, 目前将观测分析与数值模拟相结合, 综合评估城市化对热浪演变影响的研究仍较为有限, 研究结果存在一定不确定性。
长江三角洲(简称“长三角”)地区位于中国东部沿海地区, 包括上海市、 江苏省、 浙江省和安徽省, 所占面积达到358000 km², 截止2019年长三角人口数达到了2.27亿, 是中国人口最稠密的三大城市群之一, 同时也是城市化程度较为发达的地区(Cao et al, 2018Schneider and Mertes, 2014)。作为人口密集、 经济高度活跃且城市化程度较高的区域, 在极端高温事件下将面临更加严峻的公共健康风险和城市运行挑战。因此, 本文将长三角地区选作研究区域, 基于1961 -2020年气象台站观测资料, 分析了该地区温度、 高温热浪频次、 持续天数以及强度的时空变化特征, 比较了城乡站点之间气温以及高温热浪相关指数变化趋势。考虑到以往大部分研究仅采用了观测数据或仅依赖数值模拟, 对城市热浪特征和城市化效应的理解不够深入。本文拟在观测分析的基础上, 结合WRF模式进行数值模拟, 通过设置敏感性试验, 进一步探讨城市化在长三角地区对极端高温事件的潜在影响。

2 研究区域与数据来源

2.1 气象资料

本研究使用了中国地面日值资料数据集来对高温热浪进行识别, 该数据集包括日最高气温、 日最低气温、 日平均气温等变量。研究时间跨度为1961 -2020年, 数据来源于国家气象信息中心。该数据经过了一定的质量检验和订正处理, 为确保数据的连续性和可靠性, 文中剔除了缺测天数超过了31天的气象站资料。缺测值则采用研究时段当日的气候态均值补充。最终选取了长三角地区包含162个气象站进行高温热浪的研究, 研究区域气象站的分布情况如图1所示, 文中涉及的地图是基于国家测绘地理信息局标准地图服务网站下载的审图号为GS(2024)0650号的中国地图制作, 底图无修改。文中采用世界时。
图1 研究区域和站点分布

Fig.1 Study area and distribution of meteorological stations

2.2 高温指数定义

不同的研究对高温热浪的定义和用于定义热浪的气象要素选择有所差异。参考Yang et al(2019)的意见, 本研究选择日最高气温来定义高温热浪事件, 并采用相对阈值法来确定高温阈值。规定高温阈值为研究时间段内日最高温度气候态的92.5百分位值, 且至少持续3天及以上为一次热浪过程。在此基础上本文统计了1961 -2020年夏季(5 -9月)长三角各台站历年高温热浪发生频次HWN、 高温热浪持续时间HWDU以及高温热浪强度HWI, 计算公式如下:
H W N = N
H W D U = i = 1 N D i N
H W I = i N j D i ( T i j - T t h ) N
式中: N为某年发生热浪的次数; D i为第i次高温热浪持续的天数; T i j为第i次热浪事件中第j天的日最高气温; T t h为相应的高温阈值。

2.3 城郊站点分类

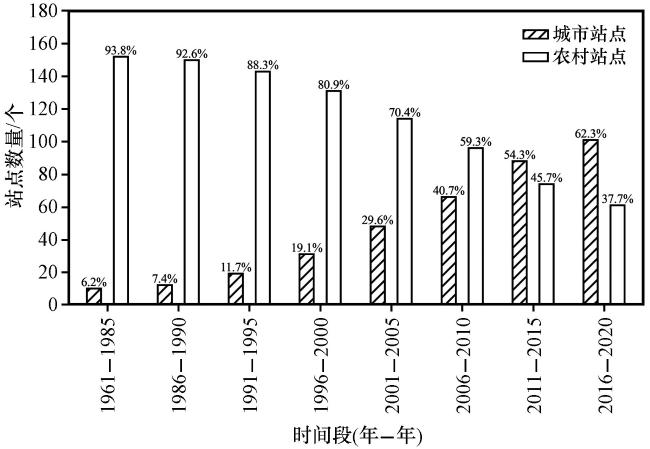
为了考察城市化是否对极端高温有所影响, 参考前人的研究方法(Anderson and Bell, 2011Luo and Lau, 2019Ren and Zhou, 2014Wu et al, 2020), 将站点分为了城市站点和农村站点两种类型。本文基于30 m分辨率的中国土地利用数据(Yang and Huang, 2021)对站点进行分类。选取了1985、 1990、 1995、 2000、 2005、 2010、 2015、 2020年共8年的土地利用数据, 分别代表1961 -1985年、 1986 -1990年、 1991 -1995年、 1996 -2000年、 2001 -2005年、 2006 -2010年、 2011 -2015年、 2016 -2020年这8个时间段的土地利用确定站点的分类情况。基于Ren and Zhou(2014)的方法, 以站点为中心构建了一个半径为2 km的圆形缓冲区, 若缓冲区城市建成面积超过三分之一, 则该站点被归类为城市站点, 否则为农村站点。为了排除复杂地形对评估带来的不确定性, 剔除了海拔高于500 m的站点。城乡站点动态变化(图2), 长三角地区城市站点数从1985年的10个(6.2%)增至2020年提升至101个(62.3%), 说明长三角地区经历了快速的城市化进程。
图2 长三角地区1961 -2020年间不同时期城乡站点数

Fig.2 Number of urban and rural stations in Yangtze River Delta during different periods from 1961 to 2020

2.4 统计检验方法

本研究选取Theil-Sen's斜率估计(Sen, 1968)计算气象要素和高温热浪指数的变化趋势, 结合改良后的Mann-Kendall(M-K)趋势检验法(Yue and Wang, 2004)检验时间序列趋势的显著性。改良后的Mann-Kendall检验通过预白化处理降低了序列自相关性的干扰(张嘉仪和钱诚, 2020Yue and Wang, 2004)。此外, 为探究趋势变化的阶段性特征, 采用Pettitt非参数秩检验法(Pettitt, 1979), 该方法无需依赖数据分布假设, 适用于气象、 水文等非平稳时间序列分析, 不仅能够判断出突变点的位置, 还能检验其突变点是否具有统计显著性。

2.5 模式介绍与试验设置

本研究采用WRF模式4.5版本耦合BEM多层城市冠层模式进行数值模拟试验, 并且使用局地气候分区(Local Climate Zone, LCZ)数据替换WRF原始的地表覆盖数据。局地气候分区这一概念由Stewart and Oke(2012)Stewart et al(2014)在2012年提出, 根据地表覆盖、 地表结果、 建筑材料和人类活动将下垫面细分为17类, 其中LCZ1-10为城市用地类型, LCZ A-G为自然覆盖类型, 并且将这种新的分类方法纳入WRF模式下垫面能够对模拟结果起到一定的改善作用(Brousse et al, 2016)。考虑到采用的LCZ数据制作时间为2018年, 为了使模拟结果更加符合真实情况, 则选择2018年夏季(5月1日至9月30日)作为模拟时间段, 每个月进行一次模拟试验, 模式从上月的最后一天开始运行, 前24 h为spin-up时间。数值模拟试验聚焦于长三角地区城市化较高、 人口密度较大的上海市, 采用三层嵌套, 最内层覆盖了整个上海市, 分辨率分别为25 km、 5 km和1 km, 最内层格点数为156×156, 每隔1 h输出一次最内层嵌套结果。模式初始场和边界条件选用美国环境预测中心NCEP提供的GFS(Global Forecast System)分析场, 水平分辨率为0.25°×0.25°, 时间间隔为6 h。最外层区域采用分析nudging确保长时间模拟的大尺度流场接近分析场。模式采用的物理方案具体包括: RRTMG 长短波辐射方案, YSU 边界层参数方案, Noah陆面模式, MM5地表层方案, Kain-Fritsch积云方案(最外层区域使用), Thompson微物理方案。为了能够更加客观地描述下垫面的真实情况, 在将WRF原始的土地利用类型数据替换为LCZ的同时也将植被叶面积指数更新为2018年的数据。
为了探究城市化对高温的影响, 本文设计了两种试验——URBAN试验和NOURBAN试验。URBAN试验作为控制试验, 在采用上文介绍的方案后不做改动。NOURBAN试验则是将模拟区域内的城市类型下垫面替换为农田类型, 其余保持不变, 作为敏感性试验。图3展示了两个试验方案模拟区域最内层嵌套区域的土地利用类型分布。
图3 URBAN试验(a)、 NOURBAN试验(b) 模拟区域土地利用类型

Fig.3 Land use types of URBAN experiment(a)and NOURBAN experiment (b)

3 结果与分析

3.1 日最高气温和日平均气温变化特征

结合图4的年际变化和变化趋势可以看出, 长三角地区日最高气温和日平均气温均呈现出显著的上升趋势, 其中日最高气温上升趋势[0.194 ℃·(10a)-1]强于日平均气温[0.187 ℃·(10a)-1]。通过对气温时间序列进行突变点检验发现, 日最高气温和日平均气温在20世纪90年代均存在显著突变, 具体年份均为1993年。文中将整个研究时期分为突变前和突变后两个时期, 进一步比较突变点前后的气温变化趋势(图4)可知, 长三角的日最高气温和日平均气温在突变点前时期表现为显著的下降趋势, 发生突变后则转换为上升趋势。突变前期, 日最高气温和日平均气温下降趋势分别为-0.254 ℃·(10a)-1、 -0.180 ℃·(10a)-1; 突变后期, 日最高气温和日平均气温上升趋势分别为0.276 ℃·(10a)-1、 0.257 ℃·(10a)-1。已有研究表明, 20世纪90年代之前的降温可能与平流层温度变化密切相关。硫酸盐气溶胶通过吸收太阳辐射导致平流层温度升高, 进而增强了中上对流层的气温梯度, 促使200 hPa东亚西风急流北移、 副热带高压北抬, 南方暖湿气流向北输送, 东亚夏季风强度增强, 导致云量增加, 从而减少了到达地面的太阳辐射(Qi and Wang, 2012)。90年代以后的增温则可能是新型厄尔尼诺频发导致中太平洋海温升温, 削弱了东亚夏季风, 限制其向北方扩展并减少了降雨量而促成了之后的升温(Kwon et al, 2007Li et al, 2010)。总体而言, 长三角地区在过去几十年间日最高气温和日平均气温整体在上升, 且不论是整体趋势还是突变前后趋势, 均表现为日最高气温强于日平均气温。
图4 长三角日最高气温(a)、 日平均气温(b)年平均时间序列和线性趋势

*表示通过0.05显著性检验

Fig.4 Interannual variations and trends of daily maximum temperature(a)and daily mean temperature(b)in Yangtze River Delta.The asterisk(*)denotes statistical significance at the 0.05 level

3.2 高温热浪指数变化特征

基于对1961 -2020年长三角地区高温热浪指数的变化趋势和突变特征结果(图5)来看, 长三角地区三个指标整体呈现出显著上升的趋势, HWN、 HWDU、 HWI上升速率分别为0.190 time·(10a)-1、 0.475 d·(10a)-1、 0.772 ℃·time-1·(10a)-1, 且均通过了0.05显著性检验, 说明在过去几十年间长三角地区高温热浪的发生频率增加, 持续时间更长, 强度更强。经过突变点检验发现, 三个指标均于2000年发生显著性突变, 和前人的结论一致(杨涵洧等, 2018), 略晚于气温突变年份。针对这一现象, 其原因可能为日最高气温和日平均气温作为单变量气象要素, 当直接受到气候变暖、 热岛效应等因素的影响时响应较快, 而高温热浪作为连续性极端事件, 不仅涉及日最高气温的升高, 还包括极端高温天数的增加和连续高温天数的累积, 虽然1993年开始气温有显著升高的趋势, 但热浪的增强需同时满足极端高温阈值突破、 持续天数累积, 需要在一定时间之后, 才表现出显著的突变, 因此导致高温热浪突变时间较为滞后。
图5 长三角年均高温热浪指标HWN(a)、 HWDU(b)、 HWI(c)时间序列和线性趋势

*表示通过0.05显著性检验

Fig.5 Interannual variations and trends of HWN(a), HWDU(b), and HWI (c) in Yangtze River Delta.The asterisk (*)denotes statistical significance at the 0.05 level

根据图5显示, 在突变点前期HWN、 HWDU、 HWI都呈现出不同程度的下降趋势, 但均未通过0.05显著性检验, 突变点后期则为显著上升的趋势, HWN、 HWDU、 HWI上升趋势分别为0.136 time·(10a)-1、 1.101 d·(10a)-1、 1.258 ℃·time-1·(10a)-1

3.3 城乡站点变化特征

3.3.1 日最高气温和日平均气温变化特征

表1统计了长三角地区城乡站点的日平均气温和日最高气温长期变化趋势。无论是日最高气温还是日平均气温, 城市站点和农村站点均呈现出显著上升的趋势, 且城市站点的上升趋势均快于农村站点。对城市站点而言, 日平均气温[0.261 ℃·(10a)-1]的上升速率要强于日最高气温[0.243 ℃·(10a)-1], 而对于农村站点来说则相反, 日最高气温[0.171 ℃·(10a)-1]的上升速率要强于日平均气温[0.167 ℃·(10a)-1]。这意味着在城市地区, 夜间气温的上升趋势更为显著, 进而提升了日平均气温的变率, 反映出城市热岛效应在夜间的增强。
表1 长三角地区城乡站点气温线性趋势

Table 1 Temperature trends at urban and rural station in Yangtze River Delta

气温线性趋势/[℃·(10a)-1
城市站点 农村站点
日平均气温 0.261* 0.167*
日最高气温 0.243* 0.171*

*表示通过0.05显著性检验(*denotes statistical significance at the 0.05 level)

3.3.2 高温热浪指数变化特征

表2总结了长三角HWN、 HWDU和HWI的长期变化趋势。在城市站点和农村站点的对比中, HWN、 HWDU和HWI均呈现显著增加趋势, 这与全国大多数站点极端高温事件呈现出增加趋势是相一致的(卢珊等, 2025)。具体来看, 城市站点的HWN上升趋势为0.267 time·(10a)-1, 农村站点为0.172 time·(10a)-1, HWDU上升趋势在城市站点为0.604 d·(10a)-1, 农村站点为0.365 d·(10a)-1, HWI上升趋势在城市站点为0.849 ℃·time-1·(10a)-1, 农村站点为0.630 ℃·time-1·(10a)-1。上述结果表明, 城市站点在HWN、 HWDU、 HWI指数表现出的上升趋势均要强于农村站点, 表明城市地区的高温热浪事件不仅更加频发和持久, 而且强度更强, 这意味着城市化可能对高温热浪起着增强的作用。目前已有不少研究表明, 城市化会对中国地区区域气候变化产生一定的影响(安宁和左志燕, 2021Chen and Frauenfeld, 2016Lin et al, 2018)。因此, 接下来将采用数值模拟的方法来探究城市化对高温热浪产生的影响。
表2 长三角地区城乡站点HWNHWDUHWI线性趋势

Table 2 Trends of HWNHWDUHWI at urban and rural station in Yangtze River Delta

高温指数 城市站点 农村站点
HWN/[time·(10a)-1 0.267* 0.172*
HWDU/[d·(10a)-1 0.604* 0.365*
HWI/[℃·time-1·(10a)-1 0.849* 0.630*

*表示通过0.05显著性检验(*denotes statistical significance at the 0.05 level)

3.4 数值模拟结果分析

3.4.1 模式效果评估

为了确保敏感性试验结果的可信度, 本文首先评估了URBAN试验的模拟能力。从图6可以看出, URBAN试验对上海市2 m气温的模拟效果总体较好, 其中, 所有站点的RMSE为0.732 ℃, 城市站点RMSE为0.756 ℃, 农村站点RMSE为0.667 ℃。不论是城市站点还是农村站点, 模式均能较好地再现气温的日变化趋势。具体来看, 模式对城市站点的夜间气温存在一定高估, 对农村站点的日间气温则略有高估。这可能是因为模式高估了城市夜间的热量存储和释放导致气温偏高, 以及对植物蒸腾降温作用和土壤初始化湿度的低估导致农村日间气温偏高。尽管如此, 模拟结果与观测数据的相关系数均超过0.95, 表明URBAN试验对上海市高温事件的模拟具有较高的可信度。这一评估结果为后续敏感性试验结果的可靠性提供了有力支撑。
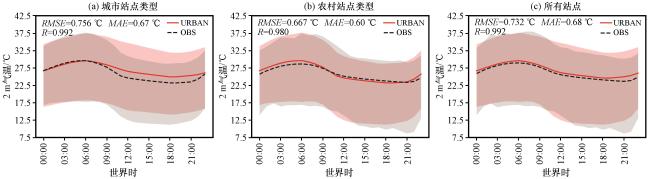
图6 2018年5月1日至9月30日城市、 农村、 所有站点平均2 m气温的逐小时变化

红色实线代表URBAN试验, 黑色虚线代表观测数据, 阴影部分代表该时刻气温范围

Fig.6 Diurnal profiles of average 2 m temperature of urban stations, rural stations and all stations from 1 May to 30 September 2018.The red solid line represents the URBAN experiment, the black dotted line represents the observation data, and the shaded area represents the range of temperature at the moment

3.4.2 敏感性试验结果分析

为了深入探讨下垫面变化对气温的影响, 本文对URBAN和NOURBAN试验结果进行了分析讨论。参考Wang et al(2017), 将日最高气温超过研究时间段内当日温度气候态的92.5百分位定义为高温日, 我们将整个模拟时间段分为了高温日时期和非高温日时期, 对比分析了城乡站点在不同试验下高温日时期与非高温日时期的气温差异。根据统计结果可知, 上海地区在2018年夏季经历了几次较为显著的高温事件, 其中5月中旬出现较强的高温天气, 且高温天气的发生频率在8月和9月达到高峰。
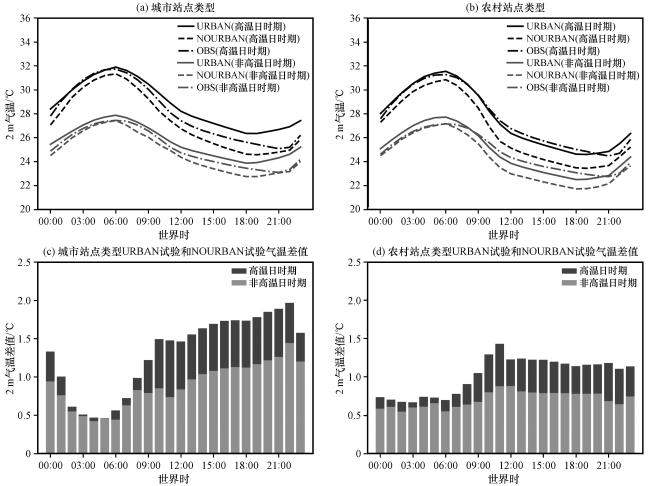
为了探索在高温时期和非高温日时期, 城市下垫面的存在对气温的影响是否有差异, 图7展示了高温日和非高温日时期城乡站点气温的逐小时变化, 以及两个时期之间的气温差值逐小时变化。根据图7(a)和(b)的结果, 在高温日时期, 城乡站点的气温整体高于非高温日时期, 并且在URBAN试验中, 气温均高于NOURBAN试验。进一步分析图7(c)和(d)中的气温差值变化, 结果显示, 不论是城市站点还是农村站点, 高温日时期下URBAN试验与NOURBAN试验的气温差值要大于非高温日时期, 并且在夜间表现得更为明显。除此之外, 城市站点在高温日和非高温时期两种试验的气温差值均整体大于农村站点。以上现象可能与城市下垫面特性、 城市热岛效应及城乡对下垫面变化的响应差异有关。在URBAN试验中, 城市地区以高热容、 低反照率的不透水面为主, 而在NOURBAN试验中被替换为农田, 因此下垫面变化时, 城市站点气温的变化更为明显。此外, 城市地区的建筑物和不透水面等会在夜间释放白天积累的热量, 导致夜间气温较高, 致使城市站点在夜间时两种试验的气温差值差异更大。而农村地区由于植被覆盖较多, 蒸散降温作用较强, 并且在替换下垫面后下垫面的反照率和热容量等物理性质变化相对较小, 因此气温变化较城市站点更弱, 并且气温差值整体小于城市站点。
图7 城市(a, c)和农村站点(b, d)在URBAN和NOURBAN试验下高温日时期和非高温日时期平均2 m气温及两者差值的日变化

Fig.7 Diurnal variation of mean 2 m air temperature and differences between URBAN and NOURBAN experiments for urban(a, c)and rural stations(b, d)during hot days and non-hot days periods

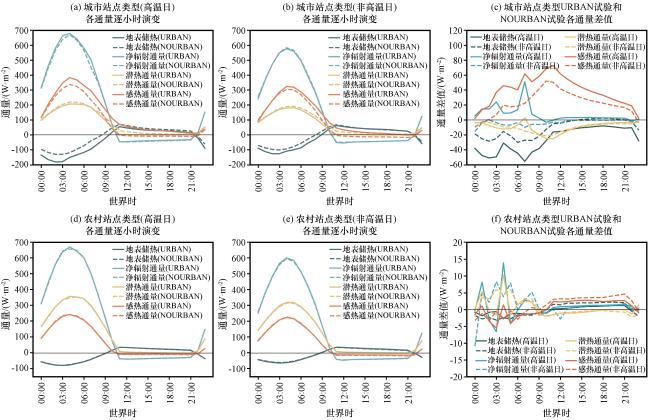
在前面的分析中, 文中已经探讨了不同试验下城市站点的气温变化, 尤其是在高温日和非高温日时期城乡站点气温的差异。为了进一步了解这些差异的成因, 特别是城市化对地表能量收支的影响。图8给出了城市站点和农村站点高温日和非高温日下地表净辐射通量、 地表储热、 感热通量和潜热通量项的日变化以及URBAN试验和NOURBAN试验在高温日和非高温日情况下各通量的差值。首先分析城市站点的情况。URBAN试验中, 城市地区特有的不透水面相较于自然植被表面, 具有更高的热容量和热导率, 同时反照率较低, 使得城市在白天吸收更多的太阳短波辐射, 从而导致较高的地面净辐射。由于主要在白天受到太阳辐射的影响, 因此在图8(c)表现为在白天较为明显, 夜晚则趋近于0。热容量大且导热性高这一特性使得城市在白天吸收大量的热量并迅速升温, 地面和大气之间的温度梯度增大, 感热通量通常较大, 在图8(c)中表现为感热通量差值在高温日和非高温日情况下均大于0。特别在夜间, URBAN试验中在夜间感热通量为正, 而NOURBAN中为负, 说明在夜间城市下垫面还会通过感热通量传递热量, 一定程度上促使了夜间的热岛效应加强。此外, 城市下垫面缺乏植被和土壤水体, 因此蒸发和蒸腾的能力较弱, 相较于自然植被来说潜热通量较小。从图8(a)和(b)可以看到, URBAN试验中夜间潜热通量趋近于零, 而NOURBAN试验则存在一定的潜热通量, 并且在图8(c)中潜热通量差值为负, 说明NOURBAN试验中潜热通量要高于URBAN。由于城市下垫面的特性, 白天地表能存储大量的热量(Fernández et al, 2021), 在图8中表现为URBAN试验的地表储热要高于NOURBAN试验。然而对于农村类型的站点, URBAN试验和NOURBAN试验的差异不大, 且潜热通量明显高于感热通量, 这主要得益于农村下垫面自然植被的蒸发和蒸腾作用较为强烈。
图8 城市(a~c)和农村站点(d~f)在URBAN和NOURBAN试验下高温日时期和非高温日期各通量日平均以及两者差值的日变化

Fig.8 Diurnal variation of the surface heat budget and their differences between URBAN and NOURBAN experiments for urban(a~c)and rural stations(d~f)during hot days and non-hot days periods

结合图8(c)和(f)可以看出, 除了净辐射通量外, 城市站点在高温日时期的感热通量、 潜热通量和地表储热差值均高于非高温日时期的差值。这表明城市下垫面的存在会显著增大高温日和非高温日之间的地表能量平衡各分量的差异, 反映出城市化影响下的地表热量积累和传输机制使得高温日时期的能量变化更加显著, 从而解释了为什么城市站点在高温日时期两个试验之间的气温差值比非高温时期更大。与城市站点不同, 在农村站点, URBAN试验和NOURBAN试验各项能量通量差值在高温日时期和非高温日时期的差异并不明显, 差值普遍不超过20 W·m-2, 远低于城市站点差值。这表明城市下垫面的变化对农村地区的影响较为有限, 在自然地表条件下, 城市化对能量收支的影响较为弱小。通过以上分析, 能够解释之前观察到的现象, 即农村站点不论是高温日时期还是非高温日时期, 两种试验的气温差值均小于城市站点。

4 结论

本研究基于对长三角地区1961 -2020 年气温及高温热浪指数的观测结果分析, 展示了近几十年来长三角地区高温的变化特征, 并结合数值模拟试验, 进一步探究了城市化所引起的土地下垫面类型变化对极端高温的影响。主要结论如下:
(1) 基于观测资料统计分析, 长三角地区的日最高气温和日平均气温在过去几十年间均呈显著上升趋势[分别为0.194 ℃·(10a)-1和0.187 ℃·(10a)-1], 且日最高气温增幅高于日平均气温。通过突变检验发现, 两类气温序列于1993年发生显著突变, 突变点前后气温变化趋势表现出明显的差异。突变点前, 气温呈下降趋势, 而突变点后则转换为上升趋势。高温热浪指数(HWN、 HWDU、 HWI)分别以0.190 time·(10a)-1、 0.475 d·(10a)-1和0.772 ℃·time-1·(10a)-1的趋势显著上升, 表明高温热浪事件向更高频次、 更长时间、 更强的方向演变, 三项指标的突变点一致且滞后于气温突变点, 出现在2000年, 突变前, 热浪指数呈不显著下降趋势; 突变后则转变为显著上升趋势, 且热浪强度增幅远超频次与持续时间。
(2) 城市化对气温、 热浪频次、 持续时间和强度的影响显著。城市站点日最高气温[0.243 ℃·(10a)-1]和日平均气温[0.261 ℃·(10a)-1]上升趋势均显著高于农村站点[0.171 ℃·(10a)-1、 0.167 ℃·(10a)-1], 说明城市化对增温存在放大作用。城市与农村站点的HWN、 HWDU和HWI均显著上升。城市站点热浪指数上升趋势远强于农村站点, 意味着城市化可能对高温热浪起着增强的作用。
(3) 根据数值模拟结果, URBAN试验对模拟区域内2 m气温的模拟具有较高的可信度, 能够较好地捕捉气温的日变化趋势。在高温日和非高温日时期, 城市下垫面对气温的影响存在差异。高温日期间, 城乡站点气温整体较高, URBAN 试验气温高于 NOURBAN 试验, 且两者气温差值在高温日更大, 夜间尤为明显。相比农村站点, 城市站点的气温差值更大, 可能与城市下垫面特性、 热岛效应及城乡对下垫面变化的响应差异有关。URBAN 试验中, 城市地区为高热容、 低反照率的不透水面, 而 NOURBAN 试验中城市区域被农田替代, 使得城市站点对下垫面变化更敏感。
(4) 城市下垫面的存在显著改变了地表能量平衡, 对比URBAN试验和NOURBAN试验分别在高温日与非高温日的差值, 发现城市站点的感热通量、 潜热通量和地表储热在高温日时期的差值更大, 表明城市化增强了高温日的地表能量变化, 使得气温差值增大。而农村站点的能量通量差异较小, 说明城市化对自然地表的影响较为有限。这一结果解释了为何城市站点不论是高温日时期还是非高温日时期的气温差值更大, 而农村站点整体差异较小。
Anderson G B Bell M L2011.Heat waves in the United States: mortality risk during heat waves and effect modification by heat wave characteristics in 43 U.Scommunities[J].Environmental Health Perspectives119(2): 210-218.DOI: 10.1289/ehp. 1002313 .

Brousse O Martilli A Foley M, et al, 2016.WUDAPT, an efficient land use producing data tool for mesoscale models?Integration of urban LCZ in WRF over Madrid[J].Urban Climate, 17: 116-134.DOI: 10.1016/j.uclim.2016.04.001 .

Cao Q Yu D Y Georgescu M, et al, 2018.Impacts of future urban expansion on summer climate and heat-related human health in Eastern China[J].Environment International, 112: 134-146.DOI: 10.1016/j.envint.2017.12.027 .

Chen J Li Q L Niu J, et al, 2011.Regional climate change and local urbanization effects on weather variables in Southeast China[J].Stochastic Environmental Research and Risk Assessment25(4): 555-565.DOI: 10.1007/s00477-010-0421-0 .

Chen L Frauenfeld O W2016.Impacts of urbanization on future climate in China[J].Climate Dynamics47(1): 345-357.DOI: 10.1007/s00382-015-2840-6 .

Ding T Qian W H Yan Z W2010.Changes in hot days and heat waves in China during 1961-2007[J].International Journal of Climatology30(10): 1452-1462.DOI: 10.1002/joc.1989 .

Domeisen D I V Eltahir E A B Fischer E M, et al, 2023.Prediction and projection of heatwaves[J].Nature Reviews Earth & Environment4(1): 36-50.DOI: 10.1038/s43017-022-00371-z .

Fernández M E Picone N Gentili J O, et al, 2021.Analysis of the urban energy balance in Bahía Blanca (Argentina)[J].Urban Climate, 37: 100856.DOI: 10.1016/j.uclim.2021.100856 .

Kong D D Gu X H Li J F, et al, 2020.Contributions of global warming and urbanization to the intensification of human-perceived heatwaves over China[J].Journal of Geophysical Research: Atmospheres125(18): e2019JD032175.DOI: 10. 1029/2019JD032175 .

Kovats R S Hajat S2008.Heat stress and public health: a critical review[J].Annual Review of Public Health, 29: 41-55.DOI: 10.1146/annurev.publhealth.29.020907.090843 .

Kwon M Jhun J G Ha K J2007.Decadal change in East Asian summer monsoon circulation in the mid-1990s[J].Geophysical Research Letters34(21): L21706.DOI: 10.1029/2007GL031977 .

Li H M Dai A G Zhou T J, et al, 2010.Responses of East Asian summer monsoon to historical SST and atmospheric forcing during 1950-2000[J].Climate Dynamics34(4): 501-514.DOI: 10.1007/s00382-008-0482-7 .

Lin L J Ge E J Liu X P, et al, 2018.Urbanization effects on heat waves in Fujian Province, Southeast China[J].Atmospheric Research, 210: 123-132.DOI: 10.1016/j.atmosres.2018.04.011 .

Liss A Wu R R Chui K K H, et al, 2017.Heat-related hospitalizations in older adults: an amplified effect of the first seasonal heatwave[J].Scientific Reports, 7: 39581.DOI: 10.1038/srep39581 .

Liu X J Tian G J Feng J M, et al, 2018.Modeling the warming impact of urban land expansion on hot weather using the weather research and forecasting model: a case study of Beijing, China[J].Advances in Atmospheric Sciences35(6): 723-736.DOI: 10.1007/s00376-017-7137-8 .

Lobell D B Schlenker W Costa-Roberts J2011.Climate trends and global crop production since 1980[J].Science333(6042): 616-620.DOI: 10.1126/science.1204531 .

Luo M Lau N C2019.Urban expansion and drying climate in an urban agglomeration of East China[J].Geophysical Research Letters46(12): 6868-6877.DOI: 10.1029/2019GL082736 .

Magnaye A M T Kusaka H2024.Potential effect of urbanization on extreme heat events in Metro Manila Philippines using WRF-UCM[J].Sustainable Cities and Society, 110: 105584.DOI: 10.1016/j.scs.2024.105584 .

McMichael A J Woodruff R E Hales S2006.Climate change and human health: present and future risks[J].The Lancet367(9513): 859-869.DOI: 10.1016/S0140-6736(6)68079-3 .

Mora C Dousset B Caldwell I R, et al, 2017.Global risk of deadly heat[J].Nature Climate Change7(7): 501-506.DOI: 10. 1038/nclimate3322 .

Patz J A Campbell-Lendrum D Holloway T, et al, 2005.Impact of regional climate change on human health[J].Nature438(7066): 310-317.DOI: 10.1038/nature04188 .

Perkins-Kirkpatrick S E Lewis S C2020.Increasing trends in regional heatwaves[J].Nature Communications, 11: 3357.DOI: 10.1038/s41467-020-16970-7 .

Pettitt A N1979.A non-parametric approach to the change-point problem[J].Journal of the Royal Statistical Society Series C (Applied Statistics)28(2): 126-135.

Qi L Wang Y Q2012.Changes in the observed trends in extreme temperatures over China around 1990[J].Journal of Climate25(15): 5208-5222.DOI: 10.1175/JCLI-D-11-00437.1 .

Ren G Y Zhou Y Q2014.Urbanization effect on trends of extreme temperature indices of National Stations over mainland China, 1961-2008[J].Journal of Climate27(6): 2340-2360.DOI: 10.1175/JCLI-D-13-00393.1 .

Ren Z B Fu Y Dong Y L, et al, 2022.Rapid urbanization and climate change significantly contribute to worsening urban human thermal comfort: A national 183-city, 26-year study in China[J].Urban Climate, 43: 101154.DOI: 10.1016/j.uclim.2022. 101154 .

Schneider A Mertes C M2014.Expansion and growth in Chinese cities, 1978-2010[J].Environmental Research Letters9(2): 024008.DOI: 10.1088/1748-9326/9/2/024008 .

Sen P K1968.Estimates of the regression coefficient based on Kendall’s tau[J].Journal of the American Statistical Association63(324): 1379-1389.DOI: 10.1080/01621459.1968.10480934 .

Stewart I D Oke T R2012.Local climate zones for urban temperature studies[J].Bulletin of the American Meteorological Society93(12): 1879-1900.DOI: 10.1175/BAMS-D-11-00019.1 .

Stewart I D Oke T R Krayenhoff E S2014.Evaluation of the ‘local climate zone’ scheme using temperature observations and model simulations[J].International Journal of Climatology34(4): 1062-1080.DOI: 10.1002/joc.3746 .

Sun Y Zhang X B Ren G Y, et al, 2016.Contribution of urbanization to warming in China[J].Nature Climate Change6(7): 706-709.DOI: 10.1038/nclimate2956 .

Sun Y Zhang X B Zwiers F W, et al, 2014.Rapid increase in the risk of extreme summer heat in Eastern China[J].Nature Climate Change4(12): 1082-1085.DOI: 10.1038/nclimate2410 .

Tabassum A Hong S H Park K, et al, 2025.Simulating urban heat islands and local winds in the Dhaka metropolitan area, Bangladesh[J].Urban Climate, 59: 102284.DOI: 10.1016/j.uclim. 2024.102284 .

Wang F Y Duan K Q Zou L2019.Urbanization effects on human-perceived temperature changes in the North China Plain[J].Sustainability11(12): 3413.DOI: 10.3390/su11123413 .

Wang P Y Tang J P Sun X G, et al, 2017.Heat waves in China: definitions, leading patterns, and connections to large-scale atmospheric circulation and SSTs[J].Journal of Geophysical Research: Atmospheres122(20): 10, 679-10, 699.DOI: 10. 1002/2017JD027180 .

Wu X J Wang L C Yao R, et al, 2020.Quantitatively evaluating the effect of urbanization on heat waves in China[J].Science of the Total Environment, 731: 138857.DOI: 10.1016/j.scitotenv. 2020.138857 .

Yang J Huang X2021.30 m annual land cover and its dynamics in China from 1990 to 2019[J].Earth System Science Data Discussions, 2021: 1-29.DOI: 10.5194/essd-13-3907-2021 .

Yang J Yin P Sun J M, et al, 2019.Heatwave and mortality in 31 major Chinese cities: definition, vulnerability and implications[J].Science of the Total Environment, 649: 695-702.DOI: 10. 1016/j.scitotenv.2018.08.332 .

Yang Y Zhao N2023.Vulnerability assessment of urban agglomerations to the risk of heat waves in China since the 21st century[J].Environmental Pollution, 336: 122443.DOI: 10.1016/j.envpol.2023.122443 .

Yue S Wang C Y2004.The Mann-Kendall test modified by effective sample size to detect trend in serially correlated hydrological series[J].Water Resources Management18(3): 201-218.DOI: 10.1023/B: WARM.0000043140.61082.60 .

Zhou D C Xiao J F Frolking S, et al, 2022.Urbanization contributes little to global warming but substantially intensifies local and regional land surface warming[J].Earth's Future10(5): e2021EF002401.DOI: 10.1029/2021EF002401 .

安宁, 左志燕, 2021.1961~2017年中国地区热浪的结构变化[J].中国科学: 地球科学51(8): 1214-1226.DOI: 10.1007/s11430-020-9776-3.An N

Zuo Z Y2021.Structural changes of heat waves in China from 1961 to 2017[J].Scientia Sinica (Terrae)51(8): 1214-1226.DOI: 10.1007/s11430-020-9776-3 .

杜一博, 李双双, 冯典, 等, 2024.全球变暖背景下陕西省夏季极端降水及其大尺度环流特征[J].高原气象43(02): 342-352.DOI: 10.7522/j.issn.1000-0534.2023.00062.Du Y B

Li S S Feng D, et al, 2024.Characteristics of Extreme Summer Precipitation and Large-Scale Cir culation in Shaanxi Province under Global Warming[J].Plateau Meteorology43(2): 342-352.DOI: 10.7522/j.issn.1000-0534.2023.00062 .

李朝月, 崔鹏, 郝建盛, 等, 2023.1960年以来藏东南地区气温和降水的变化特征[J].高原气象42(2): 344-358.DOI: 10.7522/j.issn.1000-0534.2022.00010.Li C Y

Cui P Hao J S, et al, 2023.Variation characteristics of temperature and precipitation over the southeast Xizang since 1960[J].Plateau Meteorology42(2): 344-358.DOI: 10.7522/j.issn.1000-0534.2022.00010 .

李娟, 闫会平, 朱志伟, 2020.中国夏季极端气温与降水事件日数随平均气温变化的定量分析[J].高原气象39(3): 532-542.DOI: 10.7522/j.issn.1000-0534.2019.00042.Li J

Yan H P Zhu Z W2020.Quantitative analysis of changes of summer extremes temperature and precipitation days over China with respect to the mean temperature increase[J].Plateau Meteorology39(3): 532-542.DOI: 10.7522/j.issn.1000-0534.2019.00042 .

卢珊, 胡泽勇, 沈姣姣, 等, 2025.近62 年我国极端高温事件的时空变化特征[J].高原气象44(1): 201-213.DOI: 10.7522/j.issn.1000-0534.2024.00058.Lu S

Hu Z Y Shen J J, et al, 2025.Spatio-temporal variations of extreme heat events over China in recent 62 years[J].Plateau Meteorology44(1): 201-213.DOI: 10.7522/j.issn.1000-0534.2024.00058 .

王勇, 秦豪君, 王澄海, 等, 2024.2022年夏季西北干旱区一次持续性高温的成因分析[J].高原气象43(2): 450-463.DOI: 10.7522/j.issn.1000-0534.2023.00069.Wang Y

Qin H J Wang C H, et al, 2024.Analysis of the causes of a persistent heat wave in the summer of 2022 in the Northwest Arid Region[J].Plateau Meteorology43(2): 450-463.DOI: 10.7522/j.issn.1000-0534.2023.00069 .

杨涵洧, 马悦, 史军, 2018.全球变暖背景下长江三角洲夏季高温时空演变研究[J].长江流域资源与环境27(7): 1544-1553.DOI: 10.11870/cjlyzyyhj201807014.Yang H W

Ma Y Shi J2018.Spatial and temporal characteristics of summertime high temperature in Yangtze River Delta under the background of global warming[J].Resources and Environment in the Yangtze Basin27(7): 1544-1553.DOI: 10.11870/cjlyzyyhj201807014 .

叶殿秀, 尹继福, 陈正洪, 等, 2013.1961-2010年我国夏季高温热浪的时空变化特征[J].气候变化研究进展9(1): 15-20.DOI: 10.3969/j.issn.1673-1719.2013.01.003.Ye D X

Yin J F Chen Z H, et al, 2013.Spatio-temporal variation characteristics of high temperature heat wave in summer in China from 1961 to 2010[J].Advances in Climate Change Research9(1): 15-20.DOI: 10.3969/j.issn.1673-1719.2013.01.003 .

张嘉仪, 钱诚, 2020.1960-2018年中国高温热浪的线性趋势分析方法与变化趋势[J].气候与环境研究25(3): 225-239.DOI: 10.3878/j.issn.1006-9585.2020.19134.Zhang J Y

Qian C2020.Linear trends in occurrence of high temperature and heat waves in China for the 1960-2018 period: method and analysis results[J].Climatic and Environmental Research25(3): 225-239.DOI: 10.3878/j.issn.1006-9585.2020.19134 .

张玉翠, 赵琳, 谭江红, 等, 2025.去城市化作用前后华中区域气温对比分析[J].高原气象44(3): 810-822.DOI: 10.7522/j.issn.1000-0534.2024.00092.Zhang Y C

Zhao L Tan J H, et al, 2025.Comparative analysis on air temperature before and after de-urbanization in Central China[J].Plateau Meteorology44(3): 810-822.DOI: 10.7522/j.issn.1000-0534.2024.00092 .

周波涛, 钱进, 2021.IPCC AR6报告解读: 极端天气气候事件变化[J].气候变化研究进展17(6): 713-718.DOI: 10.12006/j.issn.1673-1719.2021.167.Zhou B T

Qian J2021.Changes of weather and climate extremes in the IPCC AR6[J].Advances in Climate Change Research17(6): 713-718.DOI: 10.12006/j.issn.1673-1719.2021.167 .

Outlines

/