
1 引言
2 数据来源与方法介绍
2.1 数据来源
2.2 方法介绍
3 结果分析
3.1 暴雨过程和环流特征
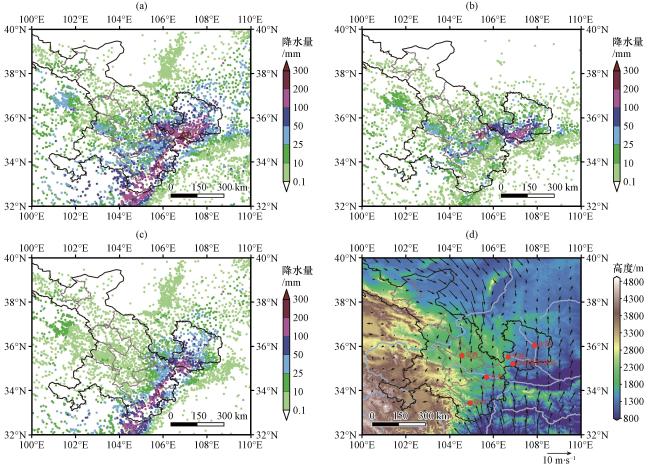
图1 2024年7月22 -24日(a)、 22日(b)、 23日(c)的自动站累计降水量(彩色圆点, 单位: mm), 甘肃省(黑色轮廓线表示甘肃省界)以及周边区域地形高度分布(填色, 单位: m)及7月22 -23日800 hPa风场(矢量, 单位: m·s-1)(d)图(d)中红色实心圆分别代表对应的气象观测站 Fig.1 Cumulative precipitation (colored dots, unit: mm) observed by automatic weather stations from 22 to 24 July (a), July 22 (b) and July 23(c) of 2024, Gansu Province (black contour line indicates the boundary of Gansu Province) and the terrain height distribution (the shading, unit: m) in the surrounding areas, 800 hPa wind field (vector, unit: m·s-1) from 22 to 23 July, 2024 (d).In Fig.1(d), the red solid dot represents the corresponding meteorological observation station |
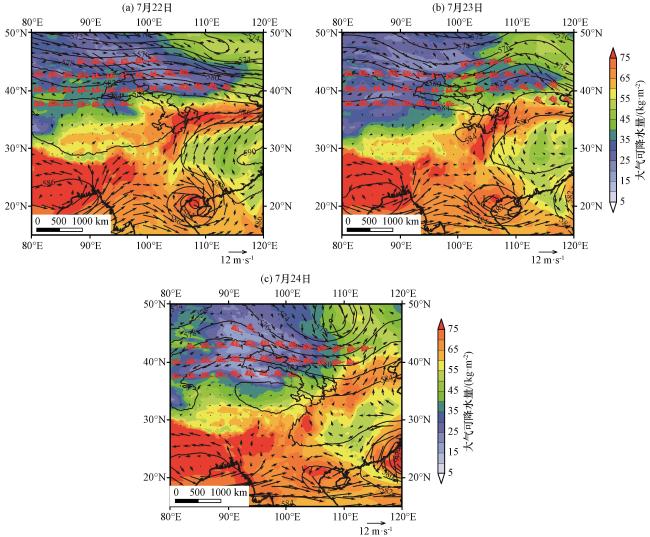
图2 2024年7月22 -24日的500 hPa位势高度(黑色实线, 单位: dagpm)、 700 hPa风场(矢量, 单位: m·s-1)、 200 hPa大于或等于30 m·s-1的风矢量(红色风向杆, 单位: m·s-1), 整层大气可降水量(填色, 单位: kg·m-2)(a)7月22日, (b)7月23日, (c)7月24日Fig.2 The average 500 hPa geopotential height (black solid line, unit: dagpm), 700 hPa wind field (vector, unit: m·s-1), 200 hPa wind vector greater than or equal to 30 m·s-1 (red barb, unit: m·s-1), and total precipitable water vapor (shading, unit: kg·m-2) from 22 to 24 July, 2024.(a) July 22, (b) July 23, (c) July 24 |
3.2 水汽输送及收支
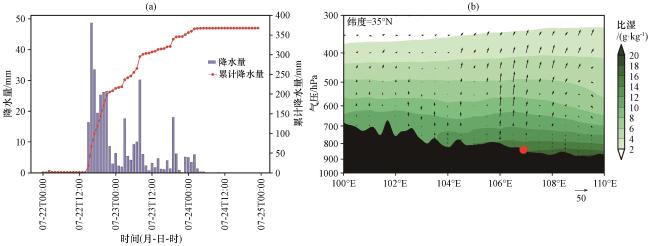
图3 7月22 -24日崇信新窑林场站(106.9°E, 35.2°N)降雨量(柱状图, 单位: mm)和累计降雨量(红色圆点线, 单位: mm)(a), 7月22 -24日沿35°N的比湿(填色, 单位: g·kg-1)与水平纬向风分量(单位: m·s-1)与垂直风(单位: ×100 Pa·s-1)的合成风场(矢量)的经度-气压剖面演变(b, 红色实心圆代表崇信新窑林场站)Fig.3 Hourly variation of hourly precipitation (bar, unit: mm) and cumulative precipitation (red dotted line, unit: mm) at Chongxin Xinyao Forest Farm Station (106.9 °E, 35.2 °N) from July 22 to 24 (a), The longitude-pressure profile evolution of specific humidity (shading, unit: g·kg-1) and the combined wind field (vector) of the horizontal zonal wind (unit: m·s-1) and vertical wind (unit: ×100 Pa·s-1) along 35 °N from 22 to 24 July 2024 (b, red solid dot represents Chongxin Xinyao Forest Farm Station) |
3.2.1 水汽输送特征
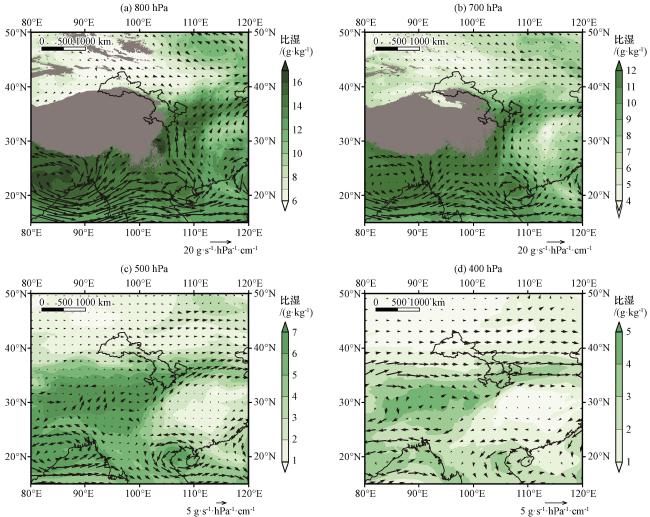
图4 2024年7月22 -24日的平均比湿(填色, 单位: g·kg-1)和等压面水汽通量(矢量, 单位: g·s-1·hPa-1·cm-1)(a)800 hPa, (b)700 hPa, (c)500 hPa, (d)400 hPaFig.4 Average specific humidity (the shading, unit: g·kg-1) and isobaric surface water vapor flux (vector, unit: g·s-1·hPa-1·cm-1) from July 22 to 24, 2024.(a) 800 hPa, (b) 700 hPa, (c) 500 hPa, (d) 400 hPa |
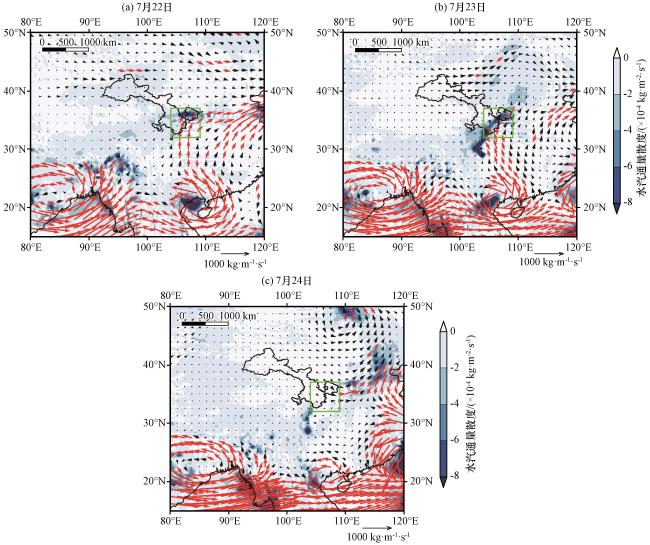
图5 2024年7月22 -24日平均整层水汽通量(矢量, 单位: kg·m-1·s-1)和水汽通量散度(填色, 单位: ×10-4 kg·m-2·s-1)(a)7月22日, (b)7月23日, (c)7月24日; 右下角标度尺为1000 kg·m-1·s-1, 其中红色(黑色)箭头表示大于或等于(小于)250 kg·m-1·s-1Fig.5 Daily average of the entire layer water vapor flux (vector, unit: kg·m-1·s-1) and water vapor flux divergence (shading, unit: ×10-4 kg·m-2·s-1) from July 22 to 24, 2024.(a) July 22, (b) July 23, (c) July 24.The scale in the lower right corner is 1000 kg·m-1·s-1, the red (black) arrow indicates greater than or equal to (less than) 250 kg·m-1·s-1 |
3.2.2 水汽收支特征
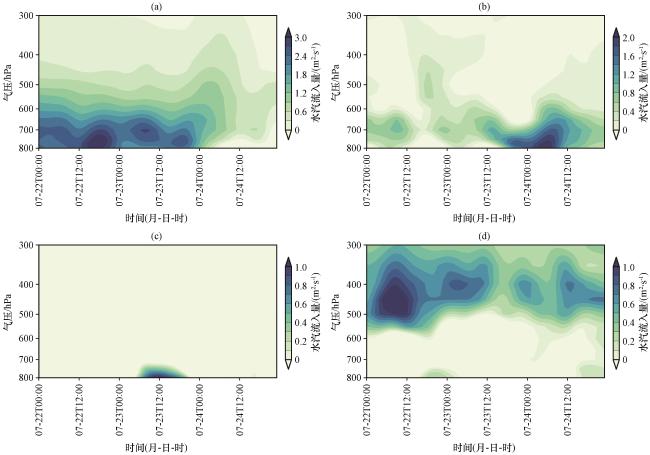
图6 2024年7月22 -24日暴雨区域(104°E -109°E, 32°N -37°N)上空南(a)、 北(b)、 东(c)、 西(d)边界水汽收支量演变(单位: ×105 m2·s-1)填色区域表示水汽流入 Fig.6 Evolution of water vapor budget over the rainstorm area (104°E -109°E, 32°N -37°N) from July 22 to 24, 2024.Unit: ×105 m2·s-1.(a) the southern boundary, (b) the northern boundary, (c) the eastern boundary, (d) the western boundary.Where color shading indicates water vapor inflow |
表1 不同时间段暴雨区域分层垂直积分的水汽通量Table 1 Water vapor flux of stratified vertical integration in rainstorm area in different time periods |
| 时间 | 层次 | 水汽通量/(kg·m-1·s-1) | ||||
|---|---|---|---|---|---|---|
| 总 | 南 | 北 | 东 | 西 | ||
| 22日 | 整层 | 106 | 610 | 58 | -542 | -20 |
| 800~700 hPa | 69 | 262 | 26 | -165 | -54 | |
| 700~500 hPa | 26 | 312 | 40 | -278 | -48 | |
| 500~400 hPa | 11 | 36 | -8 | -99 | 82 | |
| 23日 | 整层 | 185 | 527 | 47 | -252 | -137 |
| 800~700 hPa | 256 | 228 | 68 | -14 | -26 | |
| 700~500 hPa | -42 | 267 | 8 | -159 | -158 | |
| 500~400 hPa | -29 | 32 | -29 | -79 | 47 | |
| 22 -24日 | 整层 | 378 | 1339 | 315 | -1260 | -16 |
| 800~700 hPa | 379 | 519 | 218 | -269 | -89 | |
| 700~500 hPa | 34 | 718 | 142 | -715 | -111 | |
| 500~400 hPa | -35 | 102 | -45 | -276 | 184 | |
3.3 水汽来源追踪
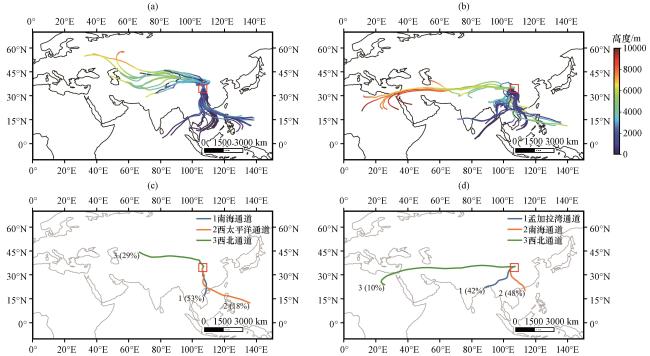
图7 HYSPLIT轨迹模式模拟的2024年7月22日18:00初始高度2500 m(a)、 7月22日06:00初始高度5500 m气团后向追踪7 d的轨迹分布(b), 对应(a)中的聚类水汽通道分布和轨迹数量占比(c)以及对应(b)中的聚类水汽通道分布和轨迹数量占比(d)Fig.7 The trajectory distribution of air mass backward tracking for 7 days simulated by HYSPLIT trajectory mode.(a) initial height of 2500 m at 18:00 on July 22, 2024; (b) initial height of 5500 m at 06:00 on July 22, 2024.(c) corresponds to the distribution and number of trajectories of the clustered water vapor channels in (a), while (d) corresponds to the distribution and number of trajectories of the clustered water vapor channels in (b) |
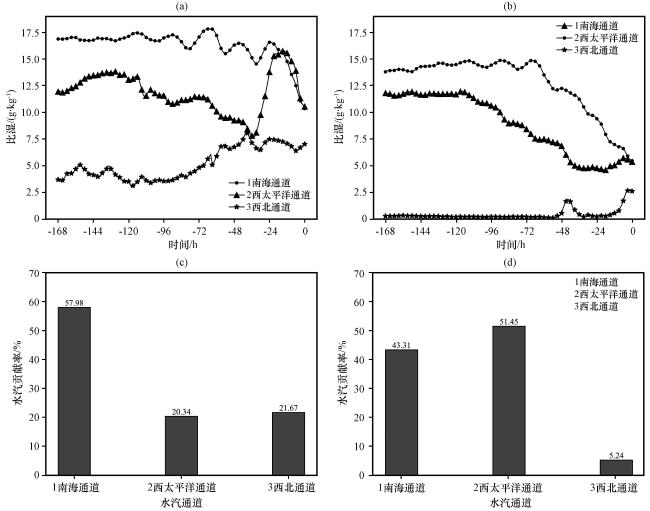
图8 HYSPLIT轨迹模式模拟的2024年7月22日18:00初始高度2500 m(a)、 2024年7月22日06:00初始高度5500 m对应的水汽通道比湿变化(b), (c)(d)分别对应(a)(b)两次模拟的各水汽通道对目标降水区的水汽贡献率Fig.8 The specific humidity changes of the water vapor channel corresponding to the initial height of 2500 m at 18:00 on July 22, 2024 (a), and the initial height of 5500 m at 06:00 on July 22, 2024 (b), simulated by the HYSPLIT.Figures (c) and (d) correspond to the water vapor contribution rates of each simulated water vapor channel in (a) and (b) to the target precipitation area, respectively |