
1 引言
2 资料来源和方法介绍
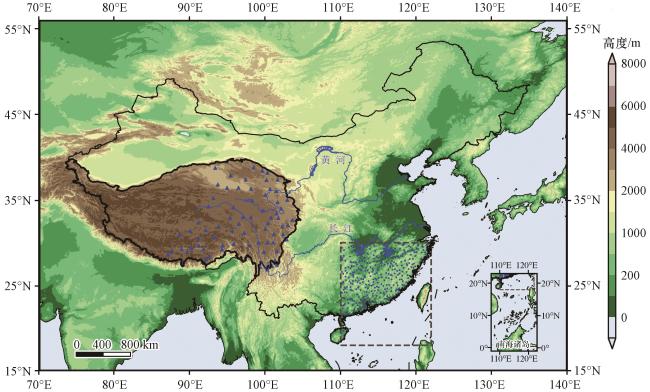
2.1 研究资料
2.2 地表感热通量计算方法
2.3 高原地表感热春季增强量的定义
2.4 南方春雨量的定义
2.5 分析方法
3 高原春季地表感热达最强时间和增强强度特征
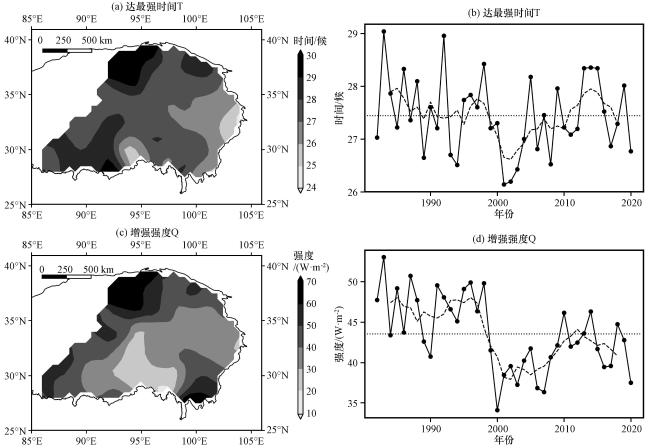
图2 1982 -2020年高原春季地表感热达最强时间T(a, b, 单位: 候)和增强强度Q(c, d, 单位: W·m-2)气候态平均的空间分布(a, c)和时间演变(b, d)图(b)和(d)中, 虚线为五点平滑值, 点线为平均值 Fig.2 The climatological mean spatial distribution (a, c) and temporal evolution of the peak time T (a, b, unit: pentad) and enhancement intensity Q (c, d; unit: W·m⁻²) of the springtime sensible heat over the Qinghai-Xiang Plateau from 1982 to 2020.In (b) and (d), the dashed line represents the five-point smoothed values, and the solid lines represent the mean values |
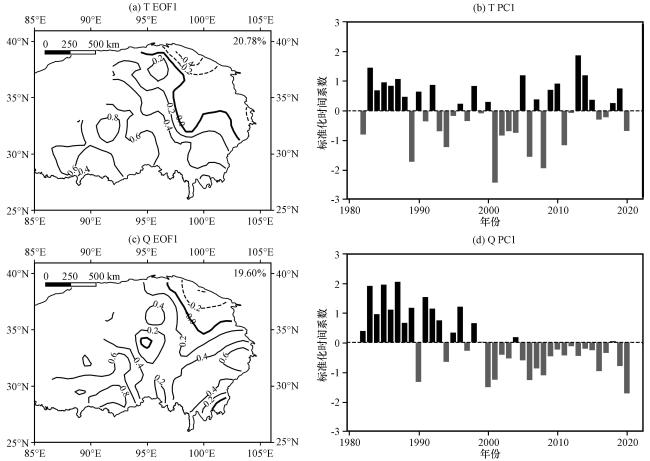
图3 1982 -2020年高原春季地表感热达最强时间T(a, b)和增强强度Q(c, d)EOF第一主模态(a, c)及其对应的标准化时间系数(b, d)(a)和(c)中, 实线(虚线)表示正(负)值Fig.3 The first EOF mode (a, c) and corresponding standardized time coefficients (b, d) of the peak time T (a, b) and enhancement intensity Q (c, d) of the springtime sensible heat over the Qinghai-Xizang Plateau from 1982 to 2020.In (a) and (c), solid lines (dashed lines) represent positive (negative) values |
4 高原春季地表感热增强与中国南方春雨的联系
表1 高原地表感热增强与中国南方春雨量的相关系数Table 1 The relationship between the surface sensible heat enhancement on the Qinghai-Xizang Plateau and the spring rainfall over the southern China |
| T PC1 | Q PC1 | ISH | ISH-ININO3.4 | ISH-IIOBM | |
|---|---|---|---|---|---|
| 相关系数 | 0.55** | 0.42** | 0.60** | 0.55** | 0.60** |
**代表通过α=0.01显著性水平t检验(** represents over 0.01 significance level of t test) |
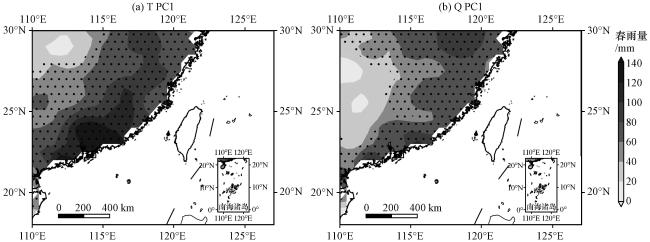
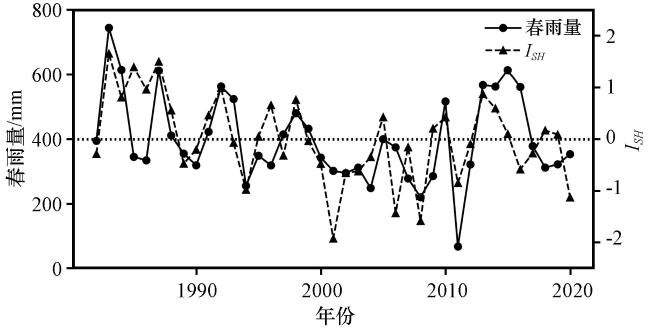
图5 1982 -2020年ISH 指数与中国南方春雨的逐年演变Fig.5 Annual evolution of ISH index and spring rain in Southern China from 1982 to 2020 |
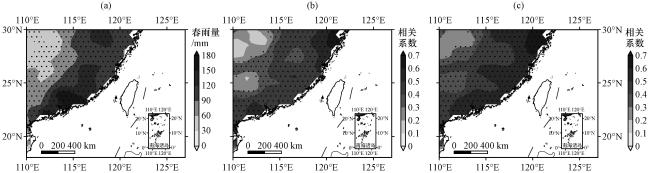
图6 ISH 指数回归中国南方春雨总量(a, 单位: mm), 以及分别去除春季ININO3.4 (b)和IIOBM (c)影响后的偏相关打点区域通过了α=0.1显著性水平t检验 Fig.6 Regression of ISH index and total spring rain in Southern China (a, unit: mm), and partial correlations after removing the influence of spring ININO3.4 (b) and IIOBM (c), respectively.The dotted areas passed the t-test of significance level α=0.1 |
5 高原春季地表感热增强影响中国南方春雨的关键环流系统
5.1 西风急流的影响
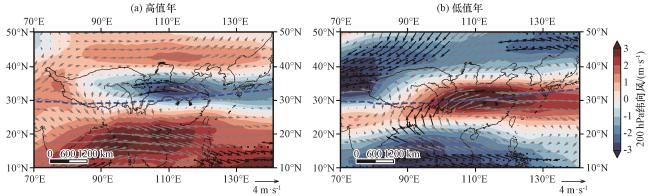
图7 ISH 异常高值年(a)和低值年(b)合成的春季200 hPa纬向风场分布(阴影, 单位: m·s-1)和风场(矢量, 单位: m·s-1)蓝色虚线为春季西风急流轴平均位置; 打点区域和黑色箭头通过了α=0.1显著性水平t检验 Fig.7 Composite distribution of the spring 200 hPa zonal wind (shading, unit: m·s-1) and wind vectors (arrows, unit: m·s-1) for years with high (a) and low (b) ISH anomalies.Blue dashed line represents the average position of the spring westerly jet axis, the dotted areas and black arrows passed the t-test of significance level α=0.1 |
5.2 中低层环流的影响
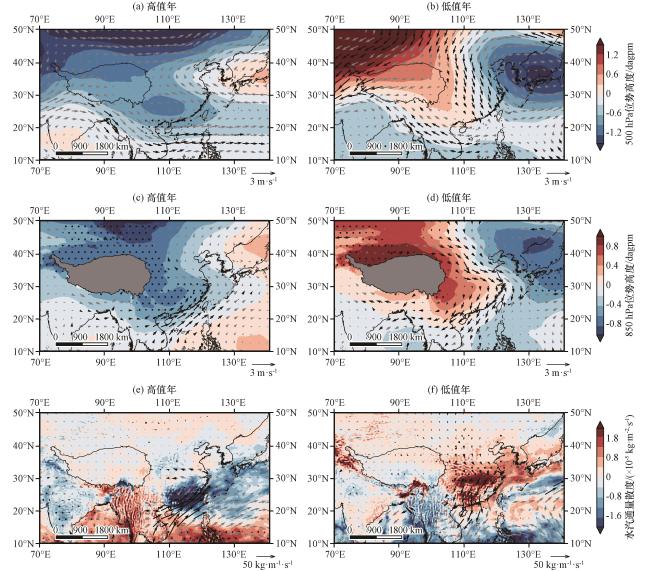
图8 ISH 异常高值年和低值年合成的春季500 hPa(a, b) 和850 hPa(c, d)位势高度场(阴影, 单位: dagpm)和风场(矢量, 单位: m·s-1)、 整层水汽通量(矢量, 单位: kg·m-1·s-1) 和水汽通量散度(阴影, 单位: ×10-5 kg·m-2·s-1)(e, f)打点区域和黑色箭头表示通过了α=0.1显著性水平t检验, (a), (c), (e)为高值年; (b), (d), (f)为低值年Fig.8 Composite of the spring 500 hPa (a, b) and 850 hPa (c, d) geopotential height (shading, unit: dagpm) and wind (vector, unit: m·s-1), spring total column water vapor flux (vector, unit: kg·m⁻¹·s⁻¹) and water vapor flux divergence (shaded, unit: ×10⁻⁵ kg·m⁻²·s⁻¹) (e, f) for years with high and low ISH anomalies.Dotted areas and black arrows indicate significance at the α=0.1 level based on the t-test; (a), (c), (e) for high value years; (b), (d), (f) for low value years |
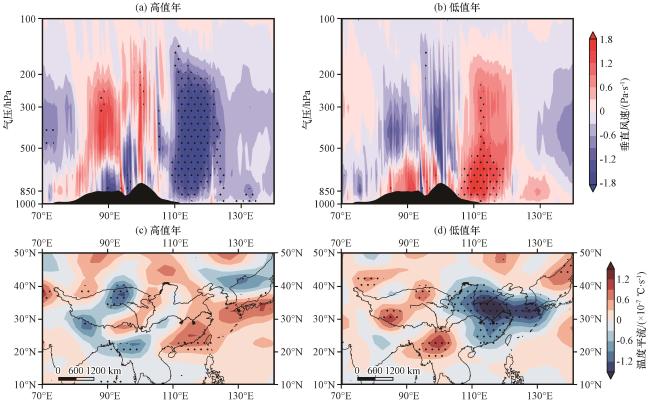
5.3 垂直环流的影响
图9 ISH 异常高值年和低值年合成的春季20°N -30°N平均剖面垂直风速(a, b, 单位: Pa·s-1)和500 hPa温度平流场(c, d, 单位: ×10-7 ℃·s-1)打点区域通过了α=0.1显著性水平t检验, (a), (c)为高值年; (b), (d)为低值年Fig.9 Composite of the spring average vertical wind speed profile between 20°N -30°N (a, b, unit: Pa·s-1) and the 500 hPa temperature advection (c, d, unit: ×10⁻⁷ ℃·s-1) for years with high and low ISH anomalies.Dotted areas indicate significance at the α=0.1 level based on the t-test; (a), (c) for high value years; (b), (d) for low value years |