
1 引言
2 数据选取与方法介绍
2.1 观测站点概况及资料选取和处理

2.2 方法介绍
2.2.1 CEEMD算法与相干结构模态的确定
表1 30 min序列CEEMD分解后不同变量的平均周期Table 1 Average period of different variables after CEEMD decomposition of 30 minutes sequence |
| IMF分解阶数j | 不同变量的平均周期/s | |||
|---|---|---|---|---|
| u | w | T | q | |
| 1 | 0.31 | 0.30 | 0.31 | 0.30 |
| 2 | 0.79 | 0.75 | 0.77 | 0.76 |
| 3 | 1.91 | 1.80 | 1.85 | 1.80 |
| 4 | 4.70 | 4.34 | 4.41 | 4.24 |
| 5 | 11.69 | 10.52 | 10.52 | 10.22 |
| 6 | 24.66 | 23.70 | 23.65 | 23.68 |
| 7 | 54.55 | 47.36 | 54.54 | 51.42 |
| 8 | 120 | 105.88 | 120 | 112.5 |
| 9 | 225 | 225 | 300 | 257.14 |
| 10 | 600 | 600 | 900 | 450 |
| 11 | 1800 | 1800 | 1800 | 1800 |
| 12 | 1800 | 1800 | 1800 | 1800 |
| 13 | 1800 | 1800 | 1800 | 1800 |
2.2.2 条件平均
3 结果分析
3.1 相干结构平均模态

图2 20 m高度处中度稳定条件下( )IMF5-IMF7的 , , , 的条件平均值(黑色线代表单组半小时数据的条件平均值, 红色线为条件平均结果)Fig.2 The conditional average of IMF5-IMF7, , , and under moderate stable conditions ( ) at a height of 20 m (the black line represents the conditional average of a single group of half hour data, and the red line represents the conditional average result) |

图3 20 m高度处中度不稳定条件下( )IMF5-IMF7的, , , , 的条件平均值(黑色线代表单组半小时数据的条件平均值, 红色线为条件平均结果)Fig.3 The conditional average of IMF5-IMF7, , , and under moderate unstable conditions ( ) at a height of 20 m (the black line represents the conditional average of a single group of half hour data, and the red line represents the conditional average result) |
3.2 相干结构的通量贡献


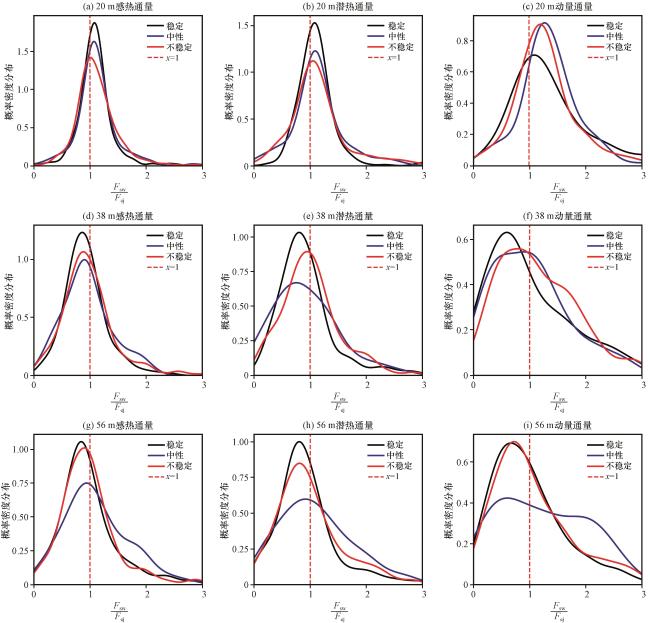
图5 20 m、 38 m和56 m不同稳定度下相干结构通量贡献的概率分布Fig.5 Probability distribution of flux contribution of coherent structures under different stability levels of 20 m, 38 m and 56 m |
表2 三个高度不同稳定层结下相干结构平均通量贡献Table 2 The average flux contribution of coherent structures under different stability levels at three heights |
| 层结类型 | 20 m | 38 m | 56 m | ||||||||
|---|---|---|---|---|---|---|---|---|---|---|---|
| 感热/% | 潜热/% | 动量/% | 感热/% | 潜热/% | 动量/% | 感热/% | 潜热/% | 动量/% | |||
| 稳定 | 19 | 16 | 7 | 16 | 10 | 5 | 16 | 12 | 6 | ||
| 中性 | 21 | 13 | 5 | 19 | 8 | 3 | 20 | 11 | 2 | ||
| 不稳定 | 15 | 12 | 6 | 10 | 7 | 5 | 10 | 10 | 5 | ||
3.3 相干结构斜坡强度与局地湍流参数的关系

图7 20 m、 38 m和56 m的u′的斜坡强度与稳定度参数ζ(左)和摩擦速度u *(右)的拟合曲线Fig.7 Fitting curves of u′ slope strength with stability parameter ζ (left) and friction velocity u * (right) for 20 m, 38 m and 56 m slopes |
