
1 引言
2 材料与方法
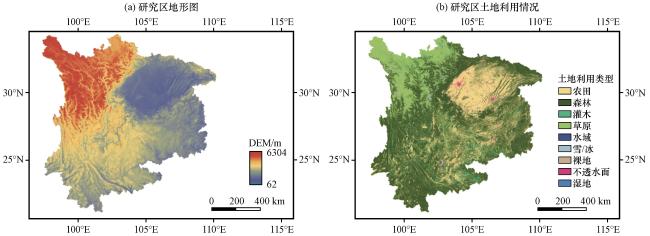
2.1 研究区域
2.2 数据描述
2.2.1 大气数据
2.2.2 遥感LAI和GPP产品
2.2.3 IMERG降水数据及中国1 km分辨率气温数据集
表1 数据使用情况Table 1 Data utilization |
| 数据名称 | 空间分辨率 | 时间分辨率 |
|---|---|---|
| GLASS-LAI | 0.05° | 8 d |
| GIMMS-LAI | 1/12° | 半月 |
| GLOBMAP-LAI | 0.08° | 8 d/半月 |
| GLASS-GPP | 0.05° | 8 d |
| GIMMS-GPP | 1/12° | 月 |
| GLOBMAP-GPP | 0.05° | 月 |
| 中国1 km分辨率逐月平均气温数据集 | 1 km | 月 |
| IMERG | 0.1° | 0.5 h |
| 中国区域地面气象要素驱动数据集 | 0.1° | 3 h |
2.3 方法
2.3.1 干旱监测及极端干旱事件的识别
表2 气象干旱分类标准Table 2 Meteorological drought classification criteria |
| 等级 | 类型 | SPEI |
|---|---|---|
| 1 | 无旱 | SPEI>-0.5 |
| 2 | 轻旱 | -1<SPEI≤-0.5 |
| 3 | 中旱 | -1.5<SPEI≤-1 |
| 4 | 重旱 | -2<SPEI≤-1.5 |
| 5 | 特旱 | SPEI≤-2 |
2.3.2 分析方法
2.3.3 植被对干旱的抵抗力和恢复力
2.3.4 CLM模拟方案
3 研究结果
3.1 驱动数据干旱表征的验证
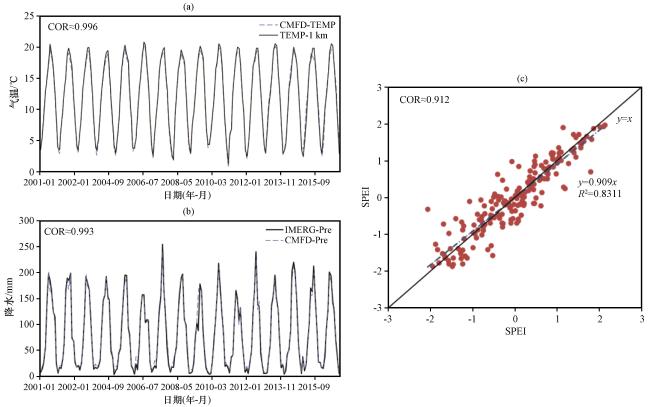
图2 驱动数据干旱表征情况的验证 (a)驱动数据 (CMFD-TEMP)与验证数据(TEMP-1 km) 气温的逐月变化, (b)驱动数据(CMFD-Pre)与IMERG数据(IMERG-Pre)降水的逐月变化, (c) 驱动数据与验证数据的SPEI拟合关系, 左上方COR为两种数据间的相关性系数Fig.2 Validation of drought characterization scenarios for driving data.(a) monthly variation in temperature between driving data (CMFD-TEMP) and validation data (TEMP-1 km); (b) monthly variation in precipitation between driving data (CMFD-Pre) and IMERG data (IMERG-Pre); (c) fit relationship of the SPEI between driving data and validation data; the correlation coefficient (COR) between the two datasets is shown in the upper left corner |
3.2 极端干旱事件的时空特征
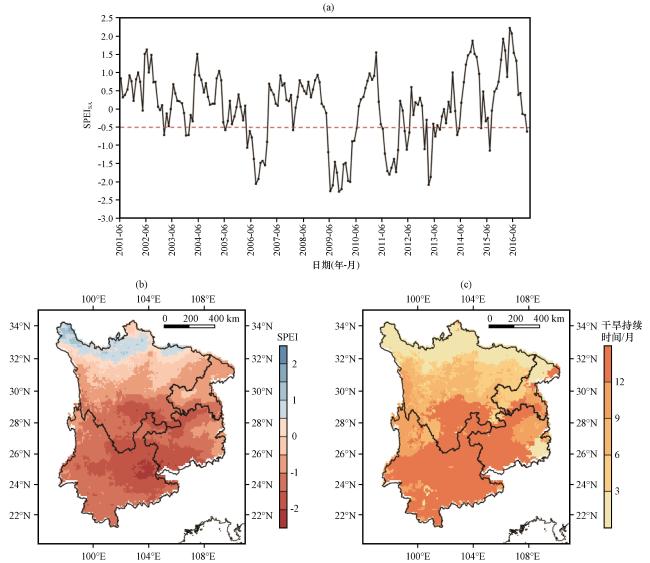
图3 西南地区极端干旱的时空分布 (a) 区域平均SPEI的标准化异常的趋势线; (b)极端干旱严重程度的空间特征; (c)极端干旱持续时间的空间特征(单位: 月)Fig.3 Spatial and temporal distribution of extreme droughts in Southwest China.(a) trend lines of standardized anomalies of regional mean SPEI; (b) spatial distribution of extreme drought severity; (c) spatial distribution of extreme drought duration (unit: month) |
3.3 西南地区2009 -2010年极端干旱下CLM5.0模拟验证
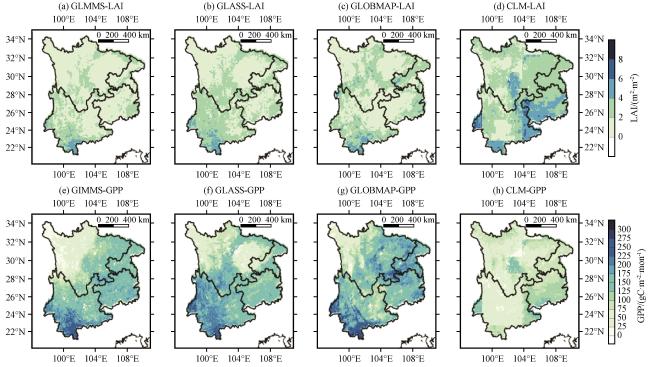
3.3.1 干旱期间LAI和GPP的空间分布特征
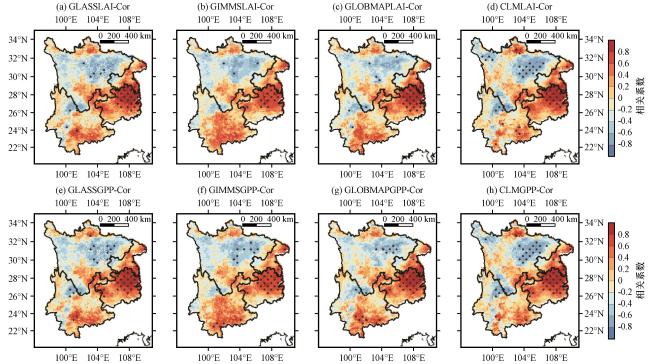
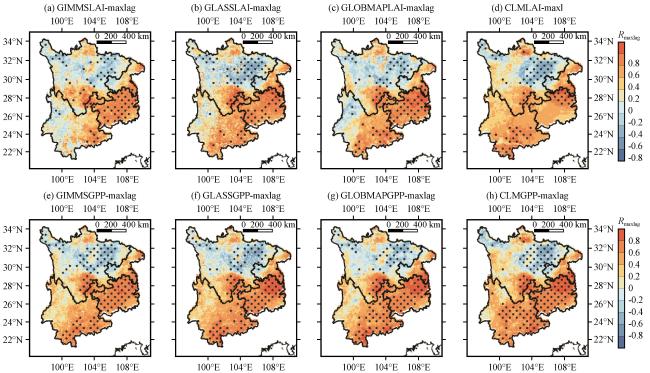
3.3.2 植被LAI与GPP对干旱的响应
3.3.3 干旱对植被LAI和GPP的时间滞后影响
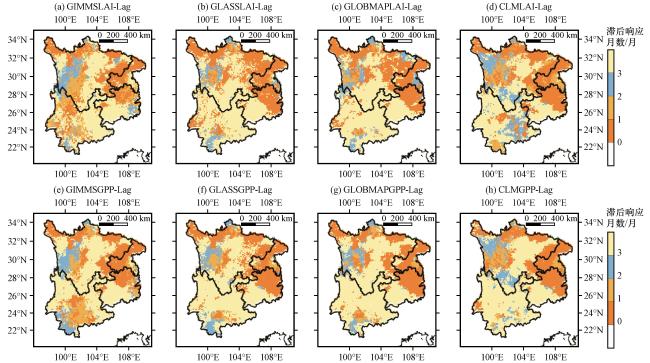
图6 遥感和模拟的LAI(a~d)和GPP(e~h)对干旱的滞后响应月数Fig.6 Months of lagged response of remote sensing and simulated LAI(a~d) and GPP(e~h) to drought |
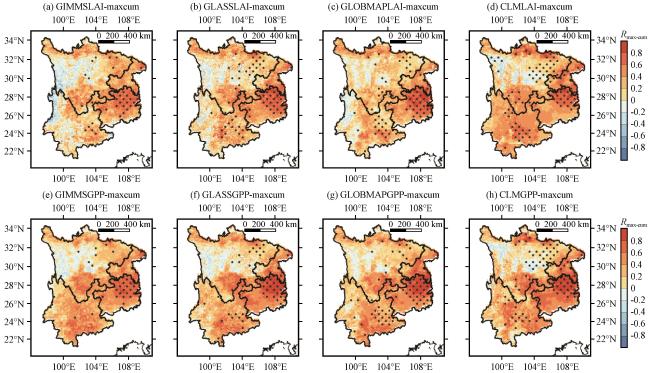
3.3.4 干旱对植被LAI和GPP的累积效应
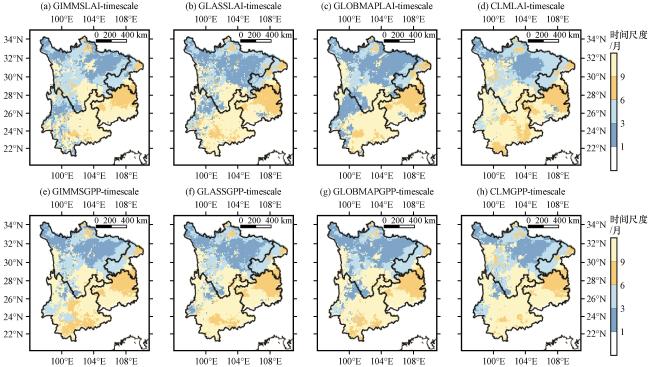
图8 干旱对植被LAI (a~d)和GPP (e~g)的累积效应时间尺度的模拟验证Fig.8 Simulation validation of the timescale of cumulative effects of drought on vegetation LAI (a~d) and GPP (e~g) |
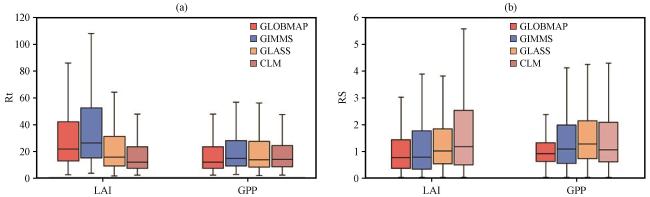
3.3.5 CLM对植被的干旱抵抗力和恢复力模拟情况
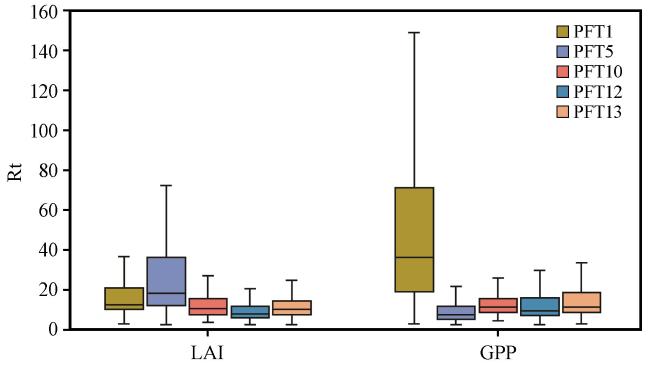
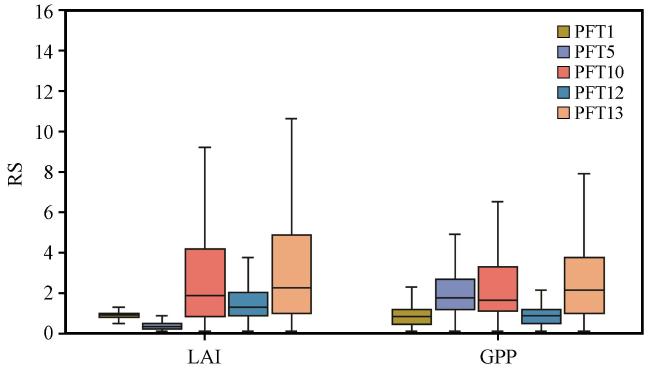
3.4 CLM对不同植被类型的干旱抵抗力和恢复力模拟情况
表3 西南地区主要植被类型Table 3 Main vegetation types in the Southwest China |
| 植被功能类型编号 | 植被类型 | 简称 |
|---|---|---|
| PFT1 | 温带针叶林 | NEM Tr |
| PFT5 | 温带常绿阔叶林 | BEM Tr |
| PFT10 | 温带落叶阔叶灌木 | BDM Tr |
| PFT12 | 高寒C3草甸 | C3 AR |
| PFT13 | 非高寒C3草甸 | C3 NA |