
1 引言
2 资料和方法
表1 印太海温异常指数定义Table 1 Definition of the Indian and Pacific Ocean Sea Surface Temperature Anomaly Index |
| 指数 | 名称 | 定义 |
|---|---|---|
| NINO 3.4 | NINO 3.4区海温距平指数 | |
| IOBW | 热带印度洋全区一致海温模态指数 |
3 1961 -2021年中国冬季降水的空间变化特征
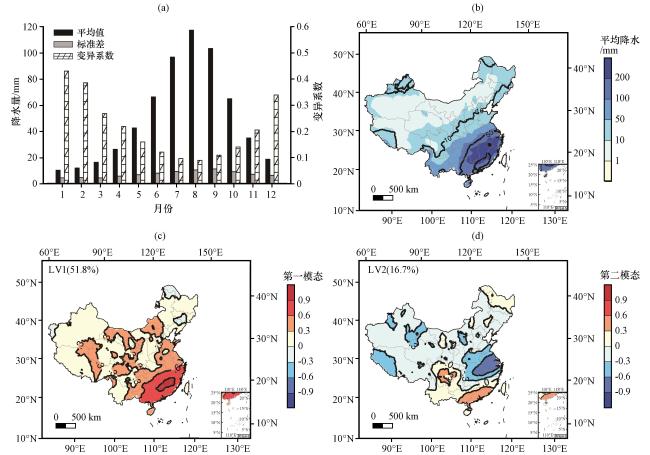
图1 1961 -2021年中国冬季降水的基本特征 (a)中国多年逐月降水的平均值(单位: mm), 标准差(单位: mm)和变异系数, (b)冬季降水的多年平均值(填色)和标准差(等值线)的空间分布, (c)中国冬季降水量的第一模态, (d)中国冬季降水量的第二模态Fig.1 Winter precipitation characteristics in China from 1961 to 2021.(a) monthly mean (unit: mm), standard deviation (STD, unit: mm), and CV of precipitation in China, (b) distribution of the mean (shading) and standard deviation (solid lines) of winter precipitation, (c) the first mode of winter precipitation in China, (d) the second mode |
4 1961 -2021年中国冬季降水的时间变化特征
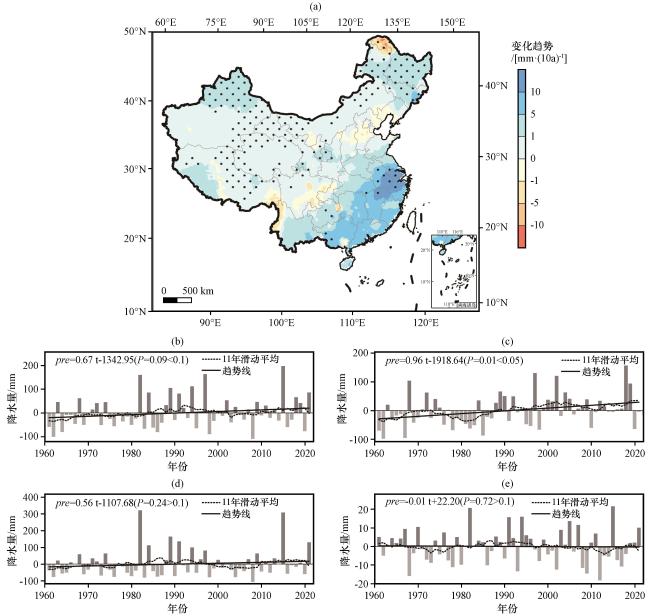
图2 1960 -2021年中国冬季降水(单位: mm)的时间变化特征 (a)变化趋势[填色, 单位: mm·(10a)-1], 其中打点区域表示通过95%信度检验, (b) 东南沿海 [图1(c)中LV1>0.6区域]的冬季降水随时间变化, (c) 长江下游[图1(d)中 >0.6区域], (d)华南沿海[图1(d)中 >0.3区域], (e)西南地区[图1(d)中 >0.3区域]Fig.2 Temporal characteristics of winter precipitation (unit: mm) in China from 1960 to 2021.(a) the trend of winter precipitation [shading, unit: mm·(10a)-1], where dotted areas indicate passing the 95% significance test, (b) winter precipitation time series in the southeast coast (LV1>0.6 area), (c) the lower reaches of the Yangtze River (|LV2|>0.6 area), (d) Southern China coastal region (|LV2|>0.3 area), and (e) the southwest region (|LV2|>0.3 area) |
5 海温异常对中国冬季降水的调控
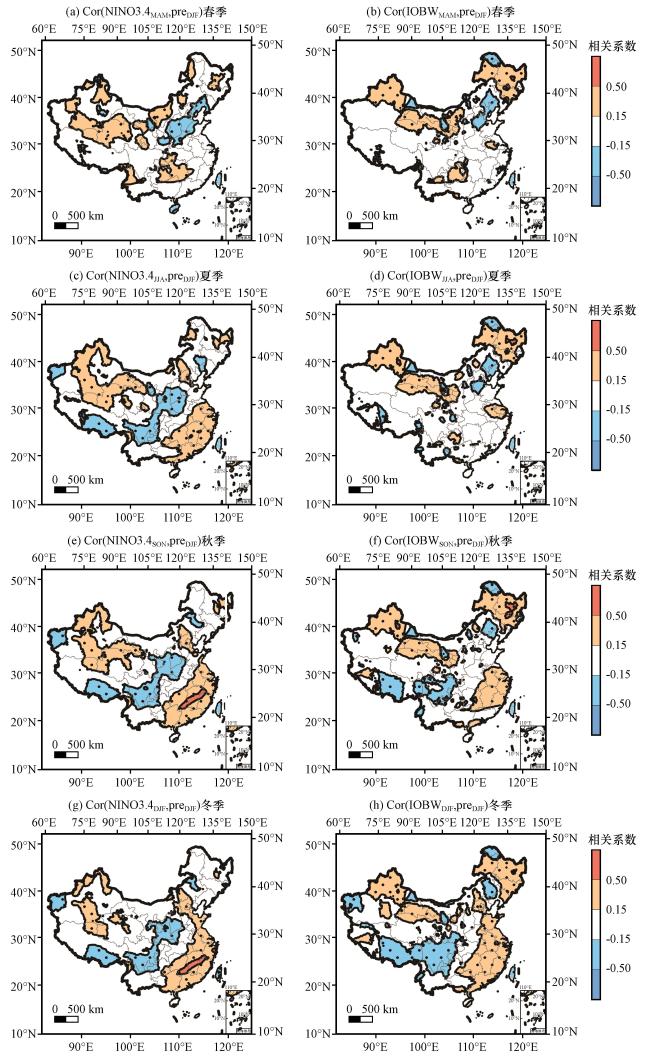
图4 1961 -2021年不同季节去线性趋势后赤道中东太平洋和热带印度洋海温异常信号(NINO3.4和IOBW)与中国冬季降水的相关系数 打点区域通过90%信度检验Fig.4 Correlation coefficients of detrended SST anomaly signals (NINO3.4 and IOBW) in the Eequatorial East-central Pacific and Tropical Indian Ocean with winter precipitation in China of different seasons from 1961 to 2021.The dotted area passed the 90% significance test |
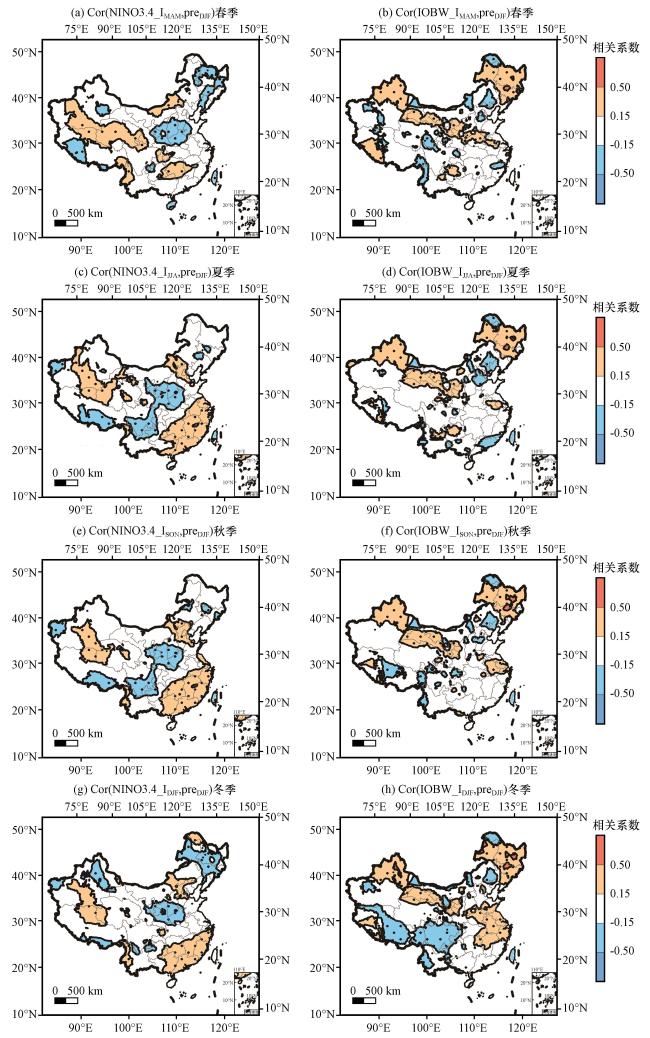
图5 1961 -2021年不同季节去掉线性趋势后赤道中东太平洋和热带印度洋海温独立异常信号(NINO3.4_I和IOBW_I)与中国冬季降水的相关系数 打点区域通过90%信度检验Fig.5 Correlation coefficients of detrended SST anomaly independent signals (NINO3.4_I and IOBW_I)in the Equatorial East-central Pacific and Tropical Indian Ocean with winter precipitation in China of different seasons from 1961 to 2021.The dotted area passed the 90% significance test |
表2 冬季标准化赤道中东太平洋和印度洋海温指数回归拟合的中国东南沿海和中国北方冬季降水Table 2 The validity of fitting winter precipitation in Southeastern coastal and Northern of China using the NINO3.4 and IOBW |
| 区域 | 回归模型 | 解释方差/% | 拟合结果与原值的相关系数 |
|---|---|---|---|
| 东南沿海 | 12.6 | 0.36* | |
| 2.6 | 0.16 | ||
| 34.8 | 0.59* | ||
| 中国北方 | 2.9 | 0.17 | |
| 26.9 | 0.52* | ||
| 30 | 0.54* |
*表示通过95%信度检验(* indicates that the value passed the 95% significance test) |
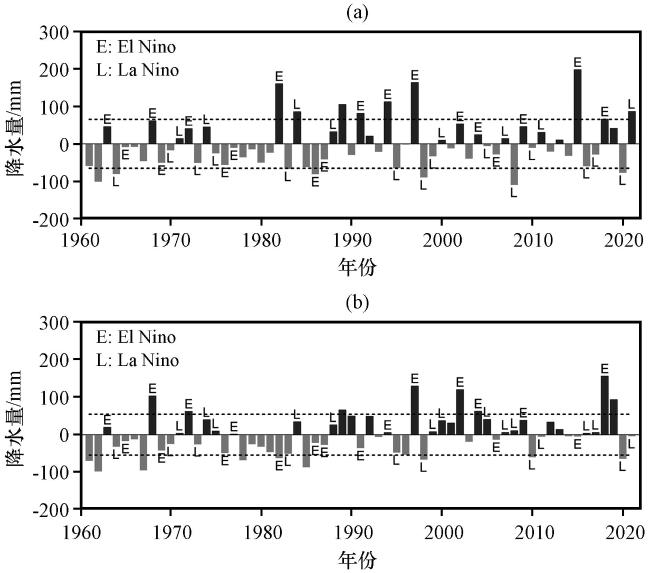
图6 1960 -2021年东南沿海(a)和长江下游(b)的冬季降水异常与冬季El Niño、 La Niña事件的关系 虚线表示冬季降水偏离1倍标准差Fig.6 Relationship between winter precipitation anomalies in the southeastern coastal area (a) and the lower reaches of the Yangtze River (b) with winter El Niño and La Niña events from 1960 to 2021.The dotted line represents the deviation of winter precipitation by 1 standard deviation |
表3 冬季降水异常和夏、 秋El Niño和La Niña事件的关系Table 3 Relationship between winter precipitation anomalies and summer and autumn El Niño and La Niña events |
| 年份 | 夏季NINO3.4海温距平/℃ | 秋季NINO3.4海温距平/℃ | 东南沿海冬季降水距平/mm | 长江下游冬季降水距平/mm | 全国冬季降水距平/mm | |
|---|---|---|---|---|---|---|
| El Niño发展型 | 1968 | 0.46 | 0.58 | 61.98 | 103.66 | 6.24 |
| 1969 | 0.43 | 0.82 | -50.22 | -42.21 | -7.93 | |
| 1976 | 0.16 | 0.76 | -56.22 | -49.05 | -9.74 | |
| 1977 | 0.37 | 0.70 | -10.68 | 1.91 | -0.59 | |
| 1986 | 0.21 | 0.93 | -80.95 | -22.02 | -6.52 | |
| 1994 | 0.43 | 0.77 | 112.45 | 6.03 | 12.30 | |
| 2004 | 0.46 | 0.68 | 24.68 | 63.14 | 6.20 | |
| 2006 | 0.12 | 0.75 | -28.01 | -13.30 | -2.57 | |
| 2009 | 0.44 | 1.03 | 46.25 | 38.60 | 4.57 | |
| 2018 | 0.10 | 0.72 | 66.21 | 156.57 | 13.56 | |
| El Niño持续型 | 1963 | 0.84 | 1.29 | 45.89 | 20.06 | 6.05 |
| 1965 | 1.20 | 1.93 | -8.71 | -16.98 | -1.77 | |
| 1972 | 1.14 | 1.84 | 40.98 | 62.41 | 4.20 | |
| 1982 | 0.86 | 1.91 | 160.64 | -62.41 | 10.44 | |
| 1987 | 1.48 | 1.46 | -41.30 | -27.15 | -6.00 | |
| 1991 | 0.67 | 0.87 | 81.80 | -35.88 | 7.99 | |
| 1997 | 1.57 | 2.29 | 163.86 | 130.25 | 17.85 | |
| 2002 | 0.77 | 1.18 | 53.16 | 120.52 | 11.85 | |
| 2015 | 1.52 | 2.38 | 198.09 | -4.68 | 19.60 | |
| La Niña发展型 | 1983 | 0.32 | -0.76 | -66.89 | -50.72 | -12.30 |
| 1984 | -0.30 | -0.57 | 85.90 | 34.78 | 7.88 | |
| 1995 | -0.27 | -0.93 | -64.47 | -47.51 | -10.89 | |
| 2016 | -0.32 | -0.66 | -59.73 | 3.89 | -1.29 | |
| 2017 | 0.11 | -0.62 | -28.42 | 6.29 | -4.78 | |
| 2020 | -0.43 | -1.11 | -77.03 | -64.18 | -8.20 | |
| La Niña持续型 | 1964 | -0.61 | -0.79 | -80.39 | -32.07 | -9.73 |
| 1970 | -0.56 | -0.79 | -17.10 | -24.89 | 0.72 | |
| 1971 | -0.77 | -0.88 | 14.09 | 3.86 | 1.20 | |
| 1973 | -1.09 | -1.70 | -50.89 | -25.72 | -10.77 | |
| 1974 | -0.56 | -0.59 | 45.36 | 40.05 | 3.38 | |
| 1975 | -1.10 | -1.45 | -25.24 | 9.88 | -0.94 | |
| 1988 | -1.24 | -1.49 | 32.57 | 26.51 | 7.09 | |
| 1998 | -0.68 | -1.38 | -89.69 | -66.46 | -14.57 | |
| 1999 | -1.08 | -1.29 | -33.43 | 8.23 | -1.71 | |
| 2000 | -0.57 | -0.64 | 9.76 | 37.51 | 3.60 | |
| 2007 | -0.61 | -1.30 | 14.20 | 6.18 | 2.38 | |
| 2010 | -1.02 | -1.61 | -10.73 | -60.15 | -0.73 | |
| 2011 | -0.51 | -0.98 | 30.78 | -5.22 | -0.99 |
距平为相对于1961-2021年的多年平均值(Anomaly is relative to the multi-year average from 1961 to 2021) |
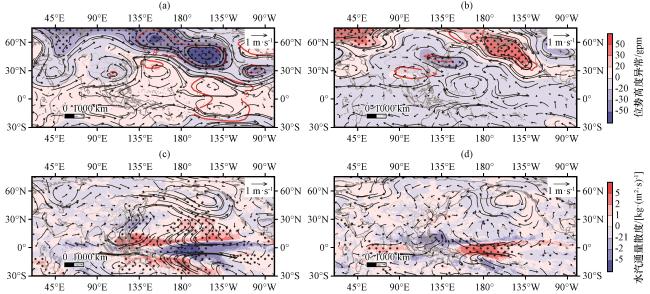
图7 1961 -2021 年El Niño持续型(a, c)和La Niña发展型(b, d)合成的冬季环流 (a, b)500 hPa位势高度异常(填色, 单位: gpm)、 风场异常(箭头, 单位: m·s-1)、 温度异常(红色等值线, ); (c, d)850 hPa环流异常(箭头, 单位: m·s-1)和水汽通量散度[填色, 单位: kg·(m2 s)-1]; 打点区域表示通过90%信度检验Fig.7 Composite circulation of El Niño persistent type(a, c) and La Niña development type(b, d) from 1961 to 2021.(a, b) 500 hPa geopotential height anomaly (shading, unit: gpm), wind field anomaly (arrow, unit: m·s-1), and temperature anomaly (red lines, unit: ℃); (c, d) 850 hPa wind speed anomaly (arrow, unit: m·s-1) and water vapor flux divergence [shading, unit: kg·(m2 s)-1]; the dotted areas indicate passing the 90% significance test |
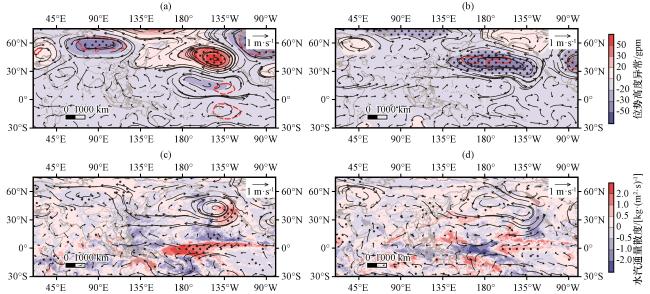
图8 1961 -2021年去掉ENSO的印度洋海温异常(IOBW_I)偏暖年(a, c)和偏冷年(b, d)合成的冬季环流 (a, b)500 hPa位势高度异常(填色, 单位: gpm)、 风场异常(箭头, 单位: m·s-1)、 温度异常(红色等值线, 单位: ); (c, d)850 hPa环流异常(箭头, 单位: m·s-1)和水汽通量散度[填色, 单位: kg·(m2 s)-1], 其中打点区域表示通过90%信度检验Fig.8 Composite circulation of anomalously cold(b, d) and warm(a, c) Indian Ocean SST removed ENSO signal (IOBW_I) from 1961 to 2021.(a, b) 500 hPa geopotential height anomaly (shading, unit: gpm), wind field anomaly (arrow, unit: m·s-1), and temperature anomaly (red lines, unit: ℃); (c, d) 850 hPa wind speed anomaly (arrow, unit: m·s-1) and water vapor flux divergence [shading, unit: kg·(m2 s)-1], the dotted areas indicate passing the 90% significance test |